Overview
While US private equity and venture capital struggled during third quarter 2015, they both outperformed the S&P 500, the Russell 2000® small-cap, and the Nasdaq Composite indexes, as indicated by the Cambridge Associates LLC benchmark indexes of the two alternative asset classes. Over the first nine months of the year, venture capital and private equity results were positive (with venture capital enjoying the stronger returns) and in the public markets, most indexes were down due to poor performance in the third quarter. Over the past 20 and 25 years, private equity and venture capital indexes have beaten the public markets handily.
The third quarter return of -1.4% for the Cambridge Associates LLC US Private Equity Index® marked the benchmark’s first negative quarter in three years and the -0.4% return for the Cambridge Associates LLC US Venture Capital Index® represented that benchmark’s first down quarter since 2011. While enjoying similar runs of positive performance prior to 2015, public market returns were anemic during the first half of 2015 and nosedived during the third quarter.
The Cambridge Associates indexes are derived from performance data compiled for funds that represent the majority of the institutional capital raised by private equity and venture capital partnerships. The Cambridge Associates LLC US Private Equity Index® includes funds raised between 1986 and 2015 and the Cambridge Associates LLC US Venture Capital Index® represents funds raised between 1981 and 2015. Table 1 shows private equity and venture capital returns based on the performance data collected versus indexes tracking large- and small-capitalization public equities—the Nasdaq Composite, the Russell 2000®, and the S&P 500.
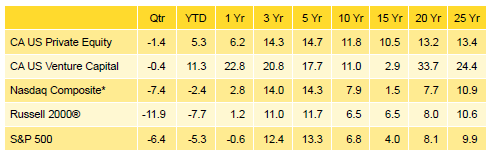
Table 1. US Private Equity and Venture Capital Index Returns
Periods Ended September 30, 2015 • US$ Terms • Percent (%)
Sources: Cambridge Associates LLC, Frank Russell Company, Standard & Poor’s, and Thomson Reuters Datastream.
Note: Because the US Private Equity and Venture Capital indexes are capital weighted, the largest vintage years mainly drive the indexes’ performance.
* Capital change only.
Third Quarter 2015 Highlights
- As of September 30, 2015, the private equity benchmark outperformed the Russell 2000® and S&P 500 indexes tracking small and large public companies, in all nine time horizons listed in Table 1. The outperformance over the three- and five-year periods, a reversal from what was reported as of June 30, was slim and mainly driven by the 2015 results. The venture index’s success against the Russell 2000® and the S&P 500 has been similar to the private equity index, in that it outperformed both small and large public companies in all but one of the time periods listed in the table. The glaring exception continues to be the 15-year period, which encompasses both the technology crash in 2000 and the global financial crisis later in the decade. The venture index’s performance against the tech-heavy Nasdaq has been strong, outperforming it in all periods.
- Public companies accounted for nearly 15% in the private equity index and 13% of the venture capital index. Non-US companies represented about 17% and approximately 10% of the private equity and venture indexes, respectively.
Private Equity Performance Insights
- Returns for all but six vintage years from 1998 through 2015 (which represented virtually 100% of the index’s value) were negative for the quarter. The vintages that were up in the quarter represented 17% of the index’s value.
- Among the six vintage years that were meaningfully sized (representing at least 5% of the index), returns ranged from -3.2% to -0.3% (Table 2); the 2012 vintage lost the least amount of the large vintages, while funds formed in 2008 struggled the most. Led by 2007, the top six vintage years by size together represented 77% of the index’s value. The only other vintage years that came close to qualifying as key performance drivers were the 2009 and 2013 vintages, which represented 4.9% and 4.0% of the benchmark’s value, respectively.
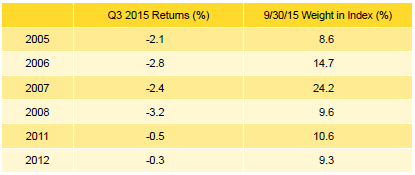
Table 2. Private Equity Vintage Year Returns: Net Fund-Level Performance
Note: Vintage year fund-level returns are net of fees, expenses, and carried interest.
- Vintage year 2012’s roughly flat return was driven largely by nearly equal write-ups in health care and write-downs in energy. For the 2008 vintage, write-downs in energy companies were the primary driver of performance. At more than 24% of the index’s value, the 2007 vintage year was the biggest in the benchmark. Write-downs in energy and construction-related businesses were the key drivers of that vintage year’s -2.4% return for the quarter.
- During the third quarter, fund managers called $17.8 billion, a 6.1% decrease from the previous quarter. Limited partner (LP) distributions equaled $35.7 billion, a 9.8% quarter-over-quarter decline. The third quarter marked the 15th consecutive (and 18th out of the last 20) quarter when distributions surpassed contributions. Contributions and distributions in the first nine months of 2015 trailed the same period of 2014, but contributions fell more steeply. The year-over-year drop in contributions was 23% and the fall in distributions was 9%.
- Funds raised in 2007, 2008, and 2011–14 all called more than $1 billion and the six vintages combined to call $16.7 billion, or 94% of total capital called. Alone, vintages 2011, 2012, and 2014 drew down $11.9 billion, or almost two-thirds of what all managers called in the quarter. Vintage years 2005 through 2011 all distributed more than $1.4 billion during the quarter. The seven vintages distributed nearly $31 billion, or 86% of the total. The two largest vintages, 2006 and 2007, combined to distribute $16.7 billion during the quarter.
- All but one of the seven sectors representing at least 5% of the private equity index earned positive returns during the quarter (Table 3). Energy’s return of -11.9% was the exception. Software earned the highest return at 5.9%. All but two of the vintages from 1998 through 2015 experienced declines in energy company valuations, and five of them (2006–08, 2011, and 2012) saw energy sector declines of more than $1.0 billion. Write-ups in the 2006 vintage year were by far the largest contributors to the software sector’s performance. Returns for the other seven sectors that represented at least 1% of the index (media, industrial, materials, electronics, transportation, construction, and hardware) were all negative.
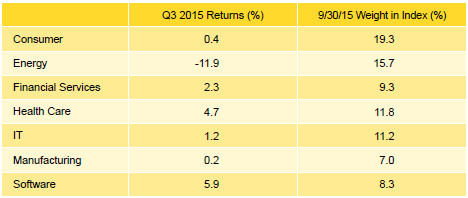
Table 3. Private Equity Sector Returns: Gross Company-Level Performance
Note: Industry-specific gross company-level returns are before fees, expenses, and carried interest.
- Consumer, energy, health care, IT, and software companies all attracted more than $2 billion of investments during the third quarter; combined those sectors garnered nearly three-quarters of the invested capital. Over the long term, these five sectors represented 62% of the capital invested.
Venture Capital Performance Insights
- During the third quarter, the majority of vintage years from 2000 through 2015 experienced negative returns, and the results for the top-sized vintages were fairly dispersed. The best return of the large vintages, 2011, was 7.0%, while the worst vintage year was 2005 at -3.4% (Table 4). Notably, vintage year 2004, which represented just shy of 5%, had a worse return at -4.4%. Only vintages 2010–14 experienced positive returns during the quarter.
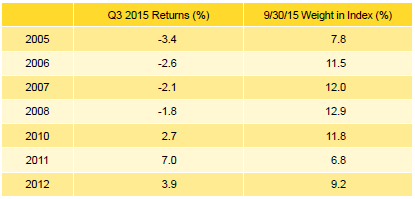
Table 4. Venture Capital Vintage Year Returns: Net Fund-Level Performance
Note: Vintage year fund-level returns are net of fees, expenses, and carried interest.
- For the best-performing vintage, 2011, health care and information technology sector write-ups were the primary drivers of performance; for the lowest performer, 2005, health care write-downs fueled the return. Vintage year 2004 losses were driven by write-downs in both health care and IT.
- Performance was weak among the largest vintage years, 2006–08 and 2010, ranging from -2.6% to 2.7%. The 2010 vintage return was supported by more than $800 million in write-ups across software and IT. Health care contributed to the struggle during the quarter across all of the largest vintages, with over $1.2 billion in write-downs.
- Venture capital fund managers called $3.6 billion from investors during the third quarter, a 13.0% decrease from the previous quarter. Distributions from venture funds were $5.1 billion, a 45.1% drop from the second quarter and the lowest quarterly output since second quarter 2013. Distributions outpaced contributions for the 15th consecutive quarter.
- Funds formed from 2012 to 2014 were responsible for 64% of the total capital called during the quarter; each of these three vintages called more than $550 million, with an average of $773 million. Distributions from vintage years 2004, 2006–08, and 2010 totaled $3.5 billion, representing 69% of the total from the quarter. Each of these five vintages distributed more than $550 million in the quarter, led by vintage year 2006, which distributed nearly $1.0 billion.
- The returns for the three sectors that represented at least 5% of the value of the index ranged from -3.9% (health care) to 3.1% (software) in the third quarter (Table 5). Software valuation increases were widespread, but roughly half occurred within vintage year 2010 funds. Write-downs for health care companies were driven by the 2004–07 and 2010 vintage year funds, which each had more than $200 million of valuation decreases in the sector. Of note, electronics companies represented more than 4% of the index and they were down 1.3% in the quarter.
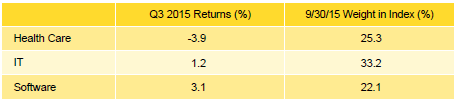
Table 5. Venture Capital Sector Returns: Gross Company-Level Performance
Note: Industry-specific gross company-level returns are before fees, expenses, and carried interest.
- In keeping with historical norms, IT, health care, and software companies attracted the lion’s share of the dollars invested by venture capital managers in the index. At 84.4% of capital invested, the amount is more than 8% higher than the long-term trend for the three sectors combined.
About the Cambridge Associates LLC Indexes
Cambridge Associates derives its US private equity benchmark from the financial information contained in its proprietary database of private equity funds. As of September 30, 2015, the database comprised 1,231 US buyouts, private equity energy, growth equity, and mezzanine funds formed from 1986 to 2015, with a value of $598 billion. Ten years ago, as of September 30, 2005, the index included 632 funds whose value was $190 billion.
Cambridge Associates derives its US venture capital benchmark from the financial information contained in its proprietary database of venture capital funds. As of September 30, 2015, the database comprised 1,605 US venture capital funds formed from 1981 to 2015, with a value of roughly $196 billion. Ten years ago, as of September 30, 2005, the index included 1,080 funds whose value was about $60 billion.
The pooled returns represent the net end-to-end rates of return calculated on the aggregate of all cash flows and market values as reported to Cambridge Associates by the funds’ general partners in their quarterly and annual audited financial reports. These returns are net of management fees, expenses, and performance fees that take the form of a carried interest.
Both the Cambridge Associates LLC US Venture Capital Index® and the Cambridge Associates LLC US Private Equity Index® are reported each week in Barron’s Market Laboratory section. In addition, complete historical data can be found on Standard & Poor’s Micropal products and on our website, www.cambridgeassociates.com.
About the Public Indexes
The Nasdaq Composite Index is a broad-based index that measures all securities (over 3,000) listed on the Nasdaq Stock Market. The Nasdaq Composite is calculated under a market capitalization weighted methodology.
The Russell 2000® Index includes the smallest 2,000 companies of the Russell 3000® Index (which is composed of the largest 3,000 companies by market capitalization).
The Standard & Poor’s 500 Composite Stock Price Index is a capitalization-weighted index of 500 stocks intended to be a representative sample of leading companies in leading industries within the US economy. Stocks in the index are chosen for market size, liquidity, and industry group representation.