Overview
Second quarter returns for the Cambridge Associates LLC US Private Equity Index® and the Cambridge Associates LLC US Venture Capital Index® were 4.0% and 0.7%, respectively. The benchmark indexes for both alternative asset classes rebounded after a poor first quarter (essentially flat for US private equity and negative for US venture capital), though US venture capital remains in negative territory for the year. Private equity outperformed the large-cap S&P 500, the small-cap Russell 2000®, and the tech-heavy Nasdaq Composite indexes in second quarter, while venture capital underperformed two of the three (Table 1).

Table 1. US Private Equity and Venture Capital Index Returns
Periods Ended June 30, 2016 • USD Terms • Percent (%)
Sources: Cambridge Associates LLC, Frank Russell Company, Standard & Poor’s, and Thomson Reuters Datastream.
Notes: Private indexes are pooled horizon internal rates of return, net of fees, expenses, and carried interest. Because the US Private Equity and Venture Capital indexes are capital weighted, the largest vintage years mainly drive the indexes’ performance. Public index returns are shown as both time-weighted returns (average annual compound returns) and dollar-weighted returns (mPME). The CA Modified Public Market Equivalent replicates private investment performance under public market conditions. The public index’s shares are purchased and sold according to the private fund cash flow schedule, with distributions calculated in the same proportion as the private fund, and mPME net asset value is a function of mPME cash flows and public index returns.
* Constructed Index: Data from 1/1/1986 to 10/31/2003 represented by Nasdaq Price Index. Data from 11/1/2003 to present represented by Nasdaq Composite.
Over the past five years (20 quarters), both private indexes have produced 17 positive quarters and double-digit returns, 11.7% for private equity and 13.2% for venture capital. Public market indexes have enjoyed similar runs of positive returns. Cambridge Associates’ modified public market equivalent (mPME) calculation is a private-to-public comparison that seeks to replicate private investment performance under public market conditions. On an mPME basis, the S&P 500 and Nasdaq have had better performance over the past five years than the private asset classes; over longer horizons the private asset classes have generally outperformed.
Second Quarter 2016 Highlights
- As of June 30, 2016, the private equity benchmark outperformed indexes tracking both large and small public companies in six of the nine time horizons listed in the table above based on mPME returns. The exceptions were the one-year (when private equity bested only the Russell 2000® and Nasdaq), three-year, and five-year periods. The venture capital index has had mixed results against the public indexes, but only trailed all three indexes listed in the table in one time period, the 15 years ending in June 30, 2016. That period encompasses both the fallout from the 1990s tech bubble and the 2007–08 global financial crisis.
- Public companies accounted for 14.5% of the private equity index and 11.1% of the venture capital index. Non-US company exposure in the private equity and venture capital indexes has remained fairly steady over the last nine months, close to 18% in the private equity benchmark and between 8% and 9% in the venture index.
Private Equity Performance Insights
- During second quarter 2016, all but one of vintage years 2004 –15 (which represented 97% of the index’s value) were postive; vintage year 2004 was the exception, down less than 1%. Among the nine vintage years that were meaningfully sized (representing at least 5% of the index), pooled returns ranged from vintage year 2005’s 2.0% to vintage year 2012’s 9.1% (Table 2). Led by 2007, the top nine vintage years by size together represented 89% of the index’s value. The 2010 vintage was close to qualifying as a key performance driver, representing 4.0% of the benchmark’s value. Over the last year, the number of meaningfully sized vintage years has expanded from six to nine.
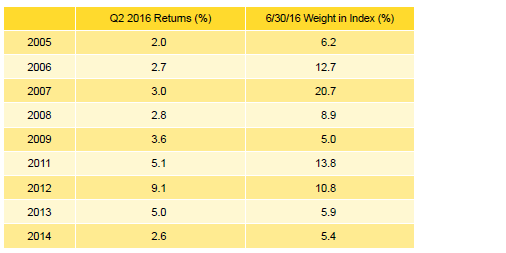
Table 2. Private Equity Vintage Year Returns: Net Fund-Level Performance
Note: Vintage year fund-level returns are net of fees, expenses, and carried interest.
- Top-performing vintage year 2012 had write-ups in all but two sectors, and the largest dollar increases were in consumer and hardware; only transportation companies suffered meaningful write-downs. For the worst-performing 2005 vintage, write-ups in energy, health care, and IT were offset by write-downs in financial services, industrials, and consumer. The largest vintage year in the benchmark, 2007, represented 21% of the index’s value. Its largest write-ups (in dollars) were in the vintage’s two biggest sectors, consumer and energy, and it suffered meaningful write-downs in the third largest sector, health care.
- During the second quarter, limited partners (LPs) in funds included in the US private equity benchmark contributed $23.0 billion and received distributions of $35.1 billion. While capital calls rose about 15% from the first quarter, distributions nearly doubled. This marks the 20th time in the last 23 quarters (dating back to fourth quarter 2010) that distributions have outnumbered contributions. In the first six months of 2016, LP contributions equaled about $43 billion, an increase of almost $6 billion from the same time period in 2015. At roughly $53 billion, first half 2016 distributions were about $15 billion lower than during the same period in 2015.
- Funds raised in 2011, 2012, and 2015 each called more than $3 billion; the three vintages combined to call $13.7 billion, or 59% of total capital called. Vintages 2005–07 and 2011 each distributed more than $3 billion during the quarter. Combined, they distributed $25.4 billion, or 72% of the total. Leading the way in distributions were vintages 2006 and 2007, which together distributed $17.8 billion during the quarter.
- All seven sectors representing at least 5% of the private equity index earned positive returns during the quarter (Table 3). Energy valuations bounced back and the sector earned the best return among the index’s large constituents; financial services produced the lowest return for the quarter. Three vintage years—2007, and 2011 and 2012—saw energy company valuations increase by more than $1 billion. In the financial services sector, write-ups in 2006, 2007, and 2011–13 were partially offset by write-downs in vintages 2005 and 2008. The four largest sectors—consumer, energy, health care, and IT—earned a weighted dollar return of 4.3% for the quarter, outperforming the index’s total gross return by nearly 60 bps. The transportation and electronics sectors were the only sectors in the benchmark with negative returns, but neither represented more than 1.25% of the index.
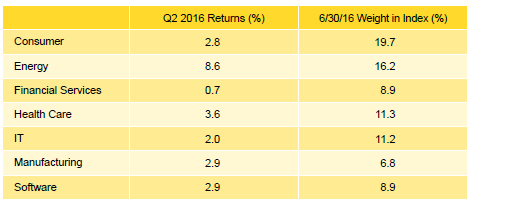
Table 3. Private Equity Sector Returns: Gross Company-Level Performance
Note: Industry-specific gross company-level returns are before fees, expenses, and carried interest.
- Three sectors—energy, consumer, and software (in rank order)—attracted about 53% of the capital invested during the quarter. Historically, those three sectors have garnered closer to 41% of investments. Software represented most of the difference between the quarter’s cash flow and the long-term norm.
Venture Capital Performance Insights
- Quarterly returns were tightly distributed across the venture capital benchmark’s eight top-sized vintages, which represented 77% of the index (Table 4). Vintage year 2006 had the best return of the group at 2.1%; vintage year 2005 had the worst at -0.5%. With the exception of 2006, no vintage from 2000 on earned a quarterly return above 2.0%.

Table 4. Venture Capital Vintage Year Returns: Net Fund-Level Performance
Note: Vintage year fund-level returns are net of fees, expenses, and carried interest.
- For the best-performing vintage, 2006, IT company write-ups were the primary driver of performance. As for the lowest performer, 2005, write-ups and write-downs across all sectors were paltry.
- Performance was subpar among the four largest vintage years—2007, 2008, 2010, and 2012—ranging from -0.1% to 1.5%. Health care was a key positive contributor to all of these vintage years, but other sectors contributed as well. Manufacturing bolstered the 2007 vintage’s performance, while IT and software boosted the 2010 and 2012 funds, respectively.
- Venture capital fund managers called $3.0 billion from investors during the second quarter, a 14% increase from the previous quarter but the fourth lowest quarterly capital call amount in ten years (since third quarter 2006). Distributions from venture funds were $4.6 billion, a nearly 25% jump from the first quarter, but about half of what was distributed in the same quarter in 2015. Second quarter distributions represented the third lowest quarterly output in the past 17 quarters (since second quarter 2012). Distributions have outpaced contributions in every quarter since the beginning of 2012.
- Funds formed in 2012–15 were responsible for 84% of the total capital called during the quarter; each of these four vintages called more than $225 million, with an average of $627 million. Distributions were more widespread than contributions; vintage years 2000, 2001, 2004–08, 2010, and 2011 all distributed more than $240 million in the quarter and together represented 84% of the quarter’s total. The 2007 vintage led all with more than $1 billion in distributions.
- All three sectors that represented at least 5% of the value of the index had positive returns in the second quarter (Table 5). The best return was earned by the health care sector and the lowest return was posted by software companies. Write-ups for health care companies were mainly driven by the 2007–08 and 2012 vintage years, all of which had more than $125 million of valuation increases in the sector. Software valuation increases were primarily driven by 2012 vintage year funds; write-downs in 2008 vintage year funds partially offset these gains. IT, the largest of the three sectors, posted a 1.1% return for the quarter, buoyed by substantial valuation increases in the 2006 vintage year funds.

Table 5. Venture Capital Sector Returns: Gross Company-Level Performance
Note: Industry-specific gross company-level returns are before fees, expenses, and carried interest.
- In keeping with historical norms, health care, IT, and software companies attracted the lion’s share of the dollars invested by venture capital managers in the index. At 85% of capital invested, the amount is more than 8% higher than the long-term trend for the three sectors combined.
About the Indexes
Cambridge Associates derives its US private equity benchmark from the financial information contained in its proprietary database of private equity funds. As of June 30, 2016, the database comprised 1,321 US buyouts, private equity energy, growth equity, and mezzanine funds formed from 1986 to 2016, with a value of $610 billion. Ten years ago, as of June 30, 2006, the index included 704 funds whose value was $227 billion.
Cambridge Associates derives its US venture capital benchmark from the financial information contained in its proprietary database of venture capital funds. As of June 30, 2016, the database comprised 1,653 US venture capital funds formed from 1981 to 2016, with a value of roughly $185 billion. Ten years ago, as of June 30, 2006, the index included 1,143 funds whose value was about $67 billion.
The pooled returns represent the net end-to-end rates of return calculated on the aggregate of all cash flows and market values as reported to Cambridge Associates by the funds’ general partners in their quarterly and annual audited financial reports. These returns are net of management fees, expenses, and performance fees that take the form of a carried interest.
Both the Cambridge Associates LLC US Venture Capital Index® and the Cambridge Associates LLC US Private Equity Index® are reported each week in Barron’s Market Laboratory section. In addition, complete historical data can be found on Standard & Poor’s Micropal products and on our website, www.cambridgeassociates.com.
About the Public Indexes
The Nasdaq Composite Index is a broad-based index that measures all securities (over 3,000) listed on the Nasdaq Stock Market. The Nasdaq Composite is calculated under a market capitalization–weighted methodology.
The Russell 2000® Index includes the smallest 2,000 companies of the Russell 3000® Index (which is composed of the largest 3,000 companies by market capitalization).
The Standard & Poor’s 500 Composite Stock Price Index is a capitalization-weighted index of 500 stocks intended to be a representative sample of leading companies in leading industries within the US economy. Stocks in the index are chosen for market size, liquidity, and industry group representation.