Overview
Funds in the Cambridge Associates LLC benchmark indexes for US private equity and venture capital earned double-digit returns in 2014, but neither index performed as well as it did in 2013, which was the best year for venture capital since the bubble in 2000. Many of the large sectors in the private asset classes had strong returns for the year, particularly health care in the private equity benchmark and software in venture capital; the energy sector significantly hampered the private equity index’s return. In the six years since 2008, the private equity index has earned positive returns in all but three quarters and the venture capital index has risen in all but two quarters. For 2014, only venture capital outperformed public equities in the fourth quarter and the year. During the 10- and 15-year periods ending in 2014, private equity outperformed venture capital and both private asset classes outpaced the S&P 500.
The Cambridge Associates indexes are derived from performance data compiled for funds that represent the majority of the institutional capital raised by private equity and venture capital partnerships. The Cambridge Associates LLC US Private Equity Index® includes funds raised between 1986 and 2014 and the Cambridge Associates LLC US Venture Capital Index® represents funds raised between 1981 and 2014. Based on the performance data collected, private equity and venture capital returns versus indexes tracking large- and small-cap public equities—the Nasdaq Composite, the Russell 2000® Composite, and the S&P 500—are shown in Table 1.
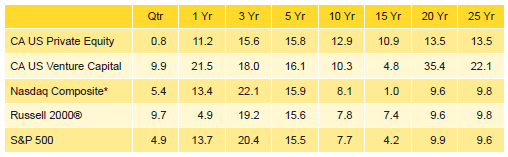
Table 1. US Private Equity and Venture Capital Index Returns
US$ Terms • Percent (%)
Sources: Cambridge Associates LLC, Dow Jones & Company, Inc., Frank Russell Company, Standard & Poor’s, and Thomson Datastream.
Note: Because the US Private Equity and Venture Capital indexes are capital weighted, the largest vintage years mainly drive the indexes’ performance.
* Capital changes only.
Fourth Quarter and Calendar Year 2014 Highlights
- As detailed in Table 1, the toughest time periods for the private equity index versus public equities were the most recent quarter, and the one- and three-year periods, due to strong public market performance in 2012 and 2013 and the negative impact from energy investments in 2014. The venture capital index has had more success in outperforming the public markets, only underperforming all three public indexes listed in the three-year period. The venture index’s worst absolute time period was the 15-year horizon, due to the tech bubble at the beginning and the global financial crisis later in the period. The most interesting time period in the table is the five years ending in 2014 when all indexes shown, private and public, earned returns between 15.5% and 16.1%.
- As of December 31, 2014, public companies accounted for 17.7% of both the private equity and venture capital indexes, representing a significant decrease from the end of 2013. Exposures to non-US companies were 17.8% and 10.5% for the private equity and venture capital benchmarks, respectively.
- In 2014, for both private equity and venture capital, the best-performing sectors were health care, IT, and software.
Private Equity Performance Insights
Amid declining energy prices and a strong dollar, US public equities, led by small companies, turned in a solid performance during fourth quarter 2014, while the Cambridge Associates LLC US Private Equity Index® ended the year with a modestly positive quarterly return, 0.8%. For the year, the index returned 11.2%, a sizable decrease from 2013. In the fourth quarter, portfolio company valuations increased across nearly all vintage years from 1998 through 2014 (the exceptions were vintages 2001, 2002, 2008, and 2010); when combined, the funds from all of the vintages with increased valuations saw asset values improve by ∼$6.1 billion. In dollar terms, valuations grew most for consumer companies and fell hardest in energy.
According to Dealogic, 23 PE-backed companies went public in the fourth quarter at a value of $7.7 billion, making it the second best quarter of the year for PE-backed initial public offerings (IPOs). During 2014, 78 PE-backed companies went public, fetching $30.0 billion, equaling the number of IPOs in 2013 but trailing that year’s total value by about $600 million. Notable IPOs took place in a variety of sectors; two of the three largest (Ally Financial and Santander) were financial services companies.
Similar to 2013, the quarter and year ended December 31, 2014, were reasonably active periods for mergers & acquisitions (M&A) involving PE-backed companies. Fourth quarter saw 202 M&A transactions, down slightly from the 209 in the third quarter. The values of 62 of those deals (30.7%) were disclosed to the public, on par with the previous quarter’s 66 (31.6%). Based on publicly available values, the average transaction size rose from $442 million in third quarter to $489 million in fourth quarter. The 814 M&A transactions in 2014 were an increase over the 733 from the prior year. The values of 263 deals were disclosed to the public in 2014 and the average size was approximately $455 million per transaction.
Six vintage years, 2005–08 and 2011–12, represented at least 5% of the index’s value each and nearly 80% of the total at the end of 2014 (Table 2). Fourth quarter returns for these “meaningfully sized” vintages ranged from -0.9% for the 2008 funds to 2.1% for the 2005 funds, and were generally lower than returns in the third quarter (2005 and 2006 excepted). In 2014, the IPO and M&A environments remained active so exits were still plentiful, but public market returns were more muted than they were in 2013 and depressed energy prices negatively impacted unrealized valuations for a key sector.
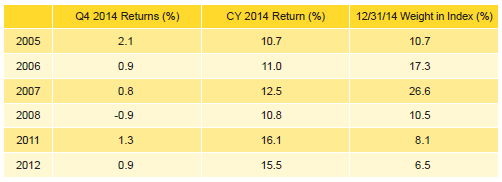
Table 2. Private Equity Vintage Year Returns: Net Fund-Level Performance
Note: Vintage year fund-level returns are net of fees, expenses, and carried interest.
The fourth quarter return for the largest vintage, 2007, matched that of the index due mainly to the losses in energy holdings. For the full year, vintage year 2007 funds benefited most from elevated valuations in the health care sector, but write-ups in consumer (second largest), chemicals, software, financial services, and IT were also substantial. In 2006, the second largest vintage year, gains in consumer, health care, and IT for both the fourth quarter and the year were partially offset by significant write-downs in energy and financial services. The quarter and year’s best-performing vintage was 2009, which represented 4.6% of the index and where the consumer sector was the largest contributor to performance.
Six of the Seven Key Sectors in the Private Equity Index Earned Positive Returns for the Quarter; Energy Was the Exception. All but one of the seven meaningfully sized sectors produced positive returns during fourth quarter 2014 (Table 3). The three largest sectors—consumer, energy, and health care—composed more than 49% of the index’s total value and returned between -14.1% and 6.0%. On a dollar-weighted basis, the three earned a gross return of -2.2%, underperforming the total benchmark’s gross performance by 3.3%. Among the seven meaningfully sized sectors, software posted the highest return for the quarter; the 2007 and 2011 vintage years contributed most to the performance and accounted for nearly 39% of the sector’s market value at year-end. The energy sector’s strongly negative return resulted largely from write-downs of more than $1 billion each in vintage years 2005–08 and 2011. During the quarter, 80% of the capital deployed by fund managers was allocated to six sectors (from highest to lowest): energy, consumer, IT, software, manufacturing, and health care. This percentage is almost 11% higher than historical norms; the overweights were to energy, IT, and software.
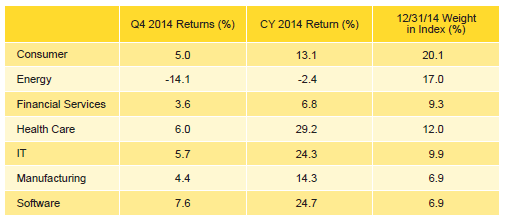
Table 3. Private Equity Sector Returns: Gross Company-Level Performance
Note: Industry-specific gross company-level returns are before fees, expenses, and carried interest.
For the year, the best- and worst-performing sectors were health care and energy, respectively. Write-ups for health care companies in vintage years 2005–07 totaled more than $12 billion and were the largest drivers of that sector’s return. The IT and software sectors were the only others that earned more than 20% for the year, with vintage years 2006 and 2007 contributing significantly to both sectors’ performance. The 2006 vintage was by far the largest negative contributor to the energy sector’s return for the year, while the 2011 and 2012 vintages were the biggest positive drivers of that sector’s performance. The three largest sectors—consumer, energy, and health care—earned 10.8% for the year, underperforming the benchmark’s total gross return by 3.3%.
Distributions Hit a Record Level in 2014; Capital Contributions Highest Since 2008. In the fourth quarter, managers in the US private equity index called $19.5 billion from limited partners and returned $40.8 billion, representing a 9.7% decrease in contributions and a 12.0% increase in distributions from last quarter. In dollar terms, capital calls fell by $2.1 billion and distributions, which equaled the third highest quarterly level seen in the 29 years that Cambridge Associates has tracked the industry, rose by nearly $4.4 billion.
Investors in funds launched from 2011 through 2014 contributed $14.2 billion, or 73% of the total capital called during the quarter; all four vintage years called more than $2.0 billion from limited partners (LPs). Conversely, each of the vintage years from 2004 through 2008 distributed more than $3.5 billion in the quarter. Investors in funds launched from 2005 through 2007 received $25.1 billion, or 61% of the capital distributed. Fourth quarter was the 12th consecutive period where distributions were higher than contributions, the longest such streak in the index’s history.
During 2014, managers in the US private equity index called $84.9 billion from LPs, $25.7 billion more than they called in 2013 and the most since 2008 (Figure 1). Total distributions in 2014 reached $153.5 billion—the largest annual amount since the index’s inception and the third year in a row when distributions were more than $100 billion. Distributions increased by $19.4 billion, or 14%, over the total reached in 2013. Credit markets remained friendly and the public markets were a bit more volatile in 2014 than they were in the two previous years. The investment environment helped to elevate purchase prices and leverage.
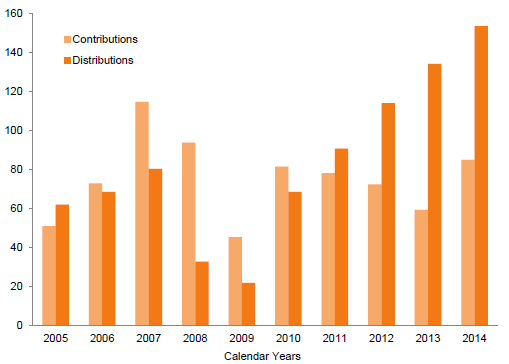
Figure 1. Private Equity Contributions and Distributions
2005–14 • US Dollar (billions)
Last year was the fourth in a row but only the eighth since the inception of the private equity index in which distributions outpaced contributions; the others were 1994, 1996, 2004, 2005, 2011, 2012, and 2013. From 2006 through 2010, when contributions surpassed distributions, private equity fund managers in the index called 1.5 times as much capital as they distributed; from 2011 through 2014 distributions outweighed contributions by a multiple of 1.7.
Venture Capital Performance Insights
In 2014, the venture capital index produced the third highest return in the past 15 years, trailing only 2013 and 2000. Health care, IT, and software were the largest contributors to the venture capital benchmark’s impressive return during the year. The IPO market continued to be strong, particularly in the first quarter, and distributions hit their second highest annual level since 2000.
According to the National Venture Capital Association (NVCA) and Thomson Reuters, 116 venture-backed companies went public in 2014 for a total IPO offer value of $15.4 billion. Both the number and value of venture-backed IPOs were up nearly 40% from 2013. The 479 venture-backed M&A deals in 2014 represented an increase of 86 from the prior year. For deals with values disclosed to the public, the average size of a venture-backed M&A transaction was $345.2 million, nearly double the value in 2013, when it was $178.0 million.
Strong Fourth Quarter Helps Index Regain Momentum. Despite a strong fourth quarter, the venture capital index did not perform as well in 2014 as it did in the previous year. Seven of the nine meaningfully sized vintage years posted double-digit returns for the year, led by the 2010 vintage’s 61.6% (Table 4). Vintage years 2005 and 2010, which together accounted for 20.6% of the index, were the largest positive contributors to the index’s performance in the fourth quarter and year. Significant write-ups in IT and software were the primary drivers of performance in both the 2005 and 2010 funds, while for the worst-performing vintage, 2004, significant write-ups in health care helped to offset the losses in other sectors. The 2000 vintage year relinquished some of its impact on the index due to distributions equaling more than 25% of the vintage’s year-end 2013 net asset value. At its peak in 2005, the 2000 vintage accounted for more than 40% of the benchmark value.
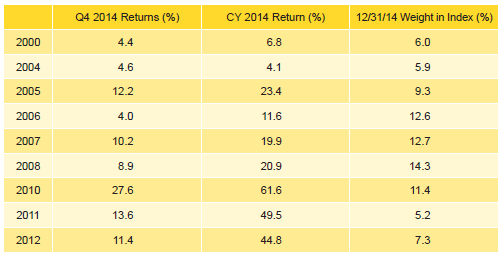
Table 4. Venture Capital Vintage Year Returns: Net Fund-Level Performance
Note: Vintage year fund-level returns are net of fees, expenses, and carried interest.
Software Posted the Highest Fourth Quarter and Annual Returns in 2014. The venture capital index remains concentrated by sector, with the three largest—IT, health care, and software—accounting for 81% of the index’s value (Table 5). With totals slightly higher than their long-term norms, nearly 83% of capital invested during the fourth quarter went into companies in these sectors. All three sectors garnered more than $1.0 billion of investment during the fourth quarter. Among these three sectors, software was the best-performing for both the quarter and the year, with returns of 20.3% and 52.4%, respectively.
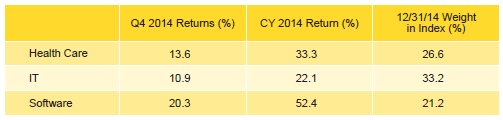
Table 5. Venture Capital Sector Returns: Gross Company-Level Performance
Note: Industry-specific gross company-level returns are before fees, expenses, and carried interest.
The eye-popping annual returns posted by software, IT, and health care were driven by valuation increases of more than $10 billion for each sector over the course of the year. Together, the three largest sectors returned 32.6% for the year, surpassing the total gross return for all portfolio companies by more than 4.3%.
2014 Venture Capital Calls and Distributions Increased From the Prior Year; Distributions Reached Highest Level Since 2000. In the fourth quarter, managers in the US venture capital index called just under $4.0 billion, an increase of $459.2 million, or 13.1%, from the previous quarter. Distributions in each quarter in 2014 outpaced those made during the same periods in 2013. Fourth quarter distributions topped all at $8.1 billion, 20.9% higher than last year’s fourth quarter, which was the high point in 2013. Similar to their private equity counterparts, venture capital funds have now distributed more capital than they called in 12 straight quarters. The venture capital index has not experienced a similar cash flow trend since the late 1990s.
Managers of funds raised in 2012, 2013, and 2014 called approximately $2.5 billion, or roughly 62% of all capital called during the quarter. All three vintages called more than $600 million, with the 2014 funds calling nearly $1.0 billion. Eight vintage years returned more than $400 million to investors during the quarter. Investors in the 2006, 2008, and 2010 vintages received more than $1 billion in distributions each, combining for 44.1% of the total distributed.
Managers in the US venture capital index called and distributed more capital in 2014 than they did in 2013 (Figure 2). Contributions increased 15.1% to $15.3 billion and distributions increased 37.3% to $30.0 billion. Distributions in 2014 were the second highest annual total of all-time, trailing only the bubble year of 2000, when they totaled nearly $57 billion.
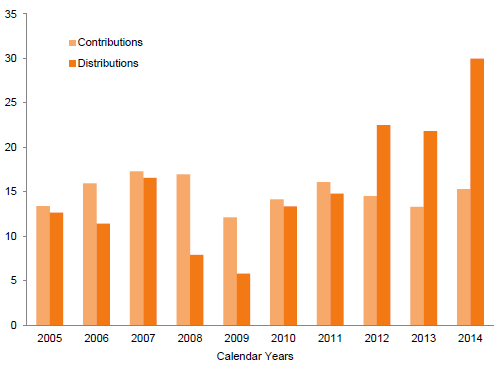
Figure 2. Venture Capital Contributions and Distributions
2005–14 • US Dollar (billions)
About the Indexes
Cambridge Associates derives its US private equity benchmark from the financial information contained in its proprietary database of private equity funds. As of December 31, 2014, the database comprised 1,199 US buyouts, private equity energy, growth equity, and mezzanine funds formed from 1986 to 2014, with a value of $625.1 billion. Ten years ago, as of December 31, 2004, the index included 575 funds whose value was $170.5 billion.
Cambridge Associates derives its US venture capital benchmark from the financial information contained in its proprietary database of venture capital funds. As of December 31, 2014, the database comprised 1,569 US venture capital funds formed from 1981 to 2014, with a value of $181.6 billion. Ten years ago, as of December 31, 2004, the index included 1,037 funds whose value was $57.6 billion.
The pooled returns represent the net end-to-end rates of return calculated on the aggregate of all cash flows and market values as reported to Cambridge Associates by the funds’ general partners in their quarterly and annual audited financial reports. These returns are net of management fees, expenses, and performance fees that take the form of a carried interest.
Both the Cambridge Associates LLC US Venture Capital Index® and the Cambridge Associates LLC US Private Equity Index® are reported each week in Barron’s Market Laboratory section. In addition, complete historical data can be found on Standard & Poor’s Micropal products and on our website, www.cambridgeassociates.com.