Overview
US private equity and venture capital funds had a tough first quarter in 2016, as indicated by the Cambridge Associates LLC benchmark indexes of the two alternative asset classes. Over the first three months of the year, private equity outperformed venture capital, but still stuggled. The Cambridge Associates LLC US Private Equity Index® eked out a return of 0.2%, the third consecutive quarter of returns of 0.5% or less. The Cambridge Associates LLC US Venture Capital Index® returned -3.3%, a drop of nearly 5 percentage points from fourth quarter. The quarter was a difficult period for private and public equity alike, with continued slow economic growth and a lackluster IPO market.
Table 1 shows private equity and venture capital returns based on the performance data collected versus indexes tracking large- and small-capitalization public equities—the Nasdaq Composite, the Russell 2000®, and the S&P 500. Beginning this quarter, public market index returns are shown as both traditional time-weighted returns and dollar-weighted returns, as measured by the Cambridge Associates modified public market equivalent (mPME). The mPME calculation is a private-to-public comparison that seeks to replicate private investment performance under public market conditions. Over any one quarter, an mPME and time-weighted return will match, but they will begin to diverge over longer time horizons because the mPME calculation takes into account the size and timing of cash flows. While mPME is by no means a perfect metric, it provides a better picture of relative public to private performance than a traditional time-weighted return.

Table 1. US Private Equity and Venture Capital Index Returns
Periods Ended March 31, 2016 • USD Terms • Percent (%)
Sources: Cambridge Associates LLC, Frank Russell Company, Standard & Poor’s, and Thomson Reuters Datastream.
Notes: Private indexes are pooled horizon internal rates of return, net of fees, expenses, and carried interest. Because the US Private Equity and Venture Capital indexes are capital weighted, the largest vintage years mainly drive the indexes’ performance. Public index returns are shown as both time-weighted returns (average annual compound returns) and dollar-weighted returns (modified public market equivalent). The CA mPME replicates private investment performance under public market conditions. The public index’s shares are purchased and sold according to the private fund cash flow schedule, with distributions calculated in the same proportion as the private fund, and mPME net asset value is a function of mPME cash flows and public index returns.
* Constructed Index: Data from 1/1/1986 to 10/31/2003 represented by Nasdaq Price Index. Data from 11/1/2003 to present represented by Nasdaq Composite.
First Quarter 2016 Highlights
- As of March 31, 2016, the private equity benchmark outperformed indexes tracking both large and small public companies in five of the eight time horizons listed in the table above based on mPME returns. The exceptions were the one quarter (when private equity bested only the Russell 2000® and Nasdaq), and three- and five-year periods ending March 31, 2016. With the exceptions of the latest quarter and the 15 years ending March 31, 2016, the venture capital index outpaced the Nasdaq, Russell 2000®, and S&P 500 on an mPME basis in all time periods listed in the table. The 15-year period was particularly difficult for venture as it encompassed the fallout from the tech bubble in the early part of the decade and the global financial crisis later in the decade.
- Public companies accounted for 16.0% of the private equity index and 11.2% of the venture capital index. Non-US company exposures in the private equity and venture capital indexes have remained fairly steady over the last six months, almost 18% in the private equity benchmark and about 9% in the venture index.
Private Equity Performance Insights
- As of the first quarter, seven vintage years represented at least 5% of the benchmark’s value, with returns for these meaningfully sized vintages in a narrow band from -0.7% for vintage year 2008 to 2.2% for vintage year 2009 (Table 2). The 2013 and 2014 vintages are on the cusp of being meaningfully sized and returned 0.0% and -0.5%, respectively. The three largest vintage years—2007, 2006, and 2011—together represented 50% of the index’s value.
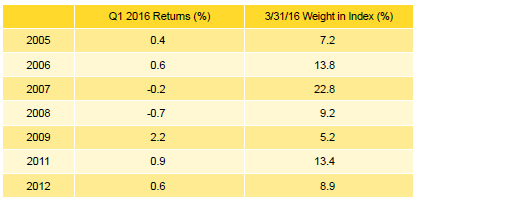
Table 2. Private Equity Vintage Year Returns:
Net Fund-Level Performance
- Consumer and health care dominated the write-ups in the vintage year 2009 funds. For the 2008 vintage, devalued energy companies were the major driver of negative performance. The top-sized 2007 vintage was the only other meaningfully sized vintage with negative performance; financial services and energy suffered the largest write-downs in this vintage, while consumer, software, and chemicals led the way for write-ups.
- During the first quarter, fund managers called $16.7 billion, a nearly 33% decrease from the previous quarter. Limited partner distributions equaled $17.7 billion, a 52% drop quarter-over-quarter. The distribution amount was the lowest quarterly level in four years (since the first quarter of 2012). While the margin between distributions and contributions was slim, the first quarter marked the 17th consecutive (and 20th out of the last 22) quarter when distributions surpassed contributions.
- Seven vintage years (2007, 2009, and 2011–15) called at least $1.3 billion, of which two, 2012 and 2014, called more than $3 billion. Six vintages (2004–07, 2009, and 2011) distributed more than $1 billion. Vintages 2005–07 together distributed $10.6 billion, or 60% of the total.
- Five of the seven sectors representing at least 5% of the private equity index earned positive returns during the quarter (Table 3). Energy and financial services were the two sectors that suffered losses. Consumer earned the highest return at 3.2%. Energy company write-downs were widespread, and the only vintage with meaningful write-ups in the sector was 2001. Similarly, most vintages, except for 2002, saw write-ups for consumer companies.
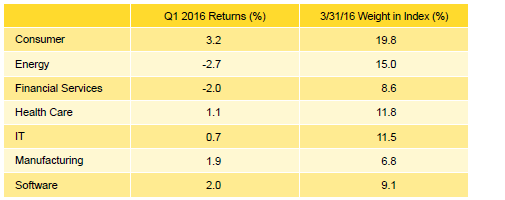
Table 3. Private Equity Sector Returns:
Gross Company-Level Performance
Note: Industry-specific gross company-level returns are before fees, expenses, and carried interest.
- Software (30%), energy (30%), and consumer (13%) companies attracted 73% of all invested capital during the quarter, which is more than 40 percentage points higher than the average invested in these sectors over the long term. Historically, software and energy companies combined garnered less than 25% of the invested capital.
Venture Capital Performance Insights
- The 2014 vintage was the only meaningfully sized vintage year to post a positive return for first quarter 2016, at 0.2%. The range of quarterly returns for the meaningfully sized vintages in the venture capital index was much wider than in the private equity index (Table 4).

Table 4. Venture Capital Vintage Year Returns:
Net Fund-Level Performance
Note: Vintage year fund-level returns are net of fees, expenses, and carried interest.
- For the best-performing vintage, 2014, the combination of a lack of significant write-downs and modest write-ups in IT and software drove its near flat performance. As for the lowest performer, 2008, write-downs were dominated (in rank order) by health care, electronics, and IT companies.
- The largest vintage, 2010, experienced a minimal shift in valuation as write-downs in health care and IT were largely offset by write-ups in software. Electronics was the primary contributor to write downs in the 2007 vintage, the third-largest vintage after 2008.
- Venture capital fund managers called $2.5 billion from investors during the first quarter, a 27.2% decrease from the previous quarter. Distributions from venture funds were $3.7 billion, a 48.8% decrease from the fourth quarter and the lowest quarterly output since first quarter 2013. Distributions have outpaced contributions in every quarter since the beginning of 2012.
- Funds formed from 2012 to 2015 were responsible for 76% of the total capital called during the quarter; each of these four vintages called more than $300 million. Distributions from vintage years 2006–08 and 2013 totaled $2.2 billion, representing 59% of the total from the quarter. Each of these seven vintages distributed more than $415 million in the quarter.
- All three sectors that represented at least 5% of the value of the index had negative returns in the first quarter (Table 5). The best return was earned by the software sector, while the lowest was posted by health care companies. Modest write-downs for software companies were mostly offset by write-ups in the 2010 vintage year funds, which saw more than $270 million of valuation increases in the sector. Health care write-downs were widespread, led by vintages 2005, 2006, and 2008, all of which had more than $350 million in valuation decreases.

Table 5. Venture Capital Sector Returns:
Gross Company-Level Performance
Note: Industry-specific gross company-level returns are before fees, expenses, and carried interest.
- In keeping with historical norms, IT, health care, and software companies attracted the lion’s share of the dollars invested by venture capital managers in the index. At 83% of capital invested, the amount is about 6% higher than the long-term trend for the three sectors combined.
About the Cambridge Associates LLC Indexes
Cambridge Associates derives its US private equity benchmark from the financial information contained in its proprietary database of private equity funds. As of March 31, 2016, the database comprised 1,270 US buyouts, private equity energy, growth equity, and mezzanine funds formed from 1986 to 2015, with a value of nearly $588 billion. Ten years ago, as of March, 31, 2006, the index included 687 funds whose value was nearly $217 billion.
Cambridge Associates derives its US venture capital benchmark from the financial information contained in its proprietary database of venture capital funds. As of March 31, 2016, the database comprised 1,633 US venture capital funds formed from 1981 to 2016, with a value of roughly $185 billion. Ten years ago, as of March 31, 2006, the index included 1,117 funds whose value was $66 billion.
The pooled returns represent the net end-to-end rates of return calculated on the aggregate of all cash flows and market values as reported to Cambridge Associates by the funds’ general partners in their quarterly and annual audited financial reports. These returns are net of management fees, expenses, and performance fees that take the form of a carried interest.
Both the Cambridge Associates LLC US Venture Capital Index® and the Cambridge Associates LLC US Private Equity Index® are reported each week in Barron’s Market Laboratory section. In addition, complete historical data can be found on Standard & Poor’s Micropal products and on our website, www.cambridgeassociates.com.
About the Public Indexes
The Nasdaq Composite Index is a broad-based index that measures all securities (over 3,000) listed on the Nasdaq Stock Market. The Nasdaq Composite is calculated under a market capitalization–weighted methodology.
The Russell 2000® Index includes the smallest 2,000 companies of the Russell 3000® Index (which is composed of the largest 3,000 companies by market capitalization).
The Standard & Poor’s 500 Composite Stock Price Index is a capitalization-weighted index of 500 stocks intended to be a representative sample of leading companies in leading industries within the US economy. Stocks in the index are chosen for market size, liquidity, and industry group representation.