Overview
US private equity and venture capital funds produced modest returns during third quarter 2014, though both outpaced the S&P 500 and Russell 2000® indexes, as indicated by the Cambridge Associates LLC benchmark indexes of the two alternative asset classes. Over the first nine months of the year, venture capital slightly outperformed private equity and in the public markets, large-cap equity bested small cap. Over various sub-periods within the past ten years, private equity and venture capital indexes have had mixed results against the public markets, but over the longer term they have handily beaten the public markets.
The third quarter return of 1.7% for the private equity index was substantially lower than its 5.7% performance in the previous quarter while the 2.4% return for the venture capital index was only 0.6% lower than its previous quarter’s results. The private equity benchmark has earned positive returns in nine straight quarters while the venture capital index has produced positive results in 12 straight. Public equities struggled in the third quarter but the IPO market remained healthy, and the latter benefitted the venture industry.
The Cambridge Associates indexes are derived from performance data compiled for funds that represent the majority of the institutional capital raised by private equity and venture capital partnerships. The Cambridge Associates LLC US Private Equity Index includes funds raised between 1986 and 2014 and the Cambridge Associates LLC US Venture Capital Index represents funds raised between 1981 and 2014. Based on the performance data collected, private equity and venture capital returns versus indexes tracking large- and small-cap public equities—the Nasdaq Composite, the Russell 2000® Composite, and the S&P 500—are shown in Table 1.
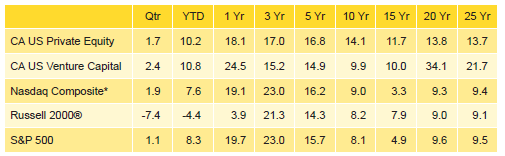
Table 1. US Private Equity and Venture Capital Index Returns
Note: Because the US Private Equity and Venture Capital indexes are capital weighted, the largest vintage years mainly drive the indexes’ performance.
* Capital change only.
Third Quarter 2014 Highlights
- As of September 30, 2014, the private equity benchmark outperformed indexes tracking both large and small public companies in seven of the nine time horizons listed in Table 1. The exceptions were the one- and three-year periods ending September 30, 2014. With the Russell 2000®’s recent negative performance, the venture index’s success against it has improved, while its performance against the S&P 500 and Nasdaq indexes has been more mixed. Venture beat the S&P 500 in all but two of the time periods listed in the table, three and five years.
- Public companies accounted for almost 18.9% of the private equity index, about 1.3% less than in the second quarter. Public company representation in the venture capital index was about 16.7%, down more than 3% from the previous quarter. Non-US company exposures in the private equity and venture capital indexes has remained fairly steady for the past year—almost 19% in the private equity benchmark and nearly 11% in the venture index.
Private Equity Performance Insights
- Returns for vintage years 2004 through 2012 (which represented 92% of the index’s value) were positive for the quarter.
- As of the third quarter, there were six vintage years that represented at least 5% of the benchmark’s value (Table 2). Among those six, returns ranged from 0.6% to 5.4%; the 2012 vintage was the best-performing while funds formed in 2005 earned the lowest return of the group. Led by 2007, the top six vintage years by size together represented almost 81% of the index’s value. The 2004 and 2009 vintages each represented more than 4% of the index during the quarter.
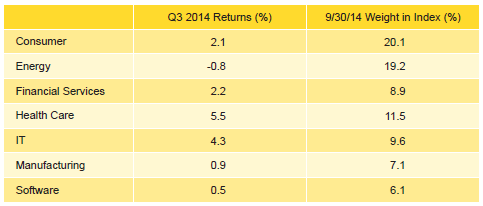
Table 2. Private Equity Vintage Year Returns: Net Fund-Level Performance
- Vintage year 2012 had write-ups in all but one sector, with the largest increases in hardware, energy, and consumer. For the 2005 vintage, write-ups in consumer, health care, and IT were nearly offset by write-downs in energy and manufacturing. For the 2007 vintage—the largest of the group—health care and IT led the way for write-ups with media, construction, and mining coming in as the worst-performing sectors.
- During the third quarter, fund managers called $19.6 billion, a 17.5% decrease from the previous quarter. Limited partner (LP) distributions equaled $35.9 billion, a 6.2% drop quarter-over-quarter. The third quarter marked the 11th consecutive (and 14th out of the last 16) quarter when distributions surpassed contributions.
- In terms of contributions and distributions, the first nine months of 2014 were much more active than the same period in 2013. Contributions were $61.2 billion in the first three quarters of 2014 and $40.0 billion for the same time period the year before. Distributions were $111.8 billion from January through September in 2014 and $90.0 billion in 2013.
- Funds raised in 2007 and 2011–13 called more than $2.7 billion and the four vintages combined to call $14.4 billion, or 73% of total capital called. Vintage years 2000 and 2003–10 all distributed more than $1 billion during the quarter. Together, funds raised from 2005–07 distributed $22.8 billion, or 63% of the total.
- All but one of the seven sectors representing at least 5% of the private equity index earned positive returns during the quarter (Table 3). Energy’s return of -0.8% was the exception. Health care earned the highest return at 5.5%. Energy company write-downs in the 2001, 2005, 2006, and 2010 vintages were the key drivers of the sector’s down quarter. Write-ups in the 2007 vintage year were the largest contributor to the health care sector’s performance.
- Consumer (22%), energy (20%), and manufacturing (11%) companies attracted about 53% of all invested capital during the quarter, which is nearly 13% higher than what has been invested in those sectors over the long term.
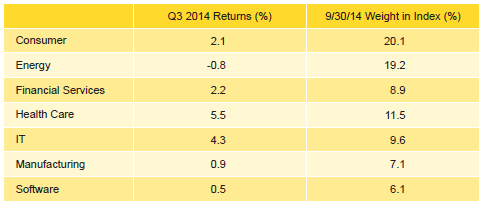
Table 3. Private Equity Sector Returns: Gross Company-Level Performance
Venture Capital Performance Insights
- Quarterly returns varied widely across the top-sized vintages in the venture capital index. The best return of the group (vintage year 2010) was 12.0%, while the worst (vintage year 2000) was -1.2% (Table 4). Further, all vintages from 2000 to 2006 suffered losses in the quarter, while all vintages from 2007 to 2013 earned positive returns.
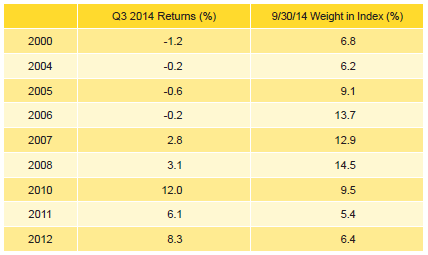
Table 4. Venture Capital Vintage Year Returns: Net Fund-Level Performance
Note: Vintage year fund-level returns are net of fees, expenses, and carried interest.
- For the best-performing vintage, 2010, software sector write-ups were the primary driver of performance; for the lowest performer, vintage year 2000, gains in IT and consumer companies were more than offset by write-downs in software and other smaller sectors.
- Performance varied among the three largest vintage years, 2006–08. Losses and gains were modest for all sectors in the 2006 vintage funds, health care and software saw significant gains in the 2007 funds, and IT dominated the write-ups in the 2008 vintage year.
- Venture capital fund managers called $3.2 billion from investors during the third quarter, an 18.7% decrease from the previous quarter. Distributions from venture funds were $7.8 billion, a 12.5% increase over the second quarter and the highest quarterly output since fourth quarter 2000. Distributions outpaced contributions for the 11th quarter in a row.
- Funds formed in 2008 and 2011–14 were responsible for 77% of the total capital called during the quarter; each of these five vintages called more than $330 million. Distributions from vintage years 2006–08 totaled $3.4 billion, representing 44% of the total from the quarter. While each of these three vintages distributed more than $1.0 billion in the quarter, nine vintages in total distributed more than $400 million.
- All three sectors that represented at least 5% of the value of the index had positive returns in the third quarter (Table 5). For the second quarter in a row, the software sector earned the best return. The lowest was posted by health care companies. Write-ups for software companies were driven mostly by two vintages, 2010 and 2012, which combined for nearly $1.5 billion of valuation increases.
- In keeping with historical norms, IT, health care, and software companies attracted the lion’s share of the dollars invested by venture capital managers in the index. At 82% of capital invested, the amount is about 5% higher than the long-term trend for the three sectors combined.
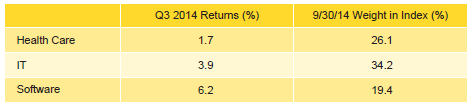
Table 5. Venture Capital Sector Returns: Gross Company-Level Performance
Note: Industry-specific gross company-level returns are before fees, expenses, and carried interest.
About the Indexes
Cambridge Associates derives its US private equity benchmark from the financial information contained in its proprietary database of private equity funds. As of September 30, 2014, the database comprised of 1,171 US buyouts, private equity energy, growth equity, and mezzanine funds formed from 1986 to 2014, with a value of nearly $639 billion. Ten years ago, as of September 30, 2004, the index included 555 funds whose value was roughly $152 billion.
Cambridge Associates derives its US venture capital benchmark from the financial information contained in its proprietary database of venture capital funds. As of September 30, 2014, the database comprised 1,522 US venture capital funds formed from 1981 to 2014, with a value of roughly $167 billion. Ten years ago, as of September 30, 2004, the index included 1,006 funds whose value was about $54 billion.
The pooled returns represent the net end-to-end rates of return calculated on the aggregate of all cash flows and market values as reported to Cambridge Associates by the funds’ general partners in their quarterly and annual audited financial reports. These returns are net of management fees, expenses, and performance fees that take the form of a carried interest.
Both the Cambridge Associates LLC US Venture Capital Index® and the Cambridge Associates LLC US Private Equity Index® are reported each week in Barron’s Market Laboratory section. In addition, complete historical data can be found on Standard & Poor’s Micropal products and on our website, www.cambridgeassociates.com.