What a difference a year makes. In the second half of 2021, investors were talking about a potential prolonged Goldilocks market. By year-end 2022, the Bloomberg US Aggregate Bond Index had posted its worst annual return on record and the S&P 500 had experienced a substantial pullback from recent historical highs. Amid this turbulence, pension plan sponsors should remember that down markets can create value opportunities for well-diversified portfolios. In fact, resulting high yields and relatively low default risk have helped to create what may be the best fixed income opportunity in decades. This paper discusses how recent developments in the fixed income market may be able to help total return-seeking pension plan portfolios, frozen plans looking to de-risk, and open or recently closed pension plan portfolios.
How Did We Get Here?
First, let’s consider what has changed and why. The Federal Reserve’s efforts to fight inflation resulted in a yield increase of 236 basis points (bps) for ten-year US Treasuries in 2022. Meanwhile, spreads widened as investors required more yield from corporate borrowers, compounding one another for investment-grade fixed income. Rising rates, when combined with the low yielding environment leading into 2022, amplified the negative returns for fixed income.
Although causing a loss, the large rise in yields has created a much more palatable rate environment for investors. In fact, yields have risen to the point where the likelihood of bonds outperforming equities in the near term is arguably much greater today than any time in the recent past. Figure 1 captures the likelihood of bonds outperforming equities over the next five years, with higher net equity returns over bonds occurring to the right of the chart and the opposite happening on the left. Although equities are still expected to outperform bonds on a five-year time horizon, the likelihood of this happening has decreased significantly. The shaded area of this chart represents a 17% increase in potential outcomes where fixed income outperforms US equities over a five-year horizon relative to a year ago.

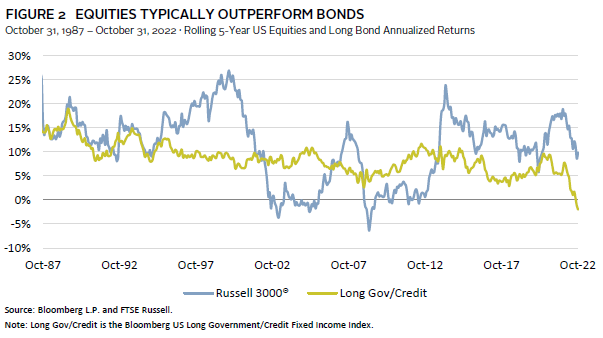
Looking historically, Figure 2 shows the five-year returns of US equities and long bonds. Over the past 40 years, equities have typically outperformed bonds, including in the 1990s and 2010s. However, there have been circumstances where bonds have outperformed equities, sometimes by as much as 10%. Interestingly, October 2017 to October 2022 is the only five-year time period over the past 40 years where bond returns were negative.
Let us delve into what a higher yield environment means for three types of pension sponsors: (1) pensions in a total return framework, such as a public plan; (2) pensions that are frozen and looking to reach their end game; and (3) pensions that have a large benefit accrual, such as recently closed or open pension plans.
Plan #1: Total Return-Seeking Plan
Due to the higher yields, fixed income should be viewed favorably over the short term by total return investors. But for corporate pension plans, this favorable arithmetic is doubly impactful, as it is not simply a function of total asset return but returns less the liability benchmark. This liability benchmark is typically linked to the performance of the corporate bond market—proxied by the yellow line in Figure 2. Therefore, a corporate plan’s funded status increases when the blue line is above the yellow line and decreases when the opposite is true.
The long-term strategic allocation of total return portfolios will continue to use equities in coordination with fixed income assets. However, the diversification benefit of bonds is much greater today than in the past few years and should not be ignored. Between 2000 and 2021, the downside protection exhibited by bonds played out quite profoundly. Ignoring the ability for bonds to contribute to portfolio growth in a higher rate environment may leave sponsors with a suboptimal allocation.
Finally, is there a short-term benefit to investing in bonds today? Although all plans have a different risk budget, investors can buy short bonds today and lock in a yield of more than 4%. Although this may be short term in nature, the risk of loss is significantly lower today than a year ago. Furthermore, plan sponsors should also consider giving intermediate private and public corporate bonds, securitized debt, and private credit a larger place in their portfolio in the current market, as these asset classes can diversify and enhance a traditional bond portfolio return.
Plan #2: Frozen, Looking to De-Risk
For many plans, the past few years have delivered a tremendous tailwind to funded status improvements. While 2022 was a historically bad year for many investors, pension plans were not hurt as much, as rising rates helped to shrink their liabilities, thus offsetting the impact of broader investment losses.
Plans that are at or above 100% funded have likely already de-risked substantially and have bought into liability-hedging assets, or liability-driven investing (LDI). For many plans that already hold a comprehensive fixed income portfolio, the next step may be to explore how that portfolio can become more resilient to future headwinds through a more customized, plan-specific strategy.
While underfunded plans may have seen their funded status hold up well as rates increased, their total plan size and shortfall are likely smaller. For example, consider this illustrative, 90% funded plan that has seen both a 20% drop in assets and liabilities:[1]Assets and liabilities experienced a (20%) return plus paid out $15.0 million in benefit payments for the year, with benefit payments assumed to be paid mid-year.
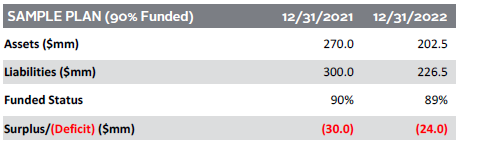
In this example, the plan’s funded status dropped slightly, but its funding deficit also got smaller as both pools decreased. As a result, the balance sheet has realized marginal improvement. For plans looking to attain 100% funded status, the shortfall may be better now than it has been in decades. Unfortunately, as rates have risen, so too has the yield on the liabilities. Consequently, the return hurdle necessary to maintain funded status has increased, making it more difficult to outearn liabilities and close the funding gap. This puts plans at a difficult crossroad: they can increase risk and close the gap with equity returns, or they can decrease risk and accept a longer investment horizon or higher contributions.
For plans looking to take on more equity risk, doing so comes with higher drawdown risk, as there are less assets in the plan to pay benefit payments. In this case, duration extension strategies can play a larger role on the fixed income side and the addition of alternatives on the growth side—such as hedge funds, private credit, and secondaries—may also play a role in managing risk.
Plans that want to de-risk may find themselves in a healthier position amid any further market drawdowns by tapping into higher yields in the shorter points on the curve via public and private investment-grade bonds and securitized debt. Whether looking to take on more risk or to de-risk, plan sponsors should make a concerted decision about what to do next, as the path forward is more complex, given the higher rate and uncertain economic environment.
Plan #3: Open or Recently Closed
The rising rate environment also provides considerable opportunities to those running an open or recently closed plan. Although there are relatively fewer plans in this position, those that have weathered investment markets over the past few decades and remained open may now be able to undertake a “de-risk and self-fund” strategy. This approach is in many ways unique to the 2023 market environment—the combination of rising rates, bespoke LDI solutions, and strong post–Global Financial Crisis equity returns provide optimal conditions in which to enact this strategy.
Before we get into the strategy, let us discuss the numbers and why these plans are in this position. Summarized here is the performance of a hypothetical open plan over the course of 2022:[2]In this example, total liability value drops 30% while funded status increases 2%. The ratio of PVB to PBO liability decreases from 1.85 to 1.65.
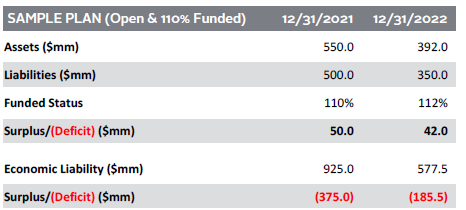
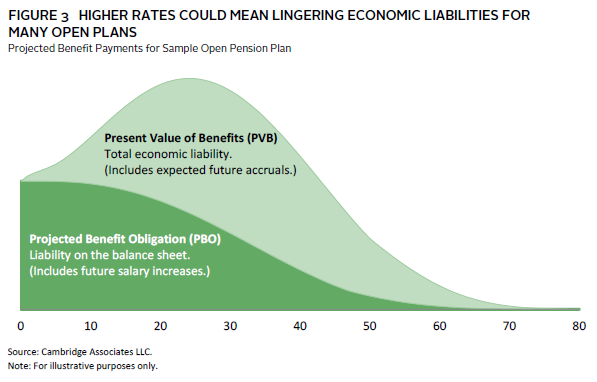
In this example, liability funded status and surplus remained mostly unchanged, but the economic liability deficit has dropped nearly $200 million. This dichotomy is due to the longer duration of the economic liabilities, which is more impacted by the change in interest rates. Figure 3 depicts cash flows for an open plan and how the mathematics of duration play out. It also serves to highlight why ignoring the economic liability may be misguided for many plans running an open plan.
For open plans like this example, a combination of many tools is necessary to enact a “de-risk and self-fund” strategy. Tapping all possible investment options is likely necessary to ensure all future benefits are funded while maintaining minimal cash contributions to the plan. The ability to offer a benefit in perpetuity with minimal contributions is unique to defined benefit pensions. For these plans, an optimal investment strategy will include the use of public markets, private equity, private credit, private real assets, long bonds, futures and swaps, and LDI diversifiers. However, the optimal combination and allocation of asset classes and strategies still depend on each plan’s circumstances—a plan is best served by a bespoke and carefully orchestrated approach.
Going forward, recently closed plans may be best served by adopting a de-risking framework, or a glide path, that de-risks the plan based upon its economic liabilities. Closed plans may be able to de-risk today and lock in gains by increasing their LDI investments. Doing so while maintaining some equity exposure will allow many plan sponsors to sleep better at night, knowing that their promises to current employees are more secure.
Conclusion
The dramatic rise in interest rates has pushed yields to a point where they have become far more economically advantageous to investors and offer more compelling potential returns as compared to recent decades. Across all plan situations, sponsors can benefit from reassessing the amount and variety of fixed income allocations as it relates to their risk budget, goals, and balance sheet. By balancing the current market environment with their unique plan circumstances, many may find themselves at an optimal risk/reward inflection point.
Even if their funded status has benefited significantly from the 2022 market pullback, plan sponsors should fully consider the fixed income opportunities presented by this environment. A customized approach that is centered on plan-specific investment goals will enable plan sponsors to take advantage of an allocation landscape that has undergone significant change.
Jacob Goldberg, Senior Investment Director, Pension Practice
Graham Landrith also contributed to this publication.
Index Disclosures
Bloomberg US Aggregate Bond Index
The Bloomberg Aggregate Bond Index or “the Agg” is a broad-based fixed income index used by bond traders and the managers of mutual funds and exchange-traded funds (ETFs) as a benchmark to measure their relative performance.
Bloomberg Long Government/Credit Bond Index
The Bloomberg US Long Government/Credit Bond Index is a broad-based flagship benchmark that measures the non-securitized component of the US Aggregate Index. It includes investment-grade, US dollar-denominated, fixed-rate Treasuries, government-related, and corporate securities.
Russell 3000® Index
The Russell 3000® Index is a market capitalization–weighted equity index maintained by FTSE Russell that provides exposure to the entire US stock market. The index tracks the performance of the 3,000 largest US-traded stocks, which represent about 97% of all US-incorporated equity securities.
Footnotes