In contrast to the public markets, and despite a weak fourth quarter, the Cambridge Associates US private equity[1]The private equity index includes buyout and growth equity funds. and venture capital indexes both produced double-digit positive returns for calendar year 2018. Public market volatility, particularly in the final quarter of the year, heavily impacted the large sectors within the private equity index. Nonetheless, almost all of them produced strong calendar year returns. When comparing the US private equity and venture capital indexes to public equities (based on modified public market equivalent [mPME] returns),[2]Cambridge Associates’ mPME calculation is a private-to-public comparison that seeks to replicate private investment performance under public market conditions. the private equity index has had more success than the venture index, but even the venture benchmark only trails all public indexes in the ten-year period (Figure 1). The private asset classes’ massive outperformance in 2018 contributed significantly to their track records against public markets over the short and medium terms; only the tech-heavy Nasdaq composite bested the venture index in any recent time horizon.
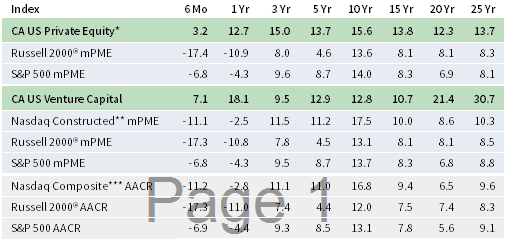
FIGURE 1 US PRIVATE EQUITY AND VENTURE CAPITAL INDEX RETURNS
Periods Ended December 31, 2018 • Percent (%)
* Includes US buyout and growth equity funds only.
** Data from 1/1/1986 to 10/31/2003 represented by the Nasdaq Price Index; data from 11/1/2003 to present by the Nasdaq Composite.
*** Capital change only.
Sources: Cambridge Associates LLC, Frank Russell Company, FTSE International Limited, Nasdaq, Standard & Poor’s, and Thomson Reuters Datastream.
Notes: Private indexes are pooled horizon internal rates of return, net of fees, expenses, and carried interest. Returns are annualized, with the exception of returns less than one year, which are cumulative. Because the US private equity and venture capital indexes are capitalization weighted, the largest vintage years mainly drive the indexes’ performance. Public index returns are shown as both time-weighted returns (average annual compound returns) and dollar-weighted returns (mPME). The CA Modified Public Market Equivalent replicates private investment performance under public market conditions. The public index’s shares are purchased and sold according to the private fund cash flow schedule, with distributions calculated in the same proportion as the private fund, and mPME net asset value is a function of mPME cash flows and public index returns.
Second Half and Calendar Year 2018 Highlights
- As detailed in Figure 1, the private equity index has outperformed the Russell 2000® Index (small companies) and the S&P 500 Index (large companies) in all time periods listed. The time horizon where the PE and public indexes most closely approximate each other is the ten years ending in 2018 (which began with the global financial crisis). That ten-year period is the only one in which the venture capital index trailed all three public benchmarks listed in the figure (Nasdaq, Russell 2000®, and the S&P 500).
- Public companies accounted for nearly 13% of the private equity index and almost 11% of the venture capital index. Non-US company exposures in the private equity and venture capital indexes have remained fairly steady, sitting at roughly 18% in the private equity benchmark and close to 10% in the venture capital benchmark as of December 31, 2018.
- In 2018, among the largest sectors, IT was the best performing in US private equity and venture capital. Communication services (a new GICS sector combining internet, consumer, and telecommunications companies) was the worst performing in both indexes.
US Private Equity Performance Insights
Despite a relatively healthy economy, public equities struggled in 2018 amid geopolitical uncertainty, aggressive trade policies, and market volatility, leading to the first negative year since 2008. Large sectors, including energy and IT in the S&P 500 and consumer discretionary, healthcare, and IT in the small-cap arena, all posted losses for the year. Public market volatility certainly had an impact on private equity performance in fourth quarter; however, it was muted, with the index falling less than 1%. The private equity benchmark has produced double-digit calendar year returns for ten straight years. Among the 13 vintage years (2005–17) that accounted for slightly more than 98% of the index’s value, nine earned positive returns in the second half of the year; all but two were up for the year (with the exceptions being vintage years 2005 and 2017).
According to Dealogic, 17 private equity–backed companies went public in the second half of the year with a combined value of $5.5 billion. The period’s largest initial public offering (IPO) was Cushman & Wakefield (real estate). By number, 44, and by value, $16.2 billion, 2018 was a less active year for PE-backed IPOs, reflecting the turbulent fourth quarter. Almost three quarters of the 44 IPOs took place in technology, finance, healthcare, and energy (the same four large sectors as last year); the largest IPO of the year was ADT Inc. (professional services). Second half 2018 merger & acquisition (M&A) transactions were slightly more plentiful than they were in the same period of 2017 (395 versus 384), with almost 22% (or 86 deals) having valuations disclosed to the public. Based on publicly available data, the average transaction size among those 86 deals was $1.1 billion, driven down by the lower than average deal size in the third quarter ($883 million compared with nearly $1.2 billion in the other three quarters). The number of M&A transactions in 2018 (871) was higher than in each of the previous five years; the average over that time period (2013–17) was 725 deals per year. Transactions with disclosed values averaged $1.1 billion in 2018, significantly larger than the average of $659 million over the previous five-year period.
Eight vintage years—2006–07 and 2011–16—qualified as meaningfully sized (5% or more of the index’s value) and together represented 84% of the private equity index’s value at the end of 2018 (Figure 2); returns for these eight vintages ranged from -6.3% to 8.7% in second half 2018.
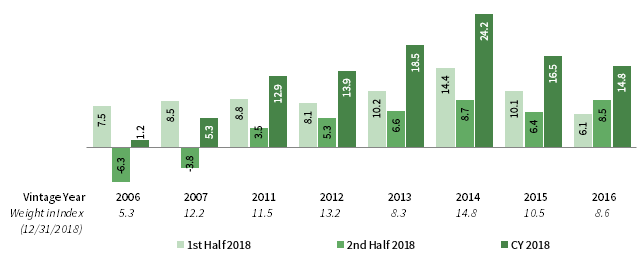
FIGURE 2 US PRIVATE EQUITY INDEX VINTAGE YEAR RETURNS: NET FUND–LEVEL PERFORMANCE
As of December 31, 2018 • USD Terms • Percent (%)
Source: Cambridge Associates LLC.
Notes: Vintage year fund-level returns are net of fees, expenses, and carried interest.
IT companies were a meaningful driver of returns for the best-and worst-performing vintages in the second half, 2014 and 2006, respectively, as write-ups in the period dominated valuation changes in the 2014 vintage and write-downs were the second largest in the 2006 vintage; the more significant driver of losses for the 2006 vintage was the consumer discretionary sector. For the full year, six of the eight large vintages produced double-digit returns. The year’s best and worst vintages mirrored the second half. The 24.2% annual return earned by the 2014 vintage was driven mostly by IT investments with widespread (though more muted) gains in other sectors. Vintage year 2006 funds eked out a positive annual return of 1.2% with losses in consumer sectors, communication services, and energy, largely offsetting gains in healthcare, industrials, IT, and materials.
Figure 3 shows the GICS sector breakdown of the CA private equity index and a public market counterpart, the Russell 2000® Index. The breakdown provides context when comparing the performance of the private and public indexes. The chart highlights the continued relative overweights in the private equity index, such as IT, communication services, and consumer discretionary, and the significant underweight in financials.
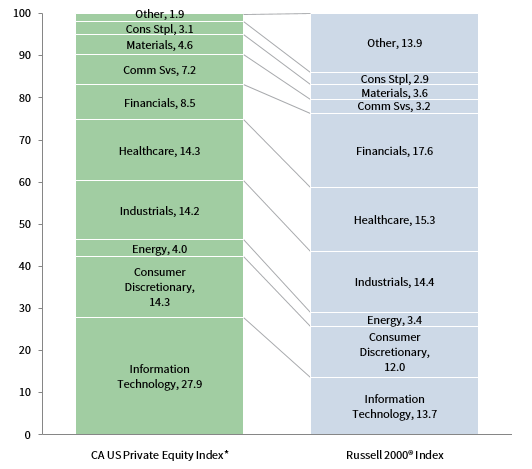
FIGURE 3 GICS SECTOR COMPARISONS: CA US PRIVATE EQUITY VS RUSSELL 2000®
As of December 31, 2018 • Percent (%)
* The private equity index includes buyout and growth equity funds.
Sources: Cambridge Associates LLC, Frank Russell Company, and FTSE International Limited.
Notes: The Global Industry Classification Standard (GICS®) was developed by and is the exclusive property and a service mark of MSCI Inc. and S&P Global Market Intelligence LLC and is licensed for use by Cambridge Associates LLC. As a result of the GICS sector definitions changes in 2018, the makeup of the private and public indexes changed and in some cases, impacted the relative over and underweights in the private index. The newest sector, communication services, largely includes companies formerly designated as telecommunications, consumer, and IT. “Other” includes sectors that make up less than 3% of the CA benchmark.
FOUR OF THE SIX KEY SECTORS IN THE PRIVATE EQUITY INDEX EARNED POSITIVE RETURNS FOR THE SECOND HALF AND AND ALL DID FOR THE YEAR. The six meaningfully sized sectors—IT, healthcare, consumer discretionary, industrials, financials, and communication services—composed more than 86% of the index’s total value and returned between -3.7% and 10.0% during the last six months of the year (Figure 4). On a dollar-weighted basis, they earned a gross return of 5.1%, outperforming the total benchmark’s six-month gross performance by about 1%. IT posted the highest return for the second half; five vintages (2007, 2011, 2013–14, and 2016) each had more than $1.1 billion in net appreciation in the sector (the 2014 and 2016 vintages each had north of $3.4 billion of net gains in the sector). In the communications services sector, losses were fairly widespread but most impactful in the 2007 vintage. During the six months, more than 75% of the capital deployed by fund managers was allocated to five sectors (from highest to lowest): IT, healthcare, industrials, communication services, and financials. This allocation is almost 10% higher than long-term trends, with IT accounting for the bulk of the overweight.
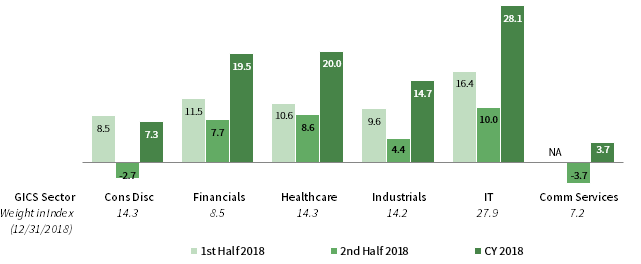
FIGURE 4 US PRIVATE EQUITY INDEX GICS SECTOR RETURNS: GROSS INVESTMENT–LEVEL PERFORMANCE
As of December 31, 2018 • USD Terms • Percent (%)
Source: Cambridge Associates LLC.
Notes: The Global Industry Classification Standard (GICS®) was developed by and is the exclusive property and a service mark of MSCI Inc. and S&P Global Market Intelligence LLC and is licensed for use by Cambridge Associates LLC. As a result of the GICS sector definitions changes in 2018, the makeup of the private and public indexes changed and in some cases, impacted the relative over and underweights in the private index. The newest sector, communication services, largely includes companies formerly designated as telecommunications, consumer, and IT. “Other” includes sectors that make up less than 3% of the CA benchmark.
With the exceptions of consumer discretionary and communication services, annual returns for the large sectors in the private equity universe were strong, led by IT. Write-ups for IT companies were widespread among vintages 2007–16, and for each vintage equaled more than $1 billion; the 2014 vintage’s approximately $10 billion of write-ups were the highest for the year and were also spread widely within the sector. For the lowest-performing sector in 2018, communication services vintages 2000–09 saw either flat or decreased valuations, while vintages 2010–17 saw increased valuations. The six large sectors earned a gross return of 17.7% for the year, outperforming the benchmark’s total gross return by 1.9%. At 4.0% of the index’s value, the energy sector is not considered meaningfully sized, however, its performance for the year (-4.1%) stood out as by far the worst among all sectors.
CONTRIBUTIONS RISE AND DISTRIBUTIONS FALL FROM 2017 LEVELS. During 2018, managers in the US private equity index called $95.1 billion from limited partners (LPs), making it the highest year for capital calls since 2007 (Figure 5). Distributions totaled $125.5 billion for the year, a $10 billion drop from 2017, but it was the sixth year in a row that distributions were above $100 billion. Distributions have outpaced contributions every year since 2011 but since the inception of the index in 1986, there were only three other years when this was the case—1996, 2004, and 2005. For a long-term perspective, of the $1.2 trillion called and $1.4 trillion distributed from March 1986 through December 2018, almost half of the calls and nearly two-thirds of the distributions occurred in the last eight years ($553 billion in LP contributions and $918 billion in LP distributions).

FIGURE 5 US PRIVATE EQUITY CONTRIBUTIONS, DISTRIBUTIONS, AND NET ASSET VALUE (NAV)
Calendar Years 2006–18 • USD Billions
Source: Cambridge Associates LLC.
Investors in funds launched in 2014–17 contributed $46.5 billion, or 86% of the total capital called during the last six months of 2018; all four vintage years called more than $8.9 billion from their LPs. Conversely, six vintage years (2006–08, 2011–12, and 2014) distributed more than $4.8 billion each in the period, led by the 2007 and 2014 groups that both distributed at least $10 billion; as a group, these vintages represented almost 73% of the total distributions.
US VENTURE CAPITAL PERFORMANCE INSIGHTS
The US venture capital index earned 7.1% in second half 2018, bringing its full year return to 18.1%. Consumer discretionary, healthcare, and IT, along with the added communication services, were the largest sectors of the index and the drivers of the benchmark’s return. During the year, all elements of the venture capital investment environment were healthy, including fundraising, investment pace, cash flows in and out of venture managers, and the exit market.
According to the National Venture Capital Association and PitchBook, exit activity for venture-backed companies experienced another uptick in 2018. The 87 IPOs in 2018 were valued at close to $64 billion, a 50% increase in count and nearly a 30% increase in value over 2017. Annual venture-backed M&A transactions continued to decrease, having peaked in 2015, and totaled 650 in 2018. Lastly, sales to financial buyers (PE buyouts) saw their highest recorded volume and valuation in 2018, at 193 deals valued at $5.2 billion, which represented a year-over-year increase of 15% and 30%, respectively.
The venture capital index’s second half and calendar year results were much stronger than those of public equities. For the year, returns among the nine meaningfully sized vintage years ranged from 6.9% (2008) to 30.9% (2016). Eight of the nine large vintage years posted returns above 15.0% (Figure 6); combined, they accounted for 73% of the index’s value.
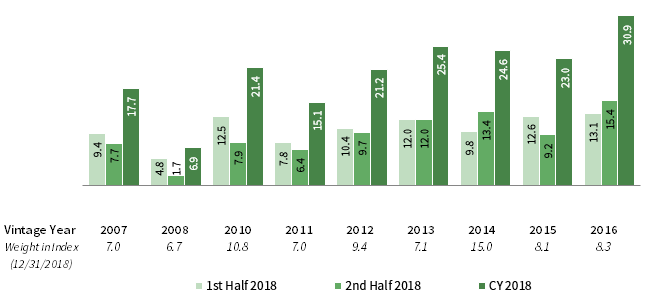
FIGURE 6 US VENTURE CAPITAL INDEX VINTAGE YEAR RETURNS: NET FUND–LEVEL PERFORMANCE
Source: Cambridge Associates LLC.
Notes: Vintage year fund-level returns are net of fees, expenses, and carried interest.
For the best-performing vintage, 2016, write-ups in healthcare and IT were by far the biggest drivers of annual performance, as valuations increased by more than $1 billion for both sectors. Valuation increases in the lowest performer, 2008, were almost solely driven by IT companies, with less meaningful upward moves in communication services and consumer discretionary.
Figure 7 shows the GICS sector breakdown of the venture capital index and a public market counterpart, the Nasdaq Composite Index. The breakdown provides context when comparing the performance of the two indexes. The chart highlights the venture index’s meaningful overweights in IT and healthcare, and its considerable underweights in communication services and consumer discretionary.
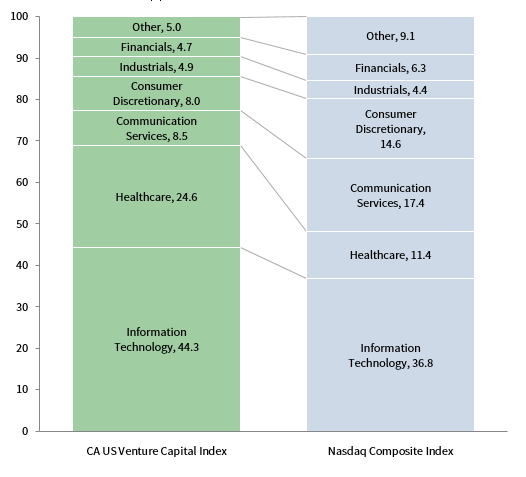
FIGURE 7 GICS SECTOR COMPARISONS: CA US VENTURE CAPITAL VS NASDAQ COMPOSITE
As of December 31, 2018 • Percent (%)
Sources: Cambridge Associates LLC, Nasdaq, and Factset Research Systems.
Notes: The Global Industry Classification Standard (GICS®) was developed by and is the exclusive property and a service mark of MSCI Inc. and S&P Global Market Intelligence LLC and is licensed for use by Cambridge Associates LLC. As a result of the GICS sector definitions changes in 2018, the makeup of the private and public indexes changed and in some cases, impacted the relative over and underweights in the private index. The newest sector, communication services, largely includes companies formerly designated as telecommunications, consumer, and IT. “Other” includes sectors that make up less than 3% of the CA benchmark.
IT POSTED THE HIGHEST ANNUAL RETURNS IN 2018. The venture capital benchmark continues to be concentrated in four sectors: IT, healthcare, communication services, and consumer discretionary (in rank order); combined, the large sectors accounted for more than 85% of the index’s value at the close of 2018 (Figure 8). Almost 88% of capital invested during second half of 2018 went into companies in these sectors, and two of the four, healthcare and IT, together accounted for 75% of invested capital. Among the key sectors, IT had the best performance for the second half and the full year, returning 15.0% and 31.9%, respectively.
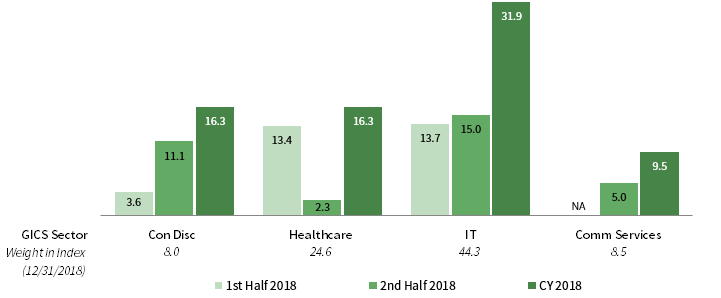
FIGURE 8 US VENTURE CAPITAL INDEX GICS SECTOR RETURNS: GROSS INVESTMENT–LEVEL PERFORMANCE
As of December 31, 2018 • USD Terms • Percent (%)
Source: Cambridge Associates LLC.
Notes: The Global Industry Classification Standard (GICS®) was developed by and is the exclusive property and a service mark of MSCI Inc. and S&P Global Market Intelligence LLC and is licensed for use by Cambridge Associates LLC. As a result of the GICS sector definitions changes in 2018, the makeup of the private and public indexes changed and in some cases, impacted the relative over and underweights in the private index. The newest sector, communication services, largely includes companies formerly designated as telecommunications, consumer, and IT. “Other” includes sectors that make up less than 3% of the CA benchmark.
For the year, IT performance was driven by write-ups in vintages 2005, 2007, and 2010–16, with an average of more than $2.0 billion for each vintage. Healthcare company valuations in four vintages (2010, 2013–14, and 2016) each had write-ups greater than $845 million, with 2013, 2014, and 2016 having valuation increases greater than $1 billion. Consumer discretionary performance was largely driven by the 2014 vintage year’s $760 million in write-ups, while the communication services return was driven by write-ups of $150 million or more in four vintage years, 2008, 2010, 2014, and 2016.
2018 VENTURE CAPITAL CALLS AND DISTRIBUTIONS INCREASED FROM PRIOR YEAR. Managers in the US venture capital index called and distributed more capital in 2018 than they did in 2017 (Figure 9). Contributions increased 20% to $21.6 billion and distributions increased nearly 35% to $29.0 billion, making 2018 the seventh straight year that more capital was distributed than called.
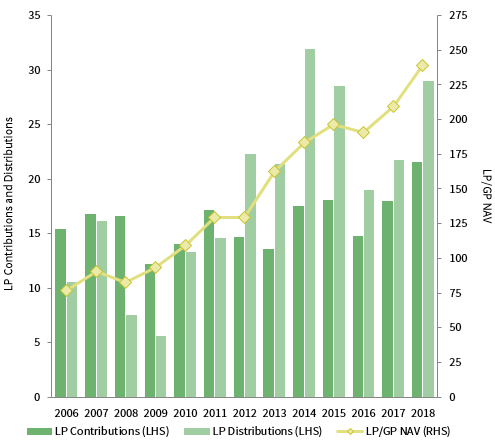
FIGURE 9 US VENTURE CAPITAL CONTRIBUTIONS, DISTRIBUTIONS, AND
NET ASSET VALUE (NAV)
Calendar Years 2006–18 • USD Billions
Source: Cambridge Associates LLC.
In second half 2018, managers in the venture capital index called $11.4 billion, a 12% increase from the previous six months. Distributions in second half 2018 were $13.9 billion, 7% lower than the first six months. With the exception of one quarter, venture capital funds have distributed more capital than they have called in every quarter throughout the past seven years as of year-end 2018—a cash flow trend that the venture industry hasn’t experienced since the 1990s.
Managers of funds raised from 2014 to 2018 called $10.5 billion, or 92% of all capital called during second half 2018. Each of the five vintages called more than $1 billion, with the 2016 and 2018 funds calling the most at $3.2 billion and $2.4 billion, respectively. Seven vintage years—2000, 2005–08, 2010, and 2012—returned more than $750 million to investors during the second half. Distributions from these vintages averaged just under $1.4 billion each, and the seven combined to distribute 69% of the total.
Caryn Slotsky, Senior Investment Director
Sarah Grifferty, Senior Investment Associate
Wyatt Yasinski, Investment Associate
About the Cambridge Associates LLC Indexes
Cambridge Associates derives its US private equity benchmark from the financial information contained in its proprietary database of private equity funds. As of December 31, 2018, the database included 1,128 US buyouts and growth equity funds formed from 1986 to 2018, with a value of $624 billion. Ten years ago, as of December 31, 2008, the index included 718 funds whose value was $274.8 billion.
Cambridge Associates derives its US venture capital benchmark from the financial information contained in its proprietary database of venture capital funds. As of December 31, 2018, the database included 1,858 US venture capital funds formed from 1981 to 2018, with a value of $239.1 billion. Ten years ago, as of December 31, 2008, the index included 1,294 funds whose value was $82.7 billion.
The pooled returns represent the net end-to-end rates of return calculated on the aggregate of all cash flows and market values as reported to Cambridge Associates by the funds’ general partners in their quarterly and annual audited financial reports. These returns are net of management fees, expenses, and performance fees that take the form of a carried interest.
About the Public Indexes
The Nasdaq Composite Index is a broad-based index that measures all securities (over 3,000) listed on the Nasdaq Stock Market. The Nasdaq Composite is calculated under a market capitalization–weighted methodology.
The Russell 2000® Index includes the smallest 2,000 companies of the Russell 3000® Index (which is composed of the largest 3,000 companies by market capitalization).
The Standard & Poor’s 500 Composite Stock Price Index is a capitalization-weighted index of 500 stocks intended to be a representative sample of leading companies in leading industries within the US economy. Stocks in the index are chosen for market size, liquidity, and industry group representation.
Footnotes