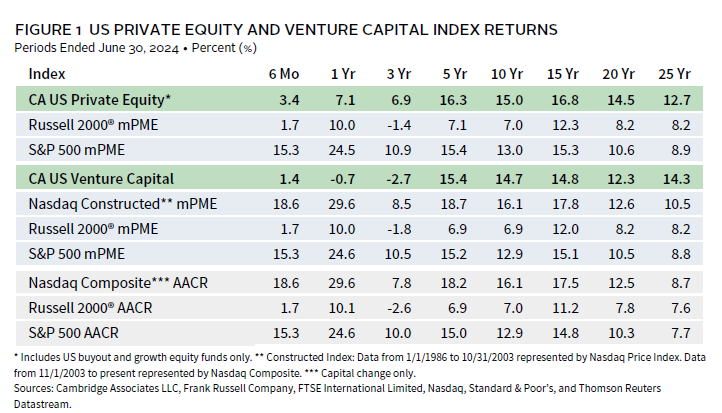
In the first half of 2024, returns from US private equity and venture capital (PE/VC) were modest; the Cambridge Associates LLC US Private Equity Index® earned 3.4% and the Cambridge Associates LLC US Venture Capital Index® earned 1.4%. Within PE, buyouts and growth equity posted similar results (3.3% and 3.6%, respectively), but PE/VC returns generally trailed those of the public market. Figure 1 depicts short- and long-term performance for the private asset classes compared to the public markets.
First Half 2024 Highlights
- Both private asset classes have struggled to keep up with the public indexes over the past three years as large-cap information technology (IT) companies have dominated the market. Over longer time periods, PE/VC indexes have performed well vis-à-vis public peers.
- By market value, public companies accounted for similar percentages of the VC and PE indexes (about 7% and 6%, respectively), as of June 30, 2024. Non-US companies represented a bit more than 20% of PE and a little less than 15% of VC.
US Private Equity Performance Insights
Vintage Years
As of June 2024, eight vintage years (2015–22) were meaningfully sized—representing at least 5% of the benchmark’s value—and, combined, accounted for 86% of the index’s value. Six-month returns among the key vintages ranged from 1.3% for vintage year 2016 to 7.5% for vintage year 2022 (Figure 2).
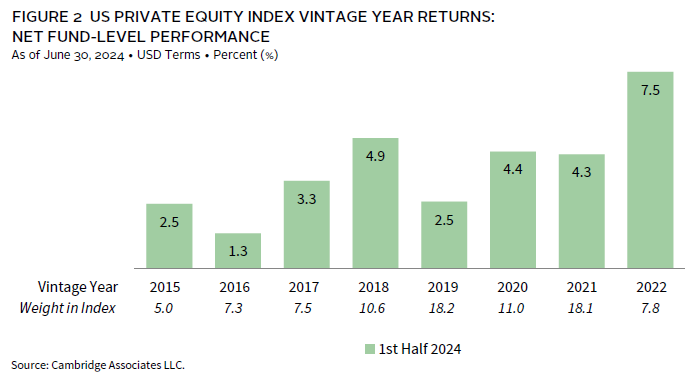
Investments in industrials were far and away the largest contributor to the strong performance for the 2022 vintage, while returns across the largest sectors for the 2016 funds were muted—slightly positive for IT and slightly negative for industrials.
During the first two quarters of 2024, fund managers distributed and called roughly equal amounts of capital, $67.4 billion and $66.6 billion, respectively. If this cash flow pattern holds for all of 2024, the year would be markedly different than 2022 and 2023, a two-year stretch when managers called nearly $64 billion more than they distributed.
Four vintage years (2021–24) in the prime of their investment periods represented 83% ($55 billion) of the capital calls, with the three more mature vintages (2021–23) drawing down at least $14.8 billion in first half 2024. Five vintage years (2015–19) distributed 65% ($44 billion) of all capital returned to limited partners (LPs), led by the 2017 vintage’s nearly $12 billion total. There were seven other vintages that distributed at least $1 billion, going back as far as the 2009 cohort.
Sectors
Figure 3 shows the Global Industry Classification Standard (GICS®) sector comparison by market value of the PE index and a public market counterpart, the Russell 2000® Index. The breakdown provides context when comparing the performance of the two indexes. The PE index has a significant overweight to IT and communication services as well as a meaningful underweight in “real assets,” including energy, real estate, and utilities (reflected in the “Other” category), while the public market has long been overweighted to financials.
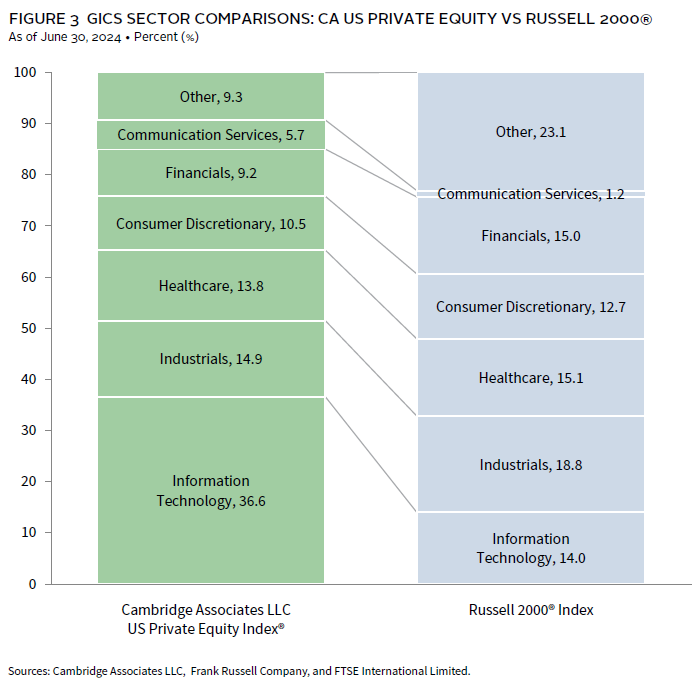
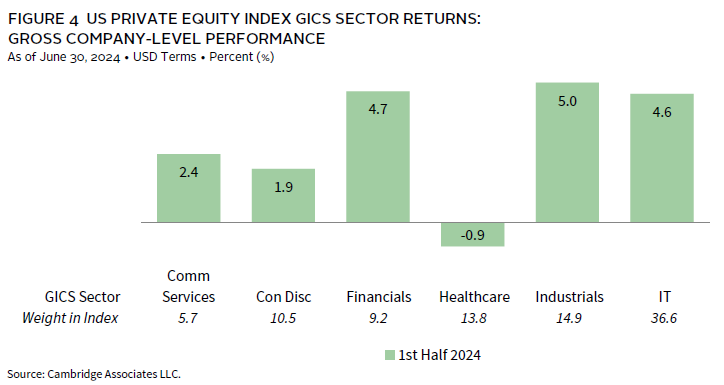
As of June 2024, at roughly 37% of the index’s value, IT remained the largest among the six meaningfully sized sectors. Combined, the next three sectors by size—industrials, healthcare, and consumer discretionary—accounted for another 39% of the index’s value. Among the key sectors, first half returns ranged from -0.9% for healthcare to 5.0% for industrials. Financials and IT posted similar results, 4.7% and 4.6%, respectively (Figure 4). Values for healthcare investments were written down in all but one vintage from 2011–17 and written up in all but one vintage from 2018–23, leading to its modestly negative return. Industrials company valuations, on the other hand, rose in all but three vintages from 2011–23.
Four sectors garnered 80% of the capital invested by US PE managers in the first half of 2024: IT (29%), industrials (24%), healthcare (17%), and financials (11%). Over the long term, managers have allocated 63% of their capital to those sectors. The biggest drivers of the difference were the percentage of capital allocated to IT (historically 24%) and to industrials (historically 16%).
US Venture Capital Performance Insights
Vintage Years
As of June 2024, nine vintage years (2014–22) were meaningfully sized and combined, accounting for 81% of the index’s value. Performance for the key vintages during the first half of the year was mixed, ranging from -1.4% (2015 and 2016) to 9.1% (2022) (Figure 5). While the VC index was up slightly for the full six months, it was down in the second quarter, marking the eighth negative quarter since the beginning of 2022.

For the youngest and best-performing large-sized vintage (2022), write-ups were widespread but most impactful in the vintage’s two largest sectors: IT and healthcare. In the two lowest-performing vintages, 2015 and 2016, write-downs were most pronounced in IT, but the 2015 group also suffered losses in communication services. Write-ups in healthcare in both vintages—and financials for 2016 funds—helped to offset some of the write-downs.
In first half 2024, VC managers called $20.4 billion from and returned $11.4 billion to LPs, which represented a slight uptick in cash flow activity over the prior year. US VC managers have called more capital than they have distributed in nine of the ten previous quarters (covering the time period of January 2022 to June 2024), at a ratio of calls to distributions of 1.4x.
Three vintages (2021–23) accounted for nearly 80% (almost $16 billion) of the total capital called during the first six months. While each called more than $4 billion, the 2022 group called the most, $7 billion. Distributions were much less concentrated than contributions, with every vintage from 2011 to 2022 accounting for at least 5% of the distributions during the six-month period. Three vintage years, 2015 and 2017–18 distributed more than $1 billion each, representing about one-third of all capital returned to LPs.
Sectors
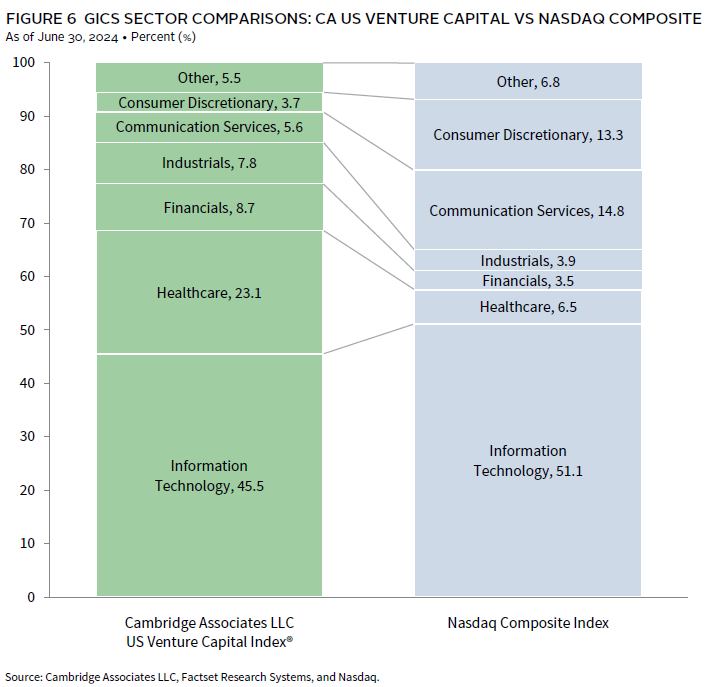
Figure 6 shows the GICS® sector breakdown of the VC index by market value and a public market counterpart, the Nasdaq Composite Index. The breakdown provides context when comparing the performance of the two indexes. The chart highlights the VC index’s substantial relative overweight in healthcare and notable higher exposures to financials and industrials. The VC index’s exposure to IT was historically higher than that of the Nasdaq, but starting in 2023, that dynamic shifted in conjunction with tech’s strong performance in the public markets coupled with modest returns in the sector in VC. Exposures to communication services and consumer discretionary companies are also much higher in the Nasdaq than in the VC index.
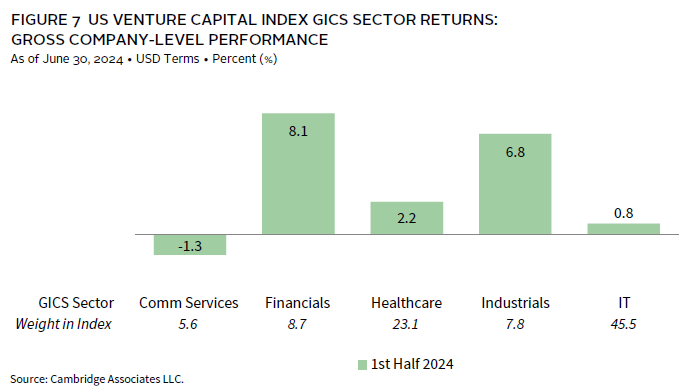
As a group, the five meaningfully sized sectors made up 91% of the VC index (Figure 7), and returns ranged from -1.3% for communication services to 8.1% for financials. Performance for the IT sector was essentially flat, and industrials posted strong results. With one exception, returns for communication services businesses were negative across vintages 2011–20 and positive for funds raised in 2021–23. In contrast, only two vintages from 2011–23 suffered losses in financials sector investments.
During the first six months, venture capital managers in the index allocated about 90% of their invested capital to IT (43%), healthcare (31%), industrials (10%), and financials (7%) investments. Over the long term, those sectors have garnered 81% of capital, with the difference driven by the larger-than-normal allocations to industrials and financials in 2024.
Caryn Slotsky, Managing Director
Drew Carneal, Associate Investment Director
Wyatt Yasinski, Associate Investment Director
Figure Notes
US Private Equity and Venture Capital Index Returns
Private indexes are pooled horizon internal rates of return, net of fees, expenses, and carried interest. Returns are annualized, with the exception of returns less than one year, which are cumulative. Because the US private equity and venture capital indexes are capitalization weighted, the largest vintage years mainly drive the indexes’ performance.
Public index returns are shown as both time-weighted returns (average annual compound returns) and dollar-weighted returns (mPME). The CA Modified Public Market Equivalent replicates private investment performance under public market conditions. The public index’s shares are purchased and sold according to the private fund cash flow schedule, with distributions calculated in the same proportion as the private fund, and mPME net asset value is a function of mPME cash flows and public index returns.
Vintage Year Returns
Vintage year fund-level returns are net of fees, expenses, and carried interest.
Sector Returns
Industry-specific gross company-level returns are before fees, expenses, and carried interest.
GICS® Sector Comparisons
The Global Industry Classification Standard (GICS®) was developed by and is the exclusive property and a service mark of MSCI Inc. and S&P Global Market Intelligence LLC and is licensed for use by Cambridge Associates LLC.
About the Cambridge Associates LLC Indexes
Cambridge Associates derives its US private equity benchmark from the financial information contained in its proprietary database of private equity funds. As of June 30, 2024, the database included 1,607 US buyout and growth equity funds formed from 1983 to 2024, with a value of $1.4 trillion. Ten years ago, as of June 30, 2014, the index included 937 funds whose value was $478 billion.
Cambridge Associates derives its US venture capital benchmark from the financial information contained in its proprietary database of venture capital funds. As of June 30, 2024, the database comprised 2,537 US venture capital funds formed from 1981 to 2024, with a value of $417 billion. Ten years ago, as of June 30, 2014, the index included 1,500 funds whose value was $138 billion.
The pooled returns represent the net end-to-end rates of return calculated on the aggregate of all cash flows and market values as reported to Cambridge Associates by the funds’ general partners in their quarterly and annual audited financial reports. These returns are net of management fees, expenses, and performance fees that take the form of a carried interest.
About the Public Indexes
The Nasdaq Composite Index is a broad-based index that measures all securities (more than 3,000) listed on the Nasdaq Stock Market. The Nasdaq Composite is calculated under a market capitalization–weighted methodology. The Russell 2000® Index includes the smallest 2,000 companies of the Russell 3000® Index (which is composed of the largest 3,000 companies by market capitalization). The Standard & Poor’s 500 Composite Stock Price Index is a capitalization-weighted index of 500 stocks intended to be a representative sample of leading companies in leading industries within the US economy. Stocks in the index are chosen for market size, liquidity, and industry group representation.