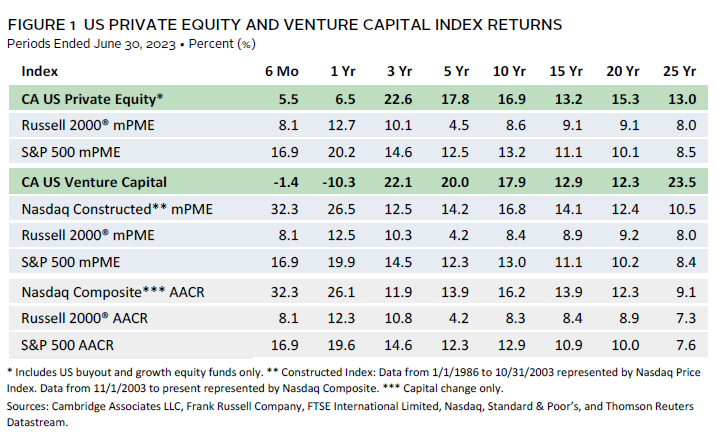
In the first half of 2023, despite macro headwinds, US private equity (PE) remained resilient, while venture capital (VC) continued to “correct.” For the six months ended June 30, 2023, the Cambridge Associates LLC US Private Equity Index® returned 5.5% (2.7% and 2.8% in first quarter and second quarter, respectively) and the Cambridge Associates LLC US Venture Capital Index® returned -1.4% (-1.0% and -0.5% in first quarter and second quarter, respectively). IT was the largest sector in both asset classes; in private equity, tech companies performed well (like in public markets), whereas the IT sector was down modestly in the VC index. Figure 1 depicts performance for the private asset classes compared to the public markets.
First Half 2023 Highlights
- Both private asset classes posted lower short-term returns (six months and one year) than the public markets as of June 30, 2023, but over longer periods, the reverse is true. The US PE index outperformed the relevant public indexes by at least 200 basis points in every period longer than three years. The US VC benchmark had similar success against the public indexes over longer time horizons, other than against the Nasdaq Composite in the 15- and 20-year periods ending in June.
- By market value, public companies continued to account for a slightly larger percentage of the VC index than of the PE index (about 9% and 7%, respectively). With respect to non-US companies, the reverse has been true and in 2023, those companies represented about 20% of private equity and 13% of venture capital.
US Private Equity Performance Insights
Vintage Years
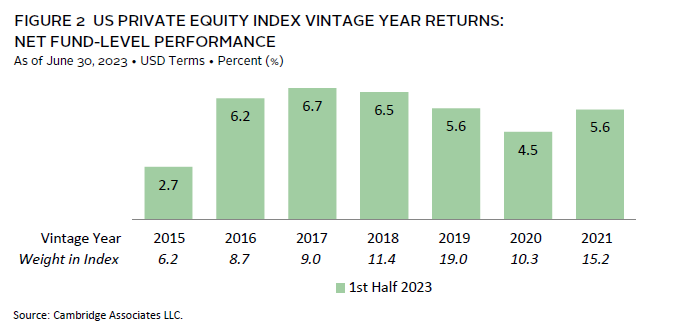
As of June 2023, seven vintage years (2015–21) were meaningfully sized—representing at least 5% of the benchmark’s value—and, combined, accounted for 80% of the index’s value. Six-month returns among the key vintages ranged from 2.7% for vintage year 2015 to 6.7% for vintage year 2017 (Figure 2). Another 13% of the index’s value resided in three vintages, 2013–14 and 2022.
Write-ups in IT, industrials, and healthcare led to strong returns, propelling the top-performing vintage (2017), while more modest valuation increases in those sectors coupled with losses in communication services and financials drove the performance for the lowest-returning vintage (2015). Two other vintages (2012 and 2014), which together represented almost 7% of the index, posted returns of 8.1% for the period (with double-digit returns in both healthcare and IT).
Limited partner (LP) cash flow amounts in the first half of 2023 were the lowest for any half-year period since the first half of 2020. During the first two quarters of the year, fund managers distributed $49.6 billion and called $73.5 billion, and activity in the second quarter was lower than in the first. Since the beginning of 2022, capital calls outpaced distributions in every quarter, with a call to distribution ratio of 1.4x during the 18-month stretch. This trend could raise liquidity questions for many mature private investment programs that rely on distributions to fund capital calls.
Three vintage years (2019, 2021–22) represented 77% ($57 billion) of the capital calls, with each drawing down at least $10 billion in first half 2023; the 2021 vintage called almost $30 billion. There were far more vintages contributing to the distribution total, with 11 (going all the way back to 2008) returning at least $1 billion to LPs. Four vintage years (2015–17, 2019) combined to distribute $29 billion (60% of the total) as they each returned more than $6.6 billion.
Sectors
Figure 3 shows the Global Industry Classification Standard (GICS®) sector breakdown by market value of the US PE index and a public market counterpart, the Russell 2000® Index. The comparison provides context when comparing the performance of the two indexes. The PE index has a significant overweight to IT and communication services and a meaningful underweight to energy and real estate (reflected in the “other” category). The public market’s longstanding overweight to financials was less significant as of June 2023 (only a 5% difference between the indexes).
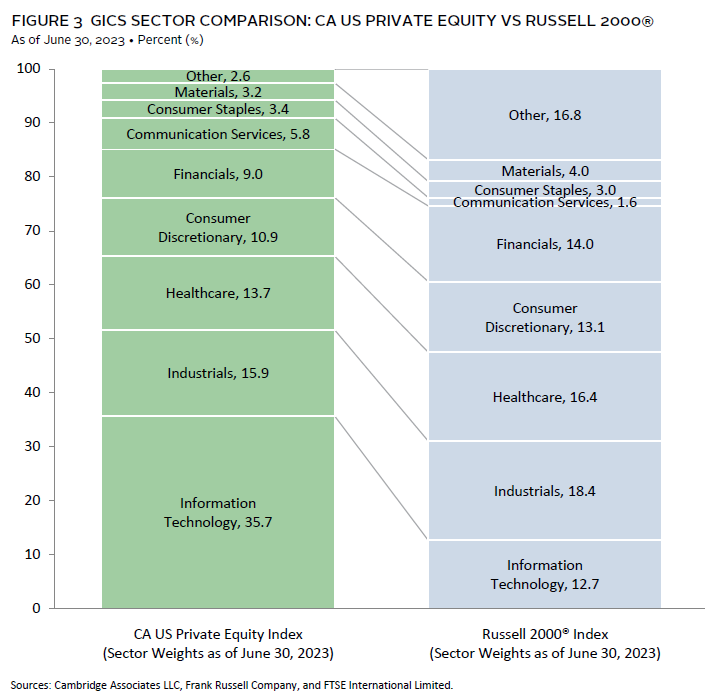
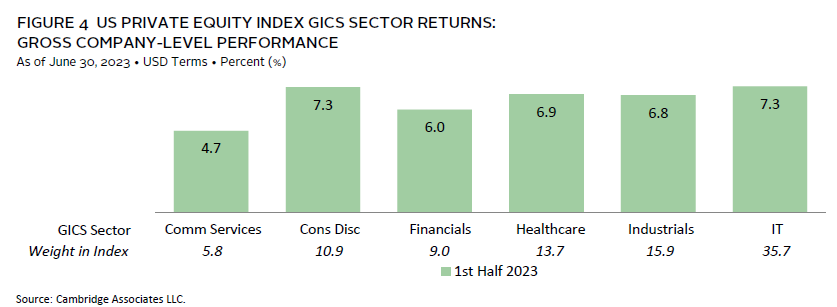
As of June 2023, among the six meaningfully sized sectors, IT has continued to dwarf the others by size, representing about 36% of the index’s value and more than double the weight of the next largest sector, industrials. The key sectors posted first half returns ranging from 4.7% for communication services to 7.3% for both IT and consumer discretionary (Figure 4). IT investments were written up in all but one of the vintages from 2008 to 2021 and the biggest contributors to the sector’s overall return were 2018–19 and 2021. Vintage years 2015, 2018, and 2020 were the key drivers of the consumer discretionary results with all three earning double-digit returns in the sector.
Four sectors garnered more than 80% of the capital invested by US PE managers in the first half of 2023—industrials (32%), IT (23%), healthcare (17%) and financials (11%). Over the long term, managers have allocated a bit more than 60% of their capital to those sectors. The percentage of capital allocated to industrials—which historically was about 16% of invested capital—drove the difference.
US Venture Capital Performance Insights
Vintage Years
As of June 2023, eight vintage years (2014–21) were meaningfully sized and combined, accounted for 76% of the index’s value. Performance for the key vintages was generally weak, ranging from -3.5% (2014) to -0.3% (2017) during the first half of the year (Figure 5). While down much more modestly, the VC index’s six-quarter streak of negative returns is its first since the 2000–03 period when there were ten consecutive negative quarters.
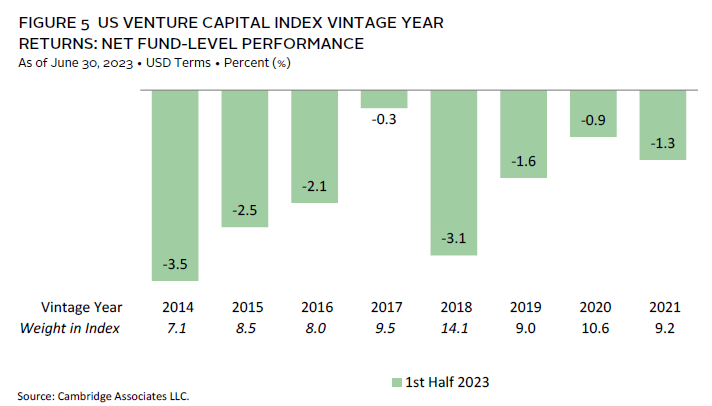
For the best-performing vintage (2017), write-downs in communication services, financials, and IT were largely offset by write-ups in healthcare. In the lowest-performing vintage, 2014, write-downs were most pronounced in IT, consumer discretionary, and healthcare (in rank order).
In first half 2023, VC managers called $13.6 billion from and returned $8.9 billion to LPs, dipping to a total cash flow level unseen since the second half of 2017. While public markets rebounded on the strength of a small number of companies, venture valuations continued to reset and the initial public offering window remained closed, slowing both investing and exiting. Like in the US PE index, capital calls have outpaced distributions since the first half of 2022 at a ratio of 1.2x (calls/distributions).
Three vintages (2020–22) accounted for 81% ($11 billion) of the total capital called during the first six months. While each called more than $2.6 billion, the 2022 group called the most ($5 billion). Distributions were less concentrated than contributions; the six vintages (2012–18) that returned at least $500 million to LPs represented 72% of all distributions. Three of the six vintages (2012, 2014, 2016) distributed more than $1 billion.
Sectors
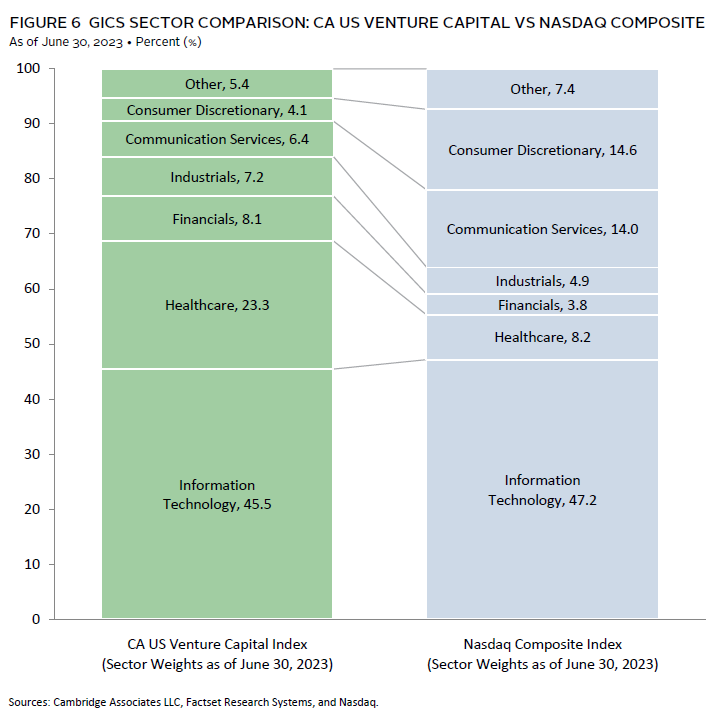
Figure 6 shows the GICS® sector breakdown of the VC index by market value and a public market counterpart, the Nasdaq Composite Index. The breakdown provides context when comparing the performance of the two indexes. The chart highlights the VC index’s significant relative overweight in healthcare and less pronounced higher exposures to financials and industrials. The VC index’s exposure to IT has historically been higher than that of the Nasdaq, but in 2023, a tech-driven rebound in the public markets combined with negative returns in the sector in venture capital helped lead to a slight IT overweight in the Nasdaq. The public index’s weightings in communication services and consumer discretionary are meaningfully higher than those of the VC index.
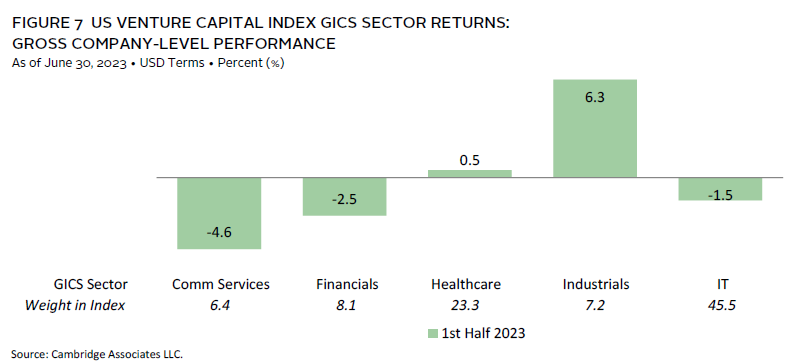
Collectively, the five meaningfully sized sectors made up 90% of the VC index (Figure 7). Performance among the six ranged from -4.6% for communication services to 6.3% for industrials. At only 7% of the index’s value, the industrials sector’s strong performance did not offset the flat or negative returns in larger sectors, particularly healthcare and IT. The largest contributors to the industrials sector’s return were vintages 2007 and 2010–11. Driving the IT sector’s results were the negative returns posted by six of the eight key vintage years.
During the first six months, VC managers in the index allocated about 84% of their invested capital to IT (36%), healthcare (33%), and financials (15%) investments. Over the long term, those sectors have garnered 76% of capital, with the difference driven by the larger than normal allocation to financials in 2023.
Caryn Slotsky, Senior Investment Director
Wyatt Yasinski, Associate Investment Director
Drew Carneal, Senior Investment Associate
Figure Notes
US Private Equity and Venture Capital Index Returns
Private indexes are pooled horizon internal rates of return, net of fees, expenses, and carried interest. Returns are annualized, with the exception of returns less than one year, which are cumulative. Because the US PE and VC indexes are capitalization weighted, the largest vintage years mainly drive the indexes’ performance.
Public index returns are shown as both time-weighted returns (average annual compound returns) and dollar-weighted returns. The CA Modified Public Market Equivalent (mPME) replicates private investment performance under public market conditions. The public index’s shares are purchased and sold according to the private fund cash flow schedule, with distributions calculated in the same proportion as the private fund, and mPME net asset value is a function of mPME cash flows and public index returns.
Vintage Year Returns
Vintage year fund-level returns are net of fees, expenses, and carried interest.
Sector Returns
Industry-specific gross company-level returns are before fees, expenses, and carried interest.
GICS® Sector Comparisons
The Global Industry Classification Standard (GICS®) was developed by and is the exclusive property and a service mark of MSCI Inc. and S&P Global Market Intelligence LLC and is licensed for use by Cambridge Associates LLC.
About the Cambridge Associates LLC Indexes
Cambridge Associates derives its US PE benchmark from the financial information contained in its proprietary database of PE funds. As of June 30, 2023, the database included 1,529 US buyout and growth equity funds formed from 1986 to 2023, with a value of $1.4 trillion. Ten years ago, as of June 30, 2013, the index included 868 funds whose value was $490 billion.
Cambridge Associates derives its US VC benchmark from the financial information contained in its proprietary database of VC funds. As of June 30, 2023, the database comprised 2,404 US VC funds formed from 1981 to 2023, with a value of $468 billion. Ten years ago, as of June 30, 2013, the index included 1,434 funds whose value was $131 billion.
The pooled returns represent the net end-to-end rates of return calculated on the aggregate of all cash flows and market values as reported to Cambridge Associates by the funds’ general partners in their quarterly and annual audited financial reports. These returns are net of management fees, expenses, and performance fees that take the form of a carried interest.
About the Public Indexes
The Nasdaq Composite Index is a broad-based index that measures all securities (more than 3,000) listed on the Nasdaq Stock Market. The Nasdaq Composite is calculated under a market capitalization–weighted methodology.
The Russell 2000® Index includes the smallest 2,000 companies of the Russell 3000® Index (which is composed of the largest 3,000 companies by market capitalization).
The Standard & Poor’s 500 Composite Stock Price Index is a capitalization-weighted index of 500 stocks intended to be a representative sample of leading companies in leading industries within the US economy. Stocks in the index are chosen for market size, liquidity, and industry group representation.