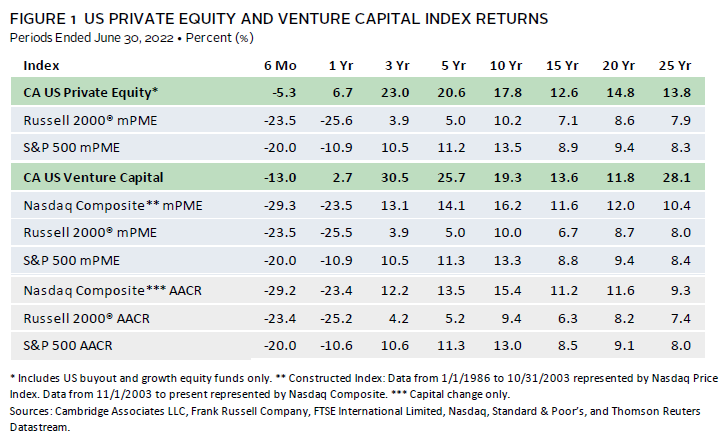
In first half 2022, US private equity and venture capital broke their trend of sustained positive performance as the downturn in the public markets spilled over to privates. For the six months ended June 30, 2022, the Cambridge Associates LLC US Private Equity Index® returned -5.3% (-0.4% and -5.0% in first and second quarters, respectively) and the Cambridge Associates LLC US Venture Capital Index® returned -13.0% (-4.5% and -9.8% in the first and second quarters, respectively). In both asset classes, as in the public markets, given its large size and negative performance, the IT sector was a major drag on performance and industrials helped to offset losses in other sectors. Figure 1 depicts performance for the private asset classes compared to the public markets.
First Half 2022 Highlights
- As of June 30, 2022, the US private equity benchmark had handily outperformed the public indexes in all time periods, with recent outperformance exacerbated by volatility in the public markets. Despite its double-digit negative first half performance, the US venture capital index has outperformed the public indexes in all time periods but one, the 20-year horizon against the Nasdaq Composite.
- Within the indexes, public companies accounted for a larger portion of venture capital than of private equity (about 9% and less than 7%, respectively). Because of the public market sell-off that started in the spring, these figures are down significantly from where they were at the end of 2021. Non-US companies have typically represented a larger portion of the private equity index than of the venture capital one, and, while these exposures have remained stable over time, there was a recent small uptick in both indexes (reaching almost 20% in private equity and 13% in venture capital).
US Private Equity Performance Insights
Vintage Years
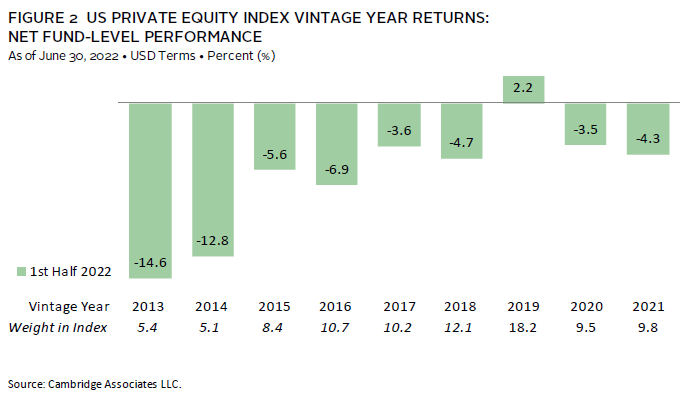
As of June 30, 2022, nine vintage years (2013–21) were meaningfully sized—representing at least 5% of the benchmark’s value—and, combined, accounted for 89% of the index’s value. Six-month returns among the key vintages were negative for all but one, ranging from -14.6% for vintage year 2013 to 2.2% for vintage year 2019 (Figure 2). Despite being raised just last year, the 2021 vintage already represented 9.8% of the index, evidence of the recent active environment.
Valuations were up in most sectors for the top-performing vintage (2019), with IT and industrials companies leading the way; healthcare and materials also contributed to a lesser extent. In contrast, in the lowest-returning vintage (2013), IT companies saw the most write-downs by far, though communication services, healthcare, and consumer discretionary sectors also saw meaningful valuation decreases during the period. IT write-downs were widespread and the biggest drag on performance for most of the meaningfully sized vintages.
Limited partner (LP) cash flows dropped precipitously from the second half of 2021, but given the growth in the asset class, contribution and distribution activity remained near all-time highs. During the first two quarters of the year, fund managers distributed $78.1 billion and called $85.2 billion, which rank among the highest levels for any half-year period. The “best” six-month period for both contributions and distributions was the one ended in December 2021. Notably, capital calls during first half 2022 outpaced distributions for only the second time in the past ten years, possibly signaling the end of an extended period of LPs receiving more money than they were paying in. This could raise liquidity questions for many mature private investment programs that rely on the “self-funding” nature of the asset class to make commitments.
Four vintage years (2019–22) represented 88% ($74.9 billion) of the capital calls, with each drawing down at least $9 billion in first half 2022—more evidence of the rapid investment pace, even in the slower market environment of 2022. Distributions were less concentrated, with seven vintage years (2012–13, 2015–19) each returning $5.8 billion or more, for a total of $60.9 billion (or 78% of the total). The 2015–17 vintages alone distributed more than $34 billion, and even the relatively young 2019 vintage distributed nearly $6.2 billion.
Sectors
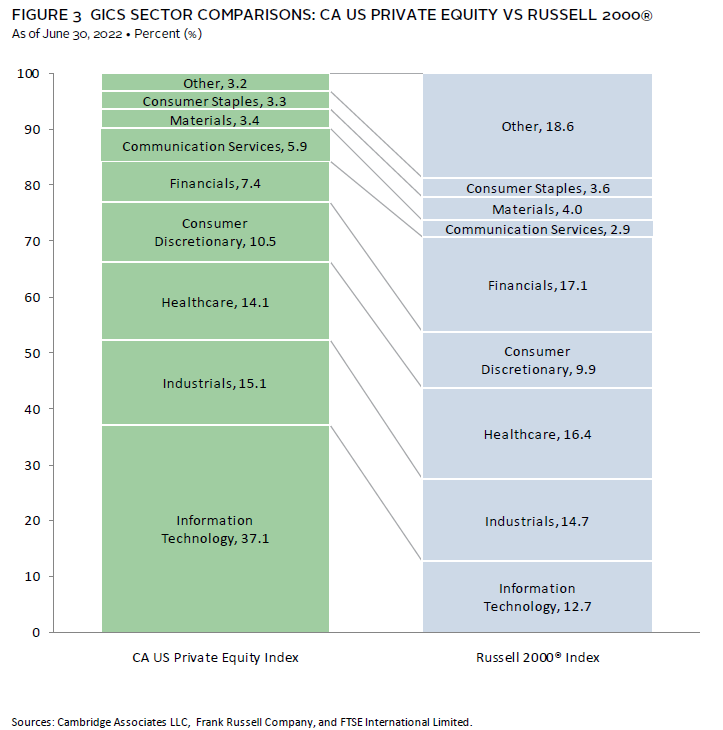
Figure 3 shows the Global Industry Classification Standard (GICS®) sector breakdown by market value of the private equity index and a public market counterpart, the Russell 2000® Index. The comparison provides context when comparing the performance of the two indexes. The largest differences are in IT, where the private equity index’s exposure is nearly 3.0 times that of the Russell 2000® Index, and in financials, where the private equity index’s weight is less than half of the public index’s weight. The chart also highlights less meaningful differences by weight in sectors like communication services and real estate, the latter of which is reflected in the “other” sector bucket.
As of June 30, 2022, among the six meaningfully sized sectors, IT remained the largest by a wide margin, representing about 37% of the index’s value and more than double the weight of the next largest sector, industrials. Like the meaningfully sized vintage years, all key sectors but one posted negative returns in the first half; these ranged from -9.1% for consumer discretionary to 6.7% for industrials (Figure 4). Except for vintage 2012, write-ups for industrials companies were mostly concentrated in recent vintages (2017, 2019, and 2021); combined, the four vintages posted an 11.2% return in the sector during the period, meaningfully higher than the return of the overall sector. In consumer discretionary, there were widespread write-downs, though the 2011–12 vintages (returning -23.7% and -22.7%, respectively) were both meaningful drivers of negative performance.

The lion’s share of investment activity in first half 2022 was in five sectors. IT (33%), healthcare (16%), industrials (13%), consumer discretionary (11%), and communication services (10%) attracted about 83% of the capital invested, which is about six percentage points higher than the investments in these sectors over the long term. Driving the difference is the percentage of capital allocated to IT, which historically was about 25% of invested capital.
US Venture Capital Performance Insights
Vintage Years
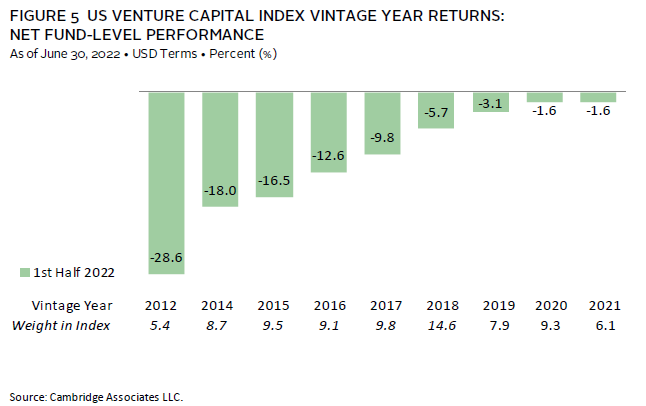
As of June 30, 2022, nine vintage years (2012, 2014–21) were meaningfully sized and, combined, accounted for 80% of the index’s value. In stark contrast to first half 2021, when only three vintages posted results below 30%, returns among the key vintages were all negative. The impact of the market downturn was disproportionately felt in the “older” vintages in the cohort; 2012 (the “oldest” vintage), earned the lowest return (-28.6%), while 2020 and 2021 vintages returned -1.6% each (Figure 5). With negative returns in both first and second quarter 2022, the US venture capital index broke its seven-quarter positive return streak (six of the seven were double-digit returns).
For the best-performing vintage (2021), meager write-ups in healthcare, industrials, and IT companies helped to offset small write-downs in consumer discretionary and financials companies. In the second-best and lowest-performing vintages, 2020 and 2014, respectively, IT companies had opposite impacts; investments in the sector provided ballast for the 2020 vintage and were the largest drag on performance in the 2014 vintage.
In venture capital, as with private equity, LP cash flows were down from the prior six-month period but remained near historic levels. In the first half of the year, managers called $19.9 billion and distributed $19.2 billion; despite representing a more than 50% drop from the six-month period ended June 30, 2021, that distribution amount was the sixth highest for any prior half-year period and the calls were third, behind the two prior six-month periods. Despite an increasingly volatile market environment and a virtually non-existent initial public offering (IPO) market, cash flow activity remained high (in part reflective of the increased size of the market). Like in the US private equity index, capital calls outpaced distributions during first half 2021; this was the first time this has happened since the end of 2011, though the difference between the two was much smaller than in the US private equity index.
Funds formed from 2020–22 were responsible for 80% ($16 billion) of the total capital called during the first six months. While each called more than $3.7 billion, the 2021 vintage led the way with capital calls of nearly $8.2 billion, illustrating both the active investment environment during this period and the size of the 2021 vintage (the largest fundraising year in the benchmark). Distributions were less concentrated than contributions, though four vintages, including the 16-year-“old” 2006 vintage and the four-year-old 2018 group, accounted for nearly 60% of the total distributions. These four were 2006, 2014–15, and 2018, and each distributed more than $1.9 billion. Six vintages distributed at least $1.0 billion each and represented 71% of the total distributions for the period.
Sectors
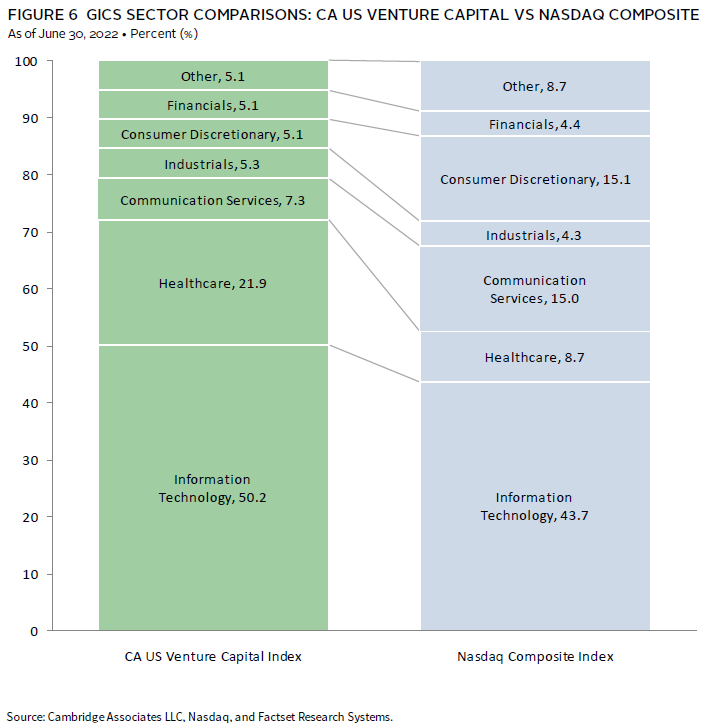
Figure 6 shows the GICS® sector breakdown of the venture capital index by market value and a public market counterpart, the Nasdaq Composite Index. The breakdown provides context when comparing the performance of the two indexes. The chart highlights the venture index’s significant relative overweight in healthcare and IT, and substantial underweights in consumer discretionary and communication services.
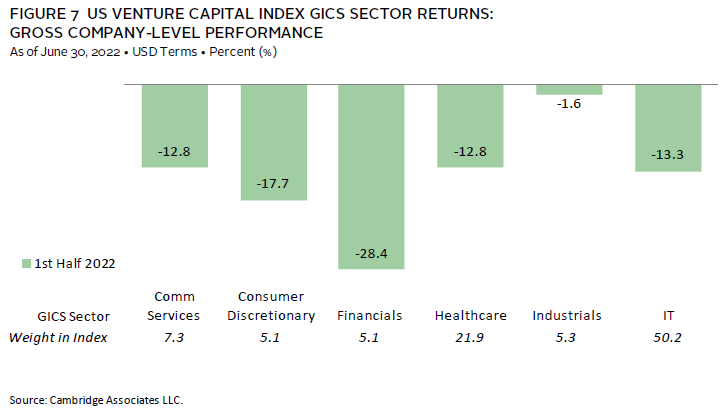
Collectively, the six meaningfully sized sectors made up 95% of the index (Figure 7). Performance among the six ranged from -28.4% for financials to -1.6% for industrials. All sectors other than industrials experienced double-digit negative returns for the period, with the next best-performing sectors, communication services and healthcare, returning -12.8% each. IT, the largest sector in the index by far, returned -13.3%, brought down by the tech sell-off in the public markets. The industrials return was driven mostly by positive performance in three vintages—2013, 2017, and 2020—which helped to offset negative returns in the 2011, 2014–15, and 2019 vintages. Financials sector performance (impacted by crypto companies) was negative across vintages, most notably in vintages 2012 and 2014.
In line with long-term norms, during the first six months, venture capital managers in the index allocated slightly more than 70% of their invested capital to IT and healthcare investments (in rank order). Other sectors, including communication services, consumer discretionary, financials, and industrials, all attracted at least 4% of the capital invested during the period, with communication services receiving slightly less than its long-term average.
Caryn Slotsky, Senior Investment Director
Wyatt Yasinski, Senior Investment Associate
Drew Carneal, Investment Associate
Figure Notes
US Private Equity and Venture Capital Index Returns
Private indexes are pooled horizon internal rates of return, net of fees, expenses, and carried interest. Returns are annualized, with the exception of returns less than one year, which are cumulative. Because the US private equity and venture capital indexes are capitalization weighted, the largest vintage years mainly drive the indexes’ performance.
Public index returns are shown as both time-weighted returns (average annual compound returns) and dollar-weighted returns (mPME). The Cambridge Associates Modified Public Market Equivalent replicates private investment performance under public market conditions. The public index’s shares are purchased and sold according to the private fund cash flow schedule, with distributions calculated in the same proportion as the private fund, and mPME net asset value is a function of mPME cash flows and public index returns.
Vintage Year Returns
Vintage year fund-level returns are net of fees, expenses, and carried interest.
Sector Returns
Industry-specific gross company-level returns are before fees, expenses, and carried interest.
GICS® Sector Comparisons
The Global Industry Classification Standard (GICS®) was developed by and is the exclusive property and a service mark of MSCI Inc. and S&P Global Market Intelligence LLC and is licensed for use by Cambridge Associates LLC. The Nasdaq Composite exposures are as of June 30, 2022 and represent the index’s sector breakdown prior to the GICS® reclassification that went into effect after close of business (ET) September 28, 2018. Cambridge Associates LLC will implement the GICS® reclassification for private companies with the release of September 30, 2018, benchmark data. “Other” includes sectors that make up less than 3% of the CA benchmark.
About the Cambridge Associates LLC Indexes
Cambridge Associates derives its US private equity benchmark from the financial information contained in its proprietary database of private equity funds. As of June 30, 2022, the database included 1,451 US buyouts and growth equity funds formed from 1986 to 2022, with a value of $1.3 trillion. Ten years ago, as of June 30, 2012, the index included 824 funds whose value was $473 billion.
Cambridge Associates derives its US venture capital benchmark from the financial information contained in its proprietary database of venture capital funds. As of June 30, 2022, the database comprised 2,290 US venture capital funds formed from 1981 to 2022, with a value of $513 billion. Ten years ago, as of June 30, 2012, the index included 1,392 funds whose value was $127 billion.
The pooled returns represent the net end-to-end rates of return calculated on the aggregate of all cash flows and market values as reported to Cambridge Associates by the funds’ general partners in their quarterly and annual audited financial reports. These returns are net of management fees, expenses, and performance fees that take the form of a carried interest.
About the Public Indexes
The Nasdaq Composite Index is a broad-based index that measures all securities (more than 3,000) listed on the Nasdaq Stock Market. The Nasdaq Composite is calculated under a market capitalization–weighted methodology.
The Russell 2000® Index includes the smallest 2,000 companies of the Russell 3000® Index (which is composed of the largest 3,000 companies by market capitalization).
The Standard & Poor’s 500 Composite Stock Price Index is a capitalization-weighted index of 500 stocks intended to be a representative sample of leading companies in leading industries within the US economy. Stocks in the index are chosen for market size, liquidity, and industry group representation.