First half 2020 was downright Dickensian (as in a “tale of two quarters”); first quarter returns were down as the COVID-19 pandemic began to close economies, while second quarter performance was strongly positive as public and private investments rebounded. For the six-month period, the Cambridge Associates LLC US Private Equity Index® returned 1.6% (-8.1% and 10.6% in first and second quarters, respectively). The Cambridge Associates LLC US Venture Capital Index® gained 6.2% in the first half, faring better than private equity due to a less negative first quarter (-2.8% and 9.3% in the first and second quarters, respectively). Within sectors across the two private asset classes, some industries excelled, and some suffered greatly, largely driven by an ability to conduct business during the pandemic. Figure 1 depicts performance for the private asset classes compared to the public markets. Cambridge Associates’ mPME calculation is a private-to-public comparison that seeks to replicate private investment performance under public market conditions.
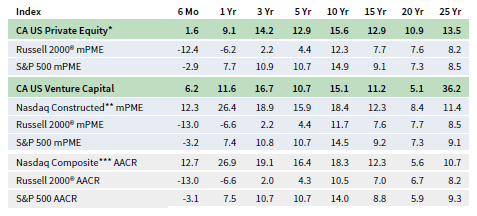
FIGURE 1 US PRIVATE EQUITY AND VENTURE CAPITAL INDEX RETURNS
Periods Ended June 30, 2020 • Percent (%)
* Includes US buyout and growth equity funds only.
** Data from 1/1/1986 to 10/31/2003 represented by the Nasdaq Price Index; data from 11/1/2003 to present by the Nasdaq Composite.
*** Capital change only.
Sources: Cambridge Associates LLC, Frank Russell Company, FTSE International Limited, Nasdaq, Standard & Poor’s, and Thomson Reuters Datastream.
First Half 2020 Highlights
- As of June 30, 2020, the private equity benchmark had outperformed the public indexes in all time periods. Other than over the 20-year period (which encompasses the tech wreck and the Global Financial Crisis), the venture capital index has had similar success, outpacing the S&P 500 and Russell 2000® indexes. The NASDAQ Composite has proven to be much more difficult to outperform due to its heavy technology weighting and the continued strength of IT in the public markets.
- Within the indexes, public companies accounted for a larger portion of venture capital than of private equity (about 14% compared with less than 9%). The exposure to non-US companies in the respective benchmarks is larger in private equity than in venture capital; both have been stable, at roughly 18% in private equity and around 10% in venture capital.
US Private Equity Performance Insights
Vintage Years
As of June 2020, nine vintage years were meaningfully sized—representing at least 5% of the benchmark’s value—and, combined, accounted for 88% of the index’s value. Six-month returns among the meaningfully sized vintages ranged from -5.5% for vintage year 2011 to 6.8% for vintage year 2013 (Figure 2). Among the large vintages, the oldest was the 13-year-“old” 2007 (which still represented 7.1% of the index), and the youngest was the 2018 vintage (which, after only two years of investing, represented 5.4%).
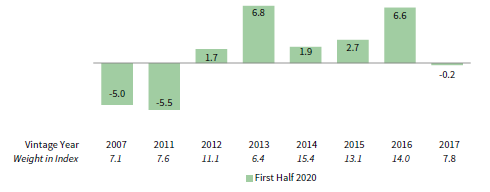
FIGURE 2 US PRIVATE EQUITY INDEX VINTAGE YEAR RETURNS:
NET FUND–LEVEL PERFORMANCE
As of June 30, 2020 • USD Terms • Percent (%)
Source: Cambridge Associates LLC.
Return drivers for the top two performing vintages were slightly different. For vintage year 2013, consumer discretionary companies were the primary positive contributor, while other sectors had a much lower impact on the vintage’s performance. For vintage year 2016 (whose market value at June 30 was almost evenly split between IT and all others), the performance drivers were IT and healthcare. In the lowest returning vintage (2011), nearly equal and significant write-downs in industrials and consumer discretionary, along with sizeable write-downs in energy and communication services, were the big drivers on the downside. Meanwhile, write-ups in IT and healthcare helped in some part to offset the losses.
The COVID-19 crisis appeared to impact fund-level cash flows. During the first two quarters of 2020, fund managers called more capital than they distributed, a shift from a nine-year trend of distributions outpacing capital calls. In addition, managers called and distributed less capital than they did in the previous six months. Capital calls totaled $46.0 billion, a 4% decrease, while distributions equaled $40.3 billion, a 34% decline from the six months ending December 2019.
Six vintage years (2014–19) represented 91% ($42.0 billion) of the capital calls, with each drawing down at least $3.6 billion in first half 2020; notably, the 2007 vintage called nearly $1 billion. Distributions were more widespread, with nine vintage years (2006–7, 2009, 2011–16) each returning $2.0 billion or more, for a total of $37.5 billion.
Sectors
Figure 3 shows the Global Industry Classification Standard (GICS®) sector breakdown of the private equity index and a public market counterpart, the Russell 2000® Index. The comparison provides context when comparing the performance of the two indexes. The largest differences are in IT, where the private equity index’s exposure is 2.5 times that of the Russell 2000® Index and in financials, where the public index’s weight is nearly 2.0 times larger than the private equity index. The chart also highlights a less meaningful private equity overweight in communication services and a considerable underweight in real estate, which is reflected in the “other” sector bucket.
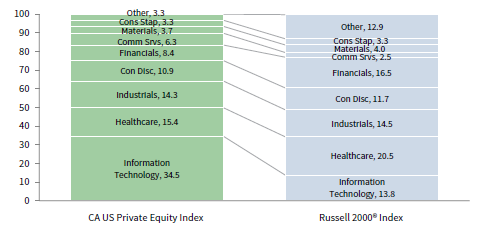
FIGURE 3 GICS® SECTOR COMPARISONS: CA US PRIVATE EQUITY VS RUSSELL 2000®
As of June 30, 2020 • Percent (%)
Sources: Cambridge Associates LLC, Frank Russell Company, and FTSE International Limited.
As of June 2020, among the six meaningfully sized sectors; IT remained the largest by a wide margin, representing more than a third of the index’s value at mid-year. First half returns for the six sectors ranged from -4.6% (communication services) to 11.9% (IT) (Figure 4). Write-ups for IT companies were widespread, with only one vintage experiencing moderate write downs (2006); by dollar, vintages 2012 and 2018 had the largest amount of IT company write ups. Conversely, in communication services (the smallest of the key sectors), write-downs were widespread. Worth noting, consumer staples (which represented 3.3% of the index’s value) posted a nearly 9% return for first half 2020, which is perhaps not surprising amid a global pandemic.

FIGURE 4 US PRIVATE EQUITY INDEX GICS® SECTOR RETURNS:
GROSS COMPANY–LEVEL PERFORMANCE
As of June 30, 2020 • USD Terms • Percent (%)
Source: Cambridge Associates LLC.
Investment activity in first half 2020 was dominated by four sectors. IT (38%), industrials (17%), healthcare (13%), and financials (12%) attracted 80% of the capital invested, which is about 21 percentage points higher than the investments in these sectors over the long term. Driving the difference is the percentage of capital allocated to IT, which historically was about 22% of invested capital. The consumer discretionary sector has garnered about 14% of the capital invested over the long term; in the first six months, that allocation was 8%.
US Venture Capital Performance Insights
Vintage Years
Venture managers returned 6.2% for the first six months of 2020, with all meaningfully sized vintage years, 2007–08 and 2010–17, earning positive returns for the period (Figure 5). Five vintages (2008, 2011, 2014, and 2016–17) posted returns greater than 5% for the period, with two vintages—2011 and 2016—returning double digits, at 26.5% and 11.8%, respectively. Despite the difficult market environment brought about by the COVID-19 pandemic, first half 2020 performance was stronger than that of the last six months of 2019, when the benchmark returned 5.2%.
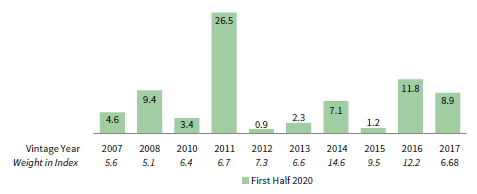
FIGURE 5 US VENTURE CAPITAL INDEX VINTAGE YEAR RETURNS:
NET FUND–LEVEL PERFORMANCE
As of June 30, 2020 • USD Terms • Percent (%)
Source: Cambridge Associates LLC.
IT and healthcare company valuation changes were the primary drivers of the semi-annual returns for all meaningfully sized vintages. The best-performing vintage year, 2011, enjoyed significant write-ups in both IT and healthcare, however IT valuations were responsible for a disproportionate share of the vintage’s valuation increase. For vintage 2012 (the lowest performing of the group), write-ups in the IT and healthcare sectors were offset by write-downs in consumer discretionary and financials. For the 2014 vintage (the largest vintage), significant write-ups in IT and healthcare were the largest contributors, with healthcare just edging out IT as the largest share of total valuation increases.
Venture capital fund managers called $10.9 billion from investors during the first six months of 2020, a slight increase from the last six months of 2019 and the fifth-largest semi-annual inflow. Of the half-year time periods to eclipse the first half of 2020, two occurred between third quarter 2018 and second quarter 2019, and two occurred in 2000. Distributions from venture funds were $17.1 billion, a 12% increase from second half 2019, and the fourth-largest semi-annual output since the inception of the benchmark. Total fund-level cash flows (contributions plus distributions) were also the fourth-highest for any six-month period in the history of the index, a figure that has experienced a primarily upward trend since the most recent low in first half 2003. Additionally, net cash flows—a measure that has tended to be cyclical—have seen an increasing trend recently. The difference between distributions and contributions reached its widest level since second half 2014, in stark contrast to US private equity, which has seen the difference narrowing for several years and saw contributions outpace distributions during the first six months.
Funds formed from 2017 to 2019 were responsible for more than 70% ($7.7 billion) of the total capital called during the first six months. These three vintage years each called more than $2.1 billion; the 2018 vintage led the way with capital calls of more than $3.3 billion. Distributions from vintage years 2010–11 and 2014 totaled $8.4 billion, representing slightly less than 50% of the total of the semi-annual period. These three vintages each distributed more than $2.0 billion in the first six months, and the two vintage years with the largest distributions, 2010 and 2011, accounted for 37% of all distributions over the semi-annual period. Despite being 12 years “old,” funds formed in 2008 distributed greater than $1.3 billion (almost 8% of total distributions) and ranked fourth in this respect, likely related to the observed trend of companies staying private longer.
Sectors
Figure 6 shows the GICS® sector breakdown of the venture capital index and a public market counterpart, the NASDAQ Composite Index. The breakdown provides context when comparing the performance of the two indexes. The chart highlights the venture index’s relative overweight in healthcare, slight underweight in IT, and more substantial underweights in consumer discretionary and communication services.

FIGURE 6 GICS® SECTOR COMPARISONS: CA US VENTURE CAPITAL VS NASDAQ COMPOSITE
As of June 30, 2020 • Percent (%)
Source: Cambridge Associates LLC, NASDAQ, and Factset Research Systems.
Collectively, the six meaningfully sized sectors made up more than 95% of the index (Figure 7). Four of the six meaningfully sized sectors had positive returns in first half 2020, with performance varying widely by sector. Healthcare earned the best return (15.1%), beating out strong performance from the IT sector (11.0%), while industrials and consumer discretionary companies posted middling to flat returns, at 6.0% and 0.1%, respectively. Communication services, at -0.5%, and financials, at -2.7%, brought up the rear. The healthcare return was driven primarily by write-ups in funds from three vintages, 2014 and 2016–17. Vintages 2014 and 2016 represented the lion’s share of the writeups, together accounting for nearly half of the returns in the healthcare sector; adding the 2017 vintage funds brings this to nearly 60%. IT valuation increases were concentrated in four vintages, 2008, 2011, 2014, and 2016, with 2011 standing head and shoulders above the rest at more than $3.5 billion, or almost 38% of the sector’s total appreciation. Appreciation in the industrials sector was driven almost exclusively by funds in two vintage years, 2007 and 2016, that together accounted for more than 71% of the sector’s total write-ups. Consumer discretionary saw mixed gains and losses across vintages with the exception of 2014, which saw meaningful write-ups in the sector. Communication services and financials saw widespread write-downs across vintages.
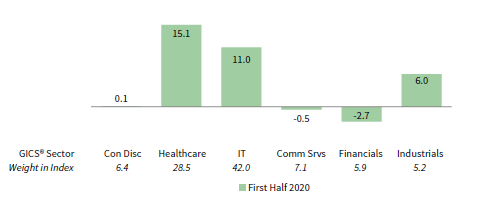
FIGURE 7 US VENTURE CAPITAL INDEX GICS® SECTOR RETURNS:
GROSS COMPANY–LEVEL PERFORMANCE
As of June 30, 2020 • USD Terms • Percent (%)
Source: Cambridge Associates LLC.
During the first six months, venture capital managers in the index allocated most of their capital to investments in healthcare and IT companies (in rank order). These two sectors garnered about 75% of the capital invested over the period, about 3% higher than the long-term norm for the two sectors.
Caryn Slotsky, Senior Investment Director
Wyatt Yasinski, Investment Associate
Drew Carneal, Investment Analyst
Figure Notes
US Private Equity and Venture Capital Index Returns
Private indexes are pooled horizon internal rates of return, net of fees, expenses, and carried interest. Returns are annualized, with the exception of returns less than one year, which are cumulative. Because the US private equity and venture capital indexes are capitalization weighted, the largest vintage years mainly drive the indexes’ performance.
Public index returns are shown as both time-weighted returns (average annual compound returns) and dollar-weighted returns (mPME). The CA Modified Public Market Equivalent replicates private investment performance under public market conditions. The public index’s shares are purchased and sold according to the private fund cash flow schedule, with distributions calculated in the same proportion as the private fund, and mPME net asset value is a function of mPME cash flows and public index returns.
Vintage Year Returns
Vintage year fund-level returns are net of fees, expenses, and carried interest.
Sector Returns
Industry-specific gross company-level returns are before fees, expenses, and carried interest.
GICS® Sector Comparisons
The Global Industry Classification Standard (GICS®) was developed by and is the exclusive property and a service mark of MSCI Inc. and S&P Global Market Intelligence LLC and is licensed for use by Cambridge Associates LLC. The public index exposures are as of June 30, 2020 and represent the index’s sector breakdown after the GICS® reclassification that went into effect after close of business (ET) September 28, 2018. Cambridge Associates LLC implemented the GICS® reclassification for private companies with the release of September 30, 2018 benchmark data. “Other” includes sectors that make up less than 3% of the CA benchmark.
About the Cambridge Associates LLC Indexes
Cambridge Associates derives its US private equity benchmark from the financial information contained in its proprietary database of private equity funds. As of June 30, 2020, the database included 1,209 US buyouts and growth equity funds formed from 1986 to 2020, with a value of $725 billion. Ten years ago, as of June 30, 2010, the index included 744 funds whose value was $368 billion.
Cambridge Associates derives its US venture capital benchmark from the financial information contained in its proprietary database of venture capital funds. As of June 30, 2020, the database comprised 1,970 US venture capital funds formed from 1981 to 2020, with a value of $271 billion. Ten years ago, as of June 30, 2010, the index included 1,310 funds whose value was $95 billion.
The pooled returns represent the net end-to-end rates of return calculated on the aggregate of all cash flows and market values as reported to Cambridge Associates by the funds’ general partners in their quarterly and annual audited financial reports. These returns are net of management fees, expenses, and performance fees that take the form of a carried interest.
About the Public Indexes
The Nasdaq Composite Index is a broad-based index that measures all securities (over 3,000) listed on the Nasdaq Stock Market. The Nasdaq Composite is calculated under a market capitalization– weighted methodology.
The Russell 2000® Index includes the smallest 2,000 companies of the Russell 3000® Index (which is composed of the largest 3,000 companies by market capitalization).
The Standard & Poor’s 500 Composite Stock Price Index is a capitalization-weighted index of 500 stocks intended to be a representative sample of leading companies in leading industries within the US economy. Stocks in the index are chosen for market size, liquidity, and industry group representation.