For first half 2019, US private equity[1]The CA Private Equity Index includes US buyout and growth equity funds. and venture capital produced double-digit returns, as indicated by the Cambridge Associates LLC benchmark indexes. The Cambridge Associates LLC US Private Equity Index® returned 10.6% from January through June (5.6% and 4.7% for first quarter and second quarter, respectively), a significant improvement over the previous six-month period. The Cambridge Associates LLC US Venture Capital Index® returned 13.8% for the same period (6.5% and 6.9% for first quarter and second quarter, respectively), a jump from the prior six months when US venture capital earned 7.1%. During first half 2019, public companies generally rebounded from their fourth quarter losses, led by technology and large-cap businesses. Figure 1 depicts performance for the private asset classes compared to the public markets. Cambridge Associates’ mPME calculation is a private-to-public comparison that seeks to replicate private investment performance under public market conditions.
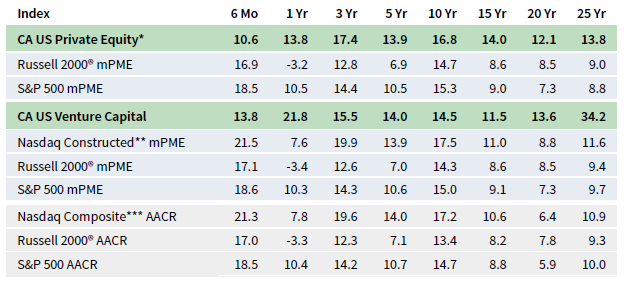
FIGURE 1 US PRIVATE EQUITY AND VENTURE CAPITAL INDEX RETURNS
Periods Ended June 30, 2019 • Percent (%)
* Includes US buyout and growth equity funds only.
** Data from 1/1/1986 to 10/31/2003 represented by the Nasdaq Price Index; data from 11/1/2003 to present by the Nasdaq Composite.
*** Capital change only.
Sources: Cambridge Associates LLC, Frank Russell Company, FTSE International Limited, Nasdaq, Standard & Poor’s, and Thomson
Reuters Datastream.
First Half 2019 Highlights
- As of June 30, 2019, except for the most recent six-month period, the private equity benchmark had outperformed the public indexes in all time periods. The venture capital index had mixed success against the various public market indexes in periods of ten years or less, but outperformed in the longer time periods listed in the table. The US VC index struggled most to beat the NASDAQ composite, reflecting the strong performance of IT in the public markets.
- Public companies accounted for similar proportions of the private equity and venture capital indexes (11% to 12%). Non-US company exposures in the private equity and venture capital indexes have remained stable, roughly 18% in the private equity benchmark and around 10% in the venture capital benchmark as of June 30, 2019.
US Private Equity Performance Insights
Vintage Years
As of June 2019, seven vintage years were meaningfully sized—representing at least 5% of the benchmark’s value—and, combined, accounted for almost 80% of the index’s value. Six-month returns among the meaningfully sized vintages ranged from 8.9% for vintage year 2011 to 16.4% for vintage year 2016 (Figure 2). Despite its “age,” the 2007 vintage year still represented one of the largest components of the index.
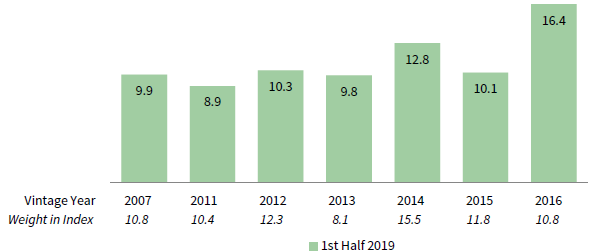
FIGURE 2 US PRIVATE EQUITY INDEX VINTAGE YEAR RETURNS:
NET FUND–LEVEL PERFORMANCE
As of June 30, 2019 • USD Terms • Percent (%)
Source: Cambridge Associates LLC.
IT and industrials were instrumental in driving performance for vintages 2016 and 2011, and healthcare was also a key contributor to the best-performing 2016 vintage. Since its inception, the 2011 vintage has invested nearly equal amounts in three key sectors, IT, industrials, and consumer discretionary. The 2016 vintage, since its inception, has invested nearly three times as much in IT as in the next largest sector, industrials.
During the first two quarters of 2019, fund managers called and distributed less capital than they did in the previous six months. Capital calls totaled $51.7 billion, a 6% decrease, while distributions equaled $54.7 billion, an 18% decline from the six months ended December 2018. Aggregate cash flow amounts dropped from the fourth quarter to the first and again from the first to the second, with distributions declining more in the first quarter and calls declining more in the second. As they decreased in aggregate, cash flows also moved closer to a state of equilibrium, as the difference between calls and distributions was less than a billion dollars in the second quarter. Despite representing the smallest margin of difference in three years, it still extends the seven-and-a-half year trend of distributions outpacing contributions.
Capital calls were largely concentrated among five vintage years (2014–18), each of which drew down at least $7.7 billion in first half 2019; as a group, they called $46.5 billion and accounted for 90% of the capital drawn during the period. Distributions were more widespread, with 11 vintage years (2005–15) each returning $2.3 billion or more for a total of $51.3 billion.
Sectors
Figure 3 shows the GICS sector breakdown of the private equity index and a public market counterpart, the Russell 2000® Index. The breakdown provides context when comparing the performance of the two indexes. The private equity index’s most significant overweight and underweight are in IT and financials, respectively. The chart also highlights less meaningful PE overweights in communication services and consumer discretionary and the underweight in real estate, which is reflected in the “other” sector bucket.
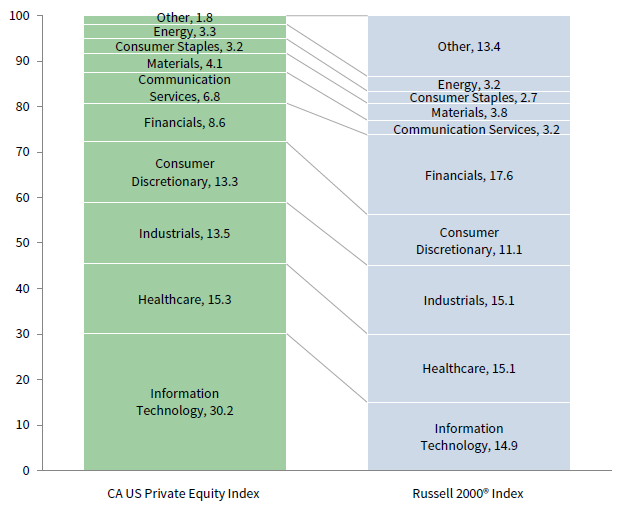
FIGURE 3 GICS SECTOR COMPARISONS: CA US PRIVATE EQUITY VS RUSSELL 2000®
As of June 30, 2019 • Percent (%)
* The private equity index includes only buyout and growth equity funds.
Sources: Cambridge Associates LLC, Frank Russell Company, and FTSE International Limited.
As of June 2019, there were six meaningfully sized sectors; IT was by far the largest, representing nearly a third of the index’s value at mid-year. Six-month returns among the six sectors ranged from 6.4% (communication services) to 17.4% (IT) (Figure 4). Write-ups for IT companies were widespread and by dollar, led by vintages 2007 and 2014–2016. IT performance was similarly strong in the public markets. In communication services (the smallest of the key sectors), write-ups were relatively modest, with vintage year 2012 seeing the highest amount of writeups.
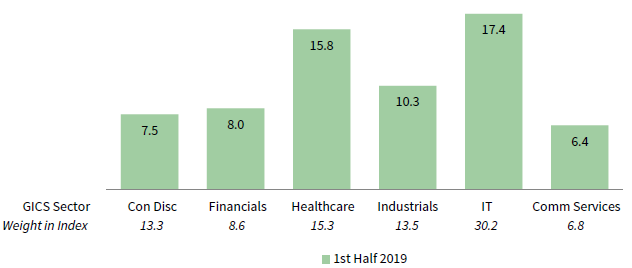
FIGURE 4 US PRIVATE EQUITY INDEX GICS SECTOR RETURNS:
NET FUND-LEVEL PERFORMANCE
As of June 30, 2019 • USD Terms • Percent (%)
Source: Cambridge Associates LLC.
Four sectors dominated investment activity in first half 2019. IT (42%), healthcare (12%), consumer discretionary (12%), and industrials (10%) attracted more than 75% of the capital invested, which is about 11 percentage points higher than the investments in these sectors over the long term. Driving the difference is the percentage of capital allocated to IT, which historically was about 22% of invested capital.
US Venture Capital Performance Insights
Vintage Years
Venture managers returned 13.8% for the first six months of 2019 with all meaningfully sized vintage years, 2007–08 and 2010–16, earning positive returns for the period (Figure 5). Eight of the nine large vintages—2007 and 2010–16—posted double-digit returns, with 2011 returning the highest (19.1%). First half 2019 performance was much stronger than that of the last six months of 2018, when the benchmark returned 7.1%.
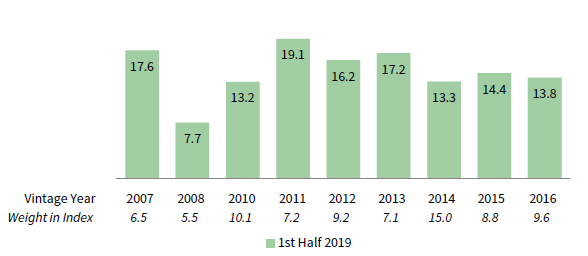
FIGURE 5 US VENTURE CAPITAL INDEX VINTAGE YEAR RETURNS:
NET FUND–LEVEL PERFORMANCE
As of June 30, 2019 • USD Terms • Percent (%)
Source: Cambridge Associates LLC.
IT company valuation changes were the primary drivers of the semi-annual returns for all meaningfully sized vintage years except 2008. Vintage year 2011, the best-performing vintage, enjoyed significant write-ups in IT and healthcare; however, IT valuations were responsible for a disproportionate share of the vintage’s valuation increase. For vintage year 2008, the lowest performing of the group, healthcare and consumer discretionary valuations drove returns. For the 2014 vintage (the largest in the index), significant write-ups in IT and healthcare were the largest contributors.
Venture capital fund managers called $11.2 billion from investors during the first six months, a 3% decrease from the last six months of 2018 but still the fourth largest semi-annual inflow. The only half-year time periods that eclipse the past two occurred in 2000. Distributions from venture funds were $17.7 billion, almost a 26% increase from second half 2018, and the third largest semi-annual output since the inception of the benchmark. Total fund-level cash flows (contributions plus distributions) were the third highest for any six-month period in the history of the index, a figure that has experienced a primarily upward trend since the most recent low in first half 2003. Additionally, net cash flows—a measure that tends to be cyclical—have seen an increasing trend recently, with the difference between distributions and contributions reaching its widest level since first half 2015.
Funds formed from 2015 to 2018 were responsible for 84% ($9.4 billion) of the total capital called during the first six months. These four vintage years each called more than $1.1 billion; the 2018 vintage led the way with capital calls of more than $3.0 billion. Distributions from vintage years 2005–08, 2010, and 2012–14 totaled $12.9 billion, representing almost 73% of the total of the semi-annual period. These eight vintages each distributed an average of about $1.6 billion in the first six months, and the two vintage years with the largest distributions, 2007 and 2008, accounted for 29% of all distributions over the semi-annual period.
Sectors
Figure 6 shows the GICS sector breakdown of the venture capital index and a public market counterpart, the Nasdaq Composite Index. The breakdown provides context when comparing the performance of the two indexes. The chart highlights the venture index’s relative overweights in healthcare and IT, and its underweights in consumer discretionary, communication services, and financials.

FIGURE 6 GICS SECTOR COMPARISONS: CA US VENTURE CAPITAL VS NASDAQ COMPOSITE
As of June 30, 2019 • Percent (%)
Source: Cambridge Associates LLC, Nasdaq, and Factset Research Systems.
All four meaningfully sized sectors had positive returns in first half 2019, and collectively these sectors make up more than 85% of the index (Figure 7). IT earned the best return (20.7%), beating out strong performance from the healthcare sector (16.6%), while consumer discretionary and communication services companies posted more middling returns, at 11.5% and 9.7%, respectively. The IT return was mostly driven by write-ups in the 2007, 2011, 2010, and 2012–14, and 2016 vintage year funds (in rank order) which, combined, represented about three fourths of the sector’s write-ups. Despite its “age,” the 2005 vintage saw meaningful write-ups over the period. Healthcare valuation increases were concentrated in four vintages, 2013–16. Consumer discretionary was relatively flat across all vintages with the exception of 2012 and 2014, which each saw meaningful write-ups in the sector. Write-ups in communication services were most prominent in 2014 vintage funds.
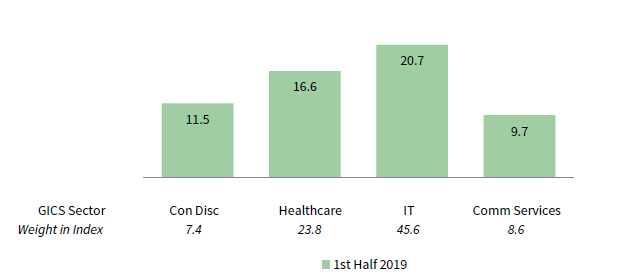
FIGURE 7 US VENTURE CAPITAL INDEX GICS SECTOR RETURNS:
GROSS COMPANY–LEVEL PERFORMANCE
As of June 30, 2019 • USD Terms • Percent (%)
Source: Cambridge Associates LLC.
During the first six months, venture capital managers in the index allocated the lion’s share of their capital to investments in IT and healthcare companies (in rank order). These two sectors have garnered about 74% of the capital invested over both the period and the long term. The other two sectors that attracted meaningful capital in 2019 were consumer discretionary and communication services.
Caryn Slotsky, Senior Investment Director
Sarah Grifferty, Senior Investment Associate
Wyatt Yasinski, Investment Associate
About the Cambridge Associates LLC Indexes
Cambridge Associates derives its US private equity benchmark from the financial information contained in its proprietary database of private equity funds. As of June 30, 2019, the database included 1,154 US buyouts and growth equity funds formed from 1986 to 2019, with a value of $686 billion. Ten years ago, as of June 30, 2009, the index included 730 funds whose value was $286 billion.
Cambridge Associates derives its US venture capital benchmark from the financial information contained in its proprietary database of venture capital funds. As of June 30, 2019, the database comprised 1,879 US venture capital funds formed from 1981 to 2019, with a value of $266 billion. Ten years ago, as of June 30, 2009, the index included 1,303 funds whose value was $85 billion.
The pooled returns represent the net end-to-end rates of return calculated on the aggregate of all cash flows and market values as reported to Cambridge Associates by the funds’ general partners in their quarterly and annual audited financial reports. These returns are net of management fees, expenses, and performance fees that take the form of a carried interest.
About the Public Indexes
The Nasdaq Composite Index is a broad-based index that measures all securities (over 3,000) listed on the Nasdaq Stock Market. The Nasdaq Composite is calculated under a market capitalization–weighted methodology.
The Russell 2000® Index includes the smallest 2,000 companies of the Russell 3000® Index (which is composed of the largest 3,000 companies by market capitalization).
The Standard & Poor’s 500 Composite Stock Price Index is a capitalization-weighted index of 500 stocks intended to be a representative sample of leading companies in leading industries within the US economy. Stocks in the index are chosen for market size, liquidity, and industry group representation.
Footnotes