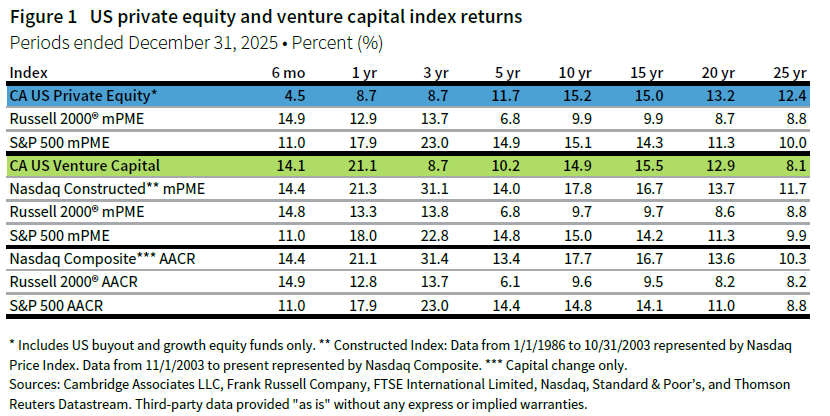
Amid an environment where tech companies reigned supreme, returns for US private equity and venture capital diverged from one another, with venture besting both public and private equities. For 2025, the Cambridge Associates LLC US Private Equity Index® returned 8.7% and the Cambridge Associates LLC US Venture Capital Index® returned 21.1%. Within the private equity cohort, growth equity (11.9%) outperformed buyouts (7.6%). Figure 1 depicts performance for the private asset classes compared to the public markets.[1]Cambridge Associates’ modified public market equivalent (mPME) calculation is a private-to-public comparison that seeks to replicate private investment performance under public market conditions.
Calendar year 2025 highlights
- With the extension of concentrated, strong public market performance, return comparisons of the US private equity (PE) index and public markets favored the public markets in most time periods shorter than ten years. US PE returns exceeded those of the Russell 2000® more often than those of the S&P 500. Following a strong 2025, the US venture capital (VC) benchmark outperformed public indexes over shorter periods, but its record remains less consistent across the time periods shown—particularly relative to the tech-heavy Nasdaq.
- At the end of 2025, public companies accounted for a slightly higher percentage of the VC index’s market value than that of the PE index (roughly 6% and 5%, respectively). Those percentages are expected to change with the IPO activity in the first half of 2026 and those slated to occur later in the year. In 2025, non-US companies represented almost one-quarter of PE and less than 15% of VC.
US private equity performance insights
US private equity had a mixed year in 2025. Exit activity was healthier than in 2023 and 2024, but fundraising was slower, valuations remained elevated, and software investments came under pressure from artificial intelligence (AI) at the end of the year. Lastly, while limited partner (LP) distributions outpaced contributions again, the distribution yield was lower than historical averages for the fourth year in a row.
According to Pitchbook, buyout and add-on investment activity was broadly in line with 2024 levels, with buyouts ticking up modestly and add-ons declining slightly, while public to private deals fell by count and increased by value. For exits, 27 US PE-backed companies went public in 2025 at a combined valuation of $126 billion, more than double the combined value of PE-backed IPOs from 2022 to 2024. The largest PE-backed IPO was energy producer Venture Global LNG. PE-backed merger & acquisition (M&A) and sponsor-to-sponsor transactions were equal at 651 each; by value, they were worth nearly $550 billion, or 1.6x the 2024 level.
Vintage years
As of December 2025, seven vintage years (2017–23) were meaningfully sized—representing at least 5% of the benchmark’s net asset value (NAV)—and, combined, accounted for 81% of the index’s value. Calendar year returns among the key vintages ranged from 4.2% for 2018 to 16.7% for 2023. The two largest vintages (2021 and 2019) returned 10.6% and 5.7%, respectively (Figure 2).
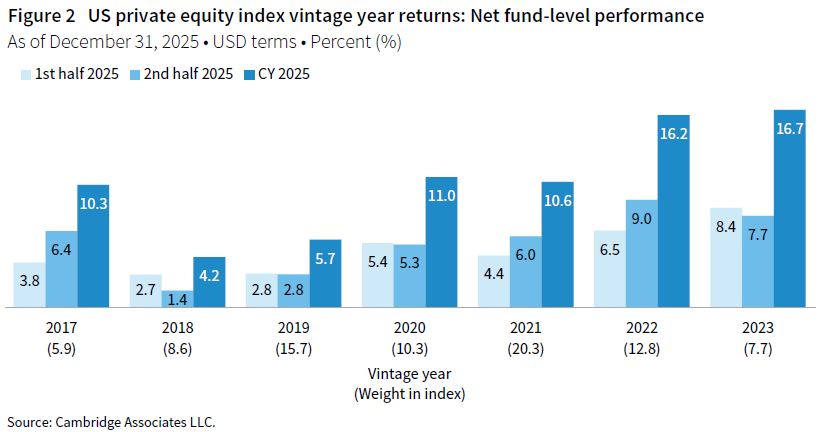
Across the seven vintage years, performance for the two PE strategies—buyouts and growth equity—varied. Buyout returns were in the single digits for the more mature vintages (2017–19) and were highest for the youngest vintage (2023). Growth equity returns were more dispersed; as with buyouts, they were weakest for the 2018–19 vintages and strongest for the 2022 cohort.
From a sector perspective, the two best-performing vintages (2022–23) benefited from strong returns on their sizable IT allocations, with roughly one-third of market value in technology companies for both cohorts. Healthcare also supported 2022 performance, while communication services helped boost 2023 results. For the 2018–19 vintages, which posted the weakest results for the year, IT companies were also the primary driver, though returns there were only in the mid-single digits.
LP cash flows
In both 2024 and 2025, LP distributions outpaced contributions, reversing the pattern seen in 2022–23. In 2025, fund managers distributed $185 billion and called $145 billion. Those totals represented a 5% increase in capital returned to LPs and a nearly 10% decline in LP contributions (Figure 3). Despite marking the second-highest annual distribution total, the distribution yield—calculated as distributions divided by NAV—remained below average for the fourth consecutive year.
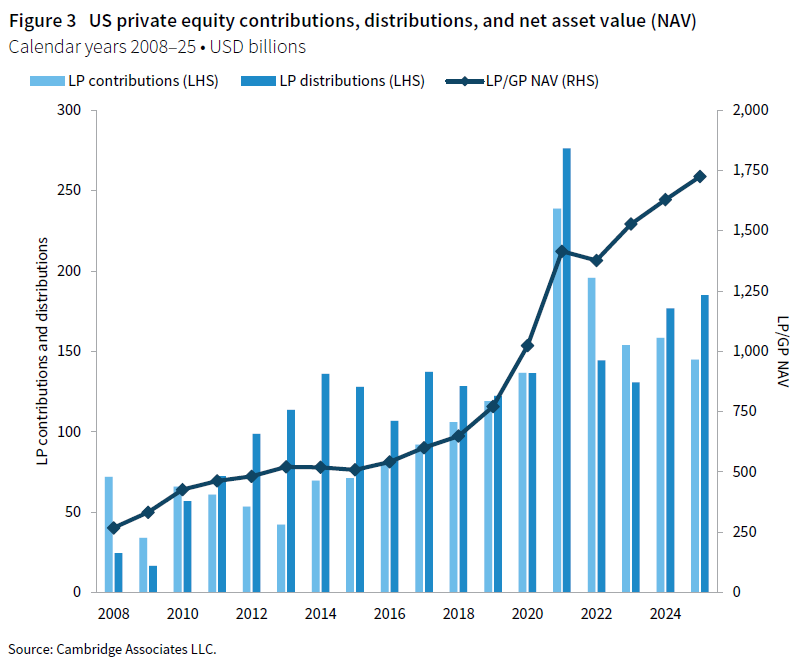
Five vintage years (2021–25) represented 89% ($129 billion) of the capital calls, with each drawing down more than $14 billion during the year; the 2023 vintage called the most, $39 billion. Nine vintages (2013–21) accounted for 84% of the distributions, with amounts ranging from nearly $10 billion (2013 vintage) to almost $28 billion (2019 vintage).
Sectors
Figure 4 shows the Global Industry Classification Standard (GICS®) sector breakdown by market value of the PE index and a public market counterpart, the Russell 2000® Index. The comparison provides context when comparing the performance of the two indexes. The PE index continued to have significant overweights to IT and communication services as well as meaningful underweights to financials, energy, and real estate (the latter two are reflected in the “other” category).
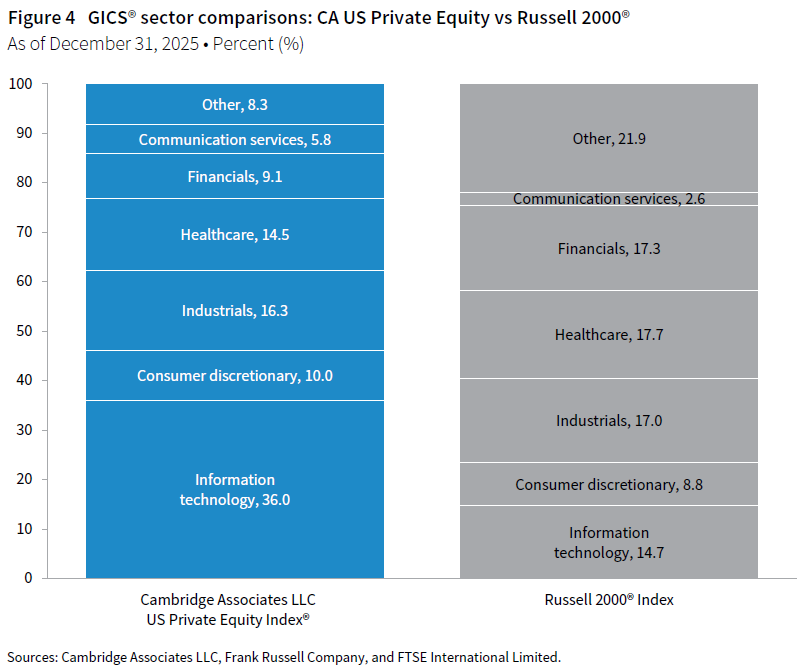
As of December 2025, there were six key sectors by size and combined they represented more than 90% of the index’s market value; IT was by far the largest (36% of the index’s market value). Calendar year returns ranged from 3.5% for consumer discretionary to 14.0% for industrials (Figure 5).
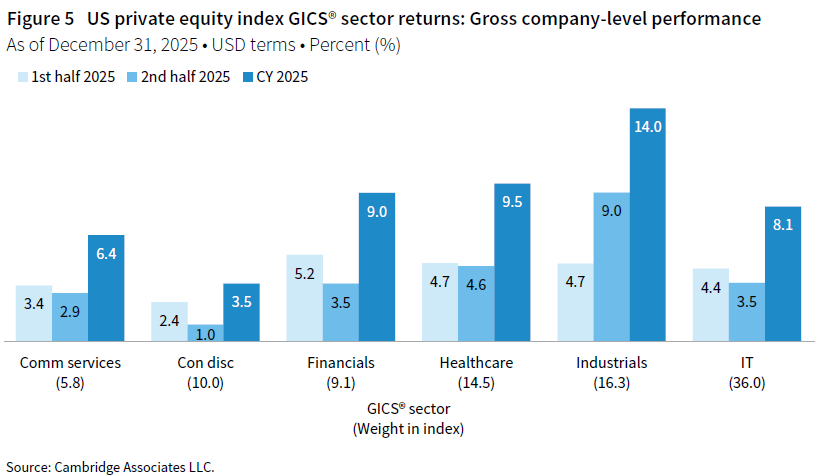
US PE managers allocated nearly 70% of the capital they invested in 2025 to three sectors—IT (37%), industrials (16%), and healthcare (15%). Over the long term, those sectors garnered about 54% of capital invested, and IT accounted for the bulk of the difference between 2025 and historical activity.
US venture capital performance insights
The Cambridge Associates US VC index returned 21.1% in 2025, its best year since 2021. Performance was concentrated, with less mature vintages outperforming older ones and later stage strategies delivering the strongest returns. Exit activity was stronger in 2025 than in 2024, but the industry’s multi-year distribution drought and relatively weak performance contributed to a slowdown in fundraising.
According to the National Venture Capital Association and PitchBook, US VC managers completed more than 15,000 deals in 2025, valued at more than $320 billion, the highest annual tally since 2021. Compared to 2024, deal counts increased in early and later stages, while activity declined in the pre-seed and seed stages. US VC-backed exits also rose in 2025, with 1,514 exits versus 1,287 in 2024, and total exit value nearly doubled to $287 billion from $155 billion. Exit values for each type—IPO, M&A, and buyouts—were higher in 2025. Although there was only one more IPO/public listing in 2025 than in 2024, total IPO value was about 2.5x higher, while M&A and buyouts combined were worth roughly 1.6x their 2024 total. The two largest IPOs/public listings were software companies CoreWeave and Figma.
Vintage years
As of December 2025, eight vintage years (2017–24) were meaningfully sized and together accounted for 72% of the index’s NAV. Across the eight vintages, all but one earned double-digit returns for the year, with performance ranging from 9.4% for the 2018 vintage to 50.5% for the 2023 vintage. The strongest results came from the youngest vintages, and, unusually, two relatively young cohorts already represented more than 5% of the index’s value (Figure 6).
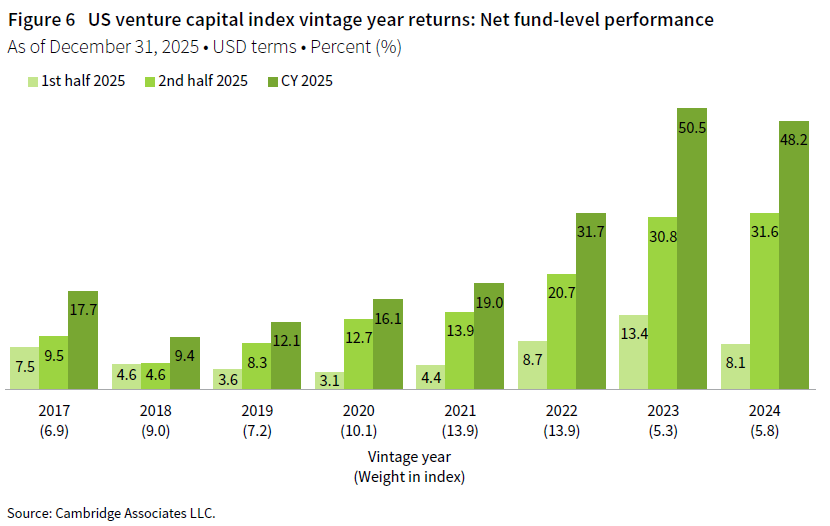
While many sectors produced eye-popping returns in the best-performing vintage (2023), IT was the primary driver with its massive weighting and its 80% return in 2025. In the worst-performing vintage (2018), returns were somewhat muted across the sectors, with IT again leading at 13%.
LP cash flows
US VC LP cash flow activity was more robust in 2025 than 2024, with capital calls increasing 13% and distributions rising by nearly 40%. Managers called $61 billion from LPs—the second highest for any year on record—and returned $42 billion (Figure 7). Since 2021, which was the last year that managers distributed more than they called, the ratio of LP contributions to distributions has been 1.6x, coinciding with the asset class’s single-digit annual distribution yield (distributions/NAV).
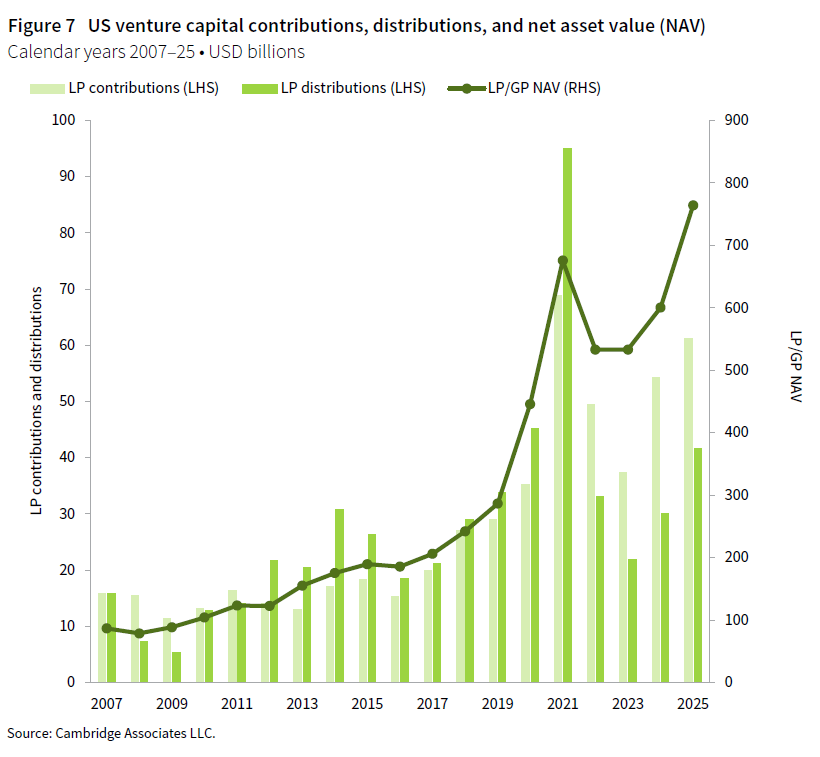
As is typical, the number of vintages driving contributions is much smaller than those largely responsible for distributions. Five vintage years (2021–25) accounted for 93% ($57 billion) of the total capital called during the year, while 13 vintages (2007, 2011–22) were responsible for 92% of distributions. Among the five vintages driving contributions, calls ranged from about $7 billion to $18 billion with the oldest and largest among them, 2021, calling the least. Among the 13 widespread vintages boosting the distributions total, the range was $1 billion to $5 billion, led by the 2014 cohort.
Sectors
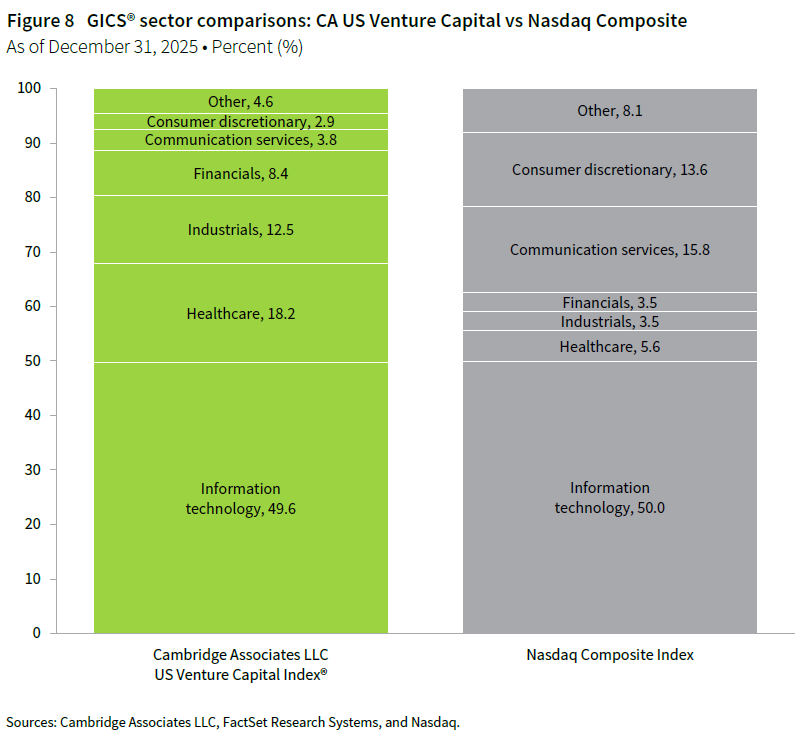
Figure 8 shows the GICS® sector breakdown of the VC index by market value and a public market counterpart, the Nasdaq Composite Index. The VC index had meaningfully higher exposures to healthcare, financials, and industrials. The overweight to industrials, however, may prove short lived as large companies go public and shift sectors in 2026. Roughly half of both the VC and Nasdaq indexes were invested in technology companies at year end, while Nasdaq weightings in communication services and consumer discretionary remained much higher than those of the VC index.
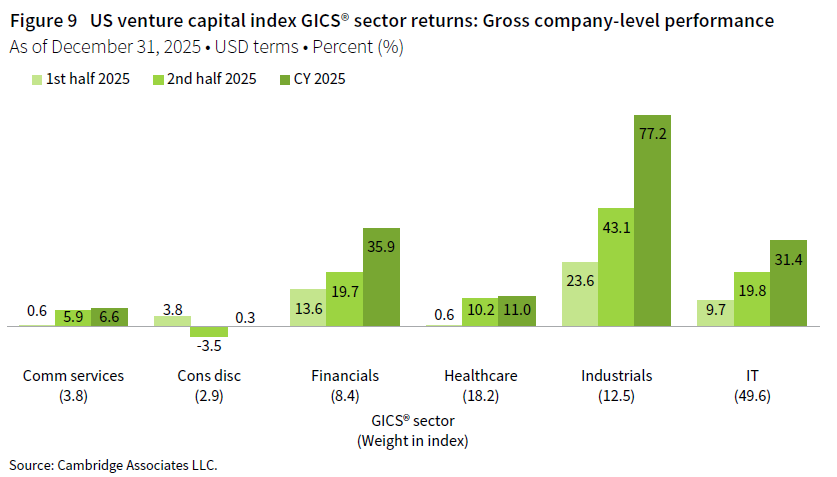
More than 95% of the VC index’s value resided in six sectors in 2025 (Figure 9). Performance varied sharply across the sectors, ranging from 0.3% for consumer discretionary to 77.2% for industrials, which in 2025 included at least one company that went public in 2026. During the year, VC managers in the index allocated about three-quarters of their invested capital to two sectors, IT (51%) and healthcare (24%). Only two other sectors, financials (9%) and industrials (7%), garnered 5% or more of capital during the year. Over the long term, more than 70% of capital invested by VC managers went to IT and healthcare companies.
Caryn Slotsky, Managing Director, PI Strategy Research
Drew Carneal, Investment Director, PI Strategy Research
Adam Sample, Senior Investment Associate, PI Strategy Research
Figure notes
Private equity includes only buyout and growth equity funds.
US private equity and venture capital index returns
Private indexes are pooled horizon internal rates of return, net of fees, expenses, and carried interest. Returns are annualized, with the exception of returns less than one year, which are cumulative. Because the US private equity and venture capital indexes are capitalization weighted, the largest vintage years mainly drive the indexes’ performance.
Public index returns are shown as both time-weighted returns (average annual compound returns) and dollar-weighted returns (mPME). The CA mPME replicates private investment performance under public market conditions. The public index’s shares are purchased and sold according to the private fund cash flow schedule, with distributions calculated in the same proportion as the private fund, and mPME net asset value is a function of mPME cash flows and public index returns.
Vintage year returns
Vintage year fund-level returns are net of fees, expenses, and carried interest.
Sector returns
Industry-specific gross company-level returns are before fees, expenses, and carried interest.
GICS® sector comparisons
The Global Industry Classification Standard (GICS®) was developed by and is the exclusive property and a service mark of MSCI Inc. and S&P Global Market Intelligence LLC and is licensed for use by Cambridge Associates LLC.
About the Cambridge Associates LLC indexes
Cambridge Associates derives its US private equity benchmark from the financial information contained in its proprietary database of private equity funds. As of December 31, 2025, the database included 1,769 US buyout and growth equity funds formed from 1983 to 2025, with a total value of $1.7 trillion. Ten years earlier, as of December 31, 2015, the index included 1,032 funds whose total value was $509 billion.
Cambridge Associates derives its US venture capital benchmark from the financial information contained in its proprietary database of venture capital funds. As of December 31, 2025, the database comprised 2,816 US venture capital funds formed from 1981 to 2024, with a value of $764 billion. Ten years prior, as of December 31, 2015, the index included 1,643 funds whose value was $190 billion.
The pooled returns represent the net end-to-end rates of return calculated on the aggregate of all cash flows and market values as reported to Cambridge Associates by the funds’ general partners in their quarterly and annual audited financial reports. These returns are net of management fees, expenses, and performance fees that take the form of a carried interest.
About the public indexes
The Nasdaq Composite Index is a broad-based index that measures all securities (more than 3,000) listed on the Nasdaq Stock Market. The Nasdaq Composite is calculated under a market capitalization–weighted methodology. The Russell 2000® Index includes the smallest 2,000 companies of the Russell 3000® Index (which is composed of the largest 3,000 companies by market capitalization). The Standard & Poor’s 500 Composite Stock Price Index is a capitalization-weighted index of 500 stocks intended to be a representative sample of leading companies in leading industries within the US economy. Stocks in the index are chosen for market size, liquidity, and industry group representation.
Footnotes