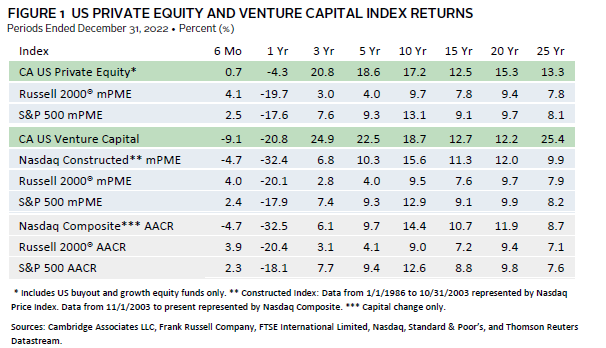
A year after posting their second highest annual returns ever, performance for the US private equity (PE) and venture capital (VC) indexes fell back to earth in 2022. For the year, the Cambridge Associates LLC US Private Equity Index® lost 4.3% and the Cambridge Associates LLC US Venture Capital Index® fell 20.8%. Macroeconomic factors and severe downturns in public markets, especially in the tech sector, were major drivers of the private asset classes’ negative returns. Figure 1 details performance for the private asset classes and the public markets[1]Cambridge Associates’ mPME calculation is a private-to-public comparison that seeks to replicate private investment performance under public market conditions. over the short, medium, and long terms.
Calendar Year 2022 Highlights
- As of December 31, 2022, the PE benchmark outperformed the public indexes in all but one period listed in the table (the second half of 2022), with its most notable relative outperformance coming in the COVID-19 pandemic era. In the three years ended December 2022, PE returned 21% and small- and large-cap US public company indexes posted single-digit results. The only time periods when the VC index underperformed the S&P 500 were in 2022, when the asset class’s technology concentration was a liability. In 2023, the tech sector and particularly the Nasdaq rebounded dramatically, which could lead to a stemming of losses for the private asset classes.
- By the end of 2022, the value of public companies in both the USPE (7%) and USVC (9%) indexes had fallen below 10%. In 2021, public companies were a major driver of performance, especially for VC. Non-US companies were a much larger component of the PE index (about 20%) than the VC index (less than 13%) at year-end.
- Industrials was the best-performing large sector in the US PE/VC indexes in 2022. In PE, it was the only one to earn a positive annual return and in VC, it was the only one to drop less than 15% for the year.
US Private Equity Performance Insights
Most PE market factors—including fundraising, investing, exits, and returns—began to reset in 2022 when rapidly rising interest rates and higher inflation took hold of the overall environment. While PE portfolio company valuations did not fall in lock step with those of the public markets and PE returns were only down in one quarter of the year (and were flat for three), the industry was operating differently and at a slower pace. Cash flow volumes were down in 2022 and capital calls significantly outnumbered distributions, particularly in the second half of the year. Reflecting their fundraising hauls and the historically fast-paced investment environment of the pandemic era, funds from vintage years 2019–21 already accounted for more than 40% of the PE index’s value at the end of 2022. The 2019 vintage was the only one among the top seven by size that earned a positive return during the year.
According to Dealogic, two USPE–backed companies went public in 2022 (including the nearly $9 billion IPO of private equity firm, TPG), with a combined value of about $22 billion. It would be an understatement to say this was a decline from 2021 given that 155 PE-backed companies went public by IPO or SPAC in that year. Contrary to public exits, PE-backed merger & acquisition (M&A) transactions in 2022 were nearly equal to those in 2021 (1,150 compared to 1,266). About 24% (or 278 deals) had publicly disclosed valuations, and, based on the data available, the average transaction size among those deals was $1.3 billion, which trailed the $1.6 billion average in 2021.
Vintage Years
As of December 2022, seven vintage years were meaningfully sized—representing at least 5% of the benchmark’s value—and, combined, accounted for 80% of the index’s value. Across the key vintages, full-year returns ranged from -8.0% (vintage 2015) to 6.1% (vintage 2019), and returns were better in the second half than in the first (Figure 2). The large weighting of vintage 2021 (with less than two years of investing under its belt) reflects both that vintage’s historic fundraising and the market’s accelerated investment pace leading into 2022.
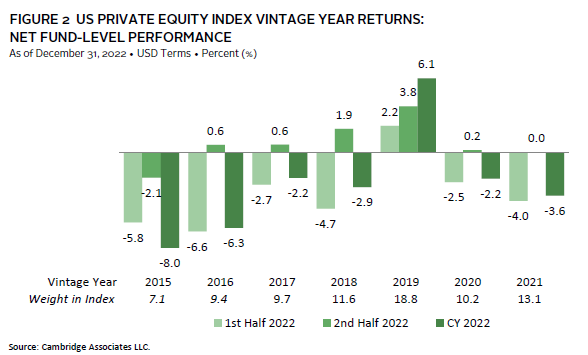
For the second consecutive year, the 2019 vintage was the top performer; write-ups were widespread with consumer staples being the only sector with significant devaluations. The 2015 vintage posted the lowest return for the year, driven primarily by write-downs in IT and healthcare. The lone bright spot for the 2015 group was industrials, which returned about 13% for the year.
LP Cashflows
In 2022, LP cash flow levels receded from the record highs of the prior year, with declines of more than 20% and almost 50% in contributions and distributions, respectively (Figure 3). The first half of the year was a more active period for distributions than the second, while contribution amounts were roughly the same in both halves. For the first year since 2010, contributions meaningfully outpaced distributions ($179 billion to $139 billion).
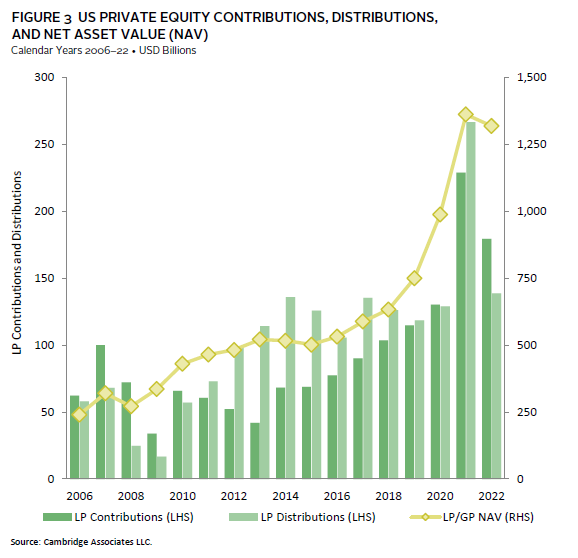
Four vintage years (2019–22), which are still in their investment periods, accounted for almost 90% ($159 billion) of the capital calls in 2022; the 2021 vintage alone called $69 billion. Seven vintage years (2012–13, 2015–19) accounted for 76% of distributions for the year; vintages 2015–17 distributed between $18 billion and $21 billion and combined represented about 43% of all.
Sectors
Figure 4 shows the Global Industry Classification Standard (GICS®) sector breakdown of the PE index and a public market counterpart, the Russell 2000® Index, which provides context when comparing the performance of the two indexes. The largest differences are in IT, where the PE index’s exposure is more than three times that of the Russell 2000® Index, and in financials, where the public index’s weight is two times larger than the PE index. The chart also highlights a sizable PE overweight in communication services and considerable underweights in energy and real estate, which are reflected in the “other” sector bucket.
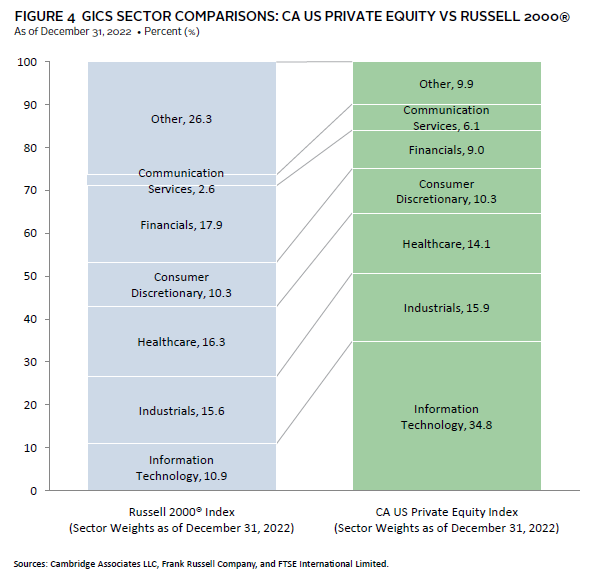
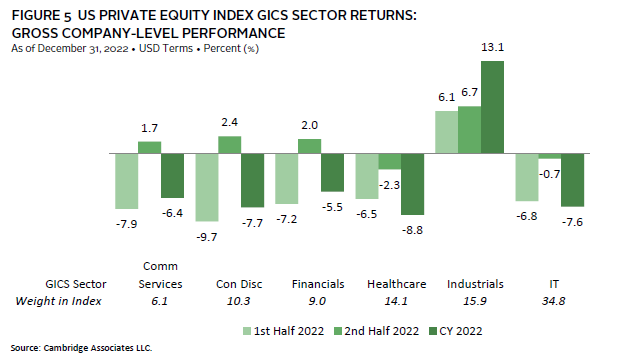
At the end of 2022, IT continued to be the largest sector (34.8%), more than twice the size of the next biggest, industrials (15.9%). Calendar year returns for the six meaningfully sized sectors were largely negative, excepting industrials, and declines were in a tight band, ranging from -8.8% for healthcare to -5.5% for financials. These returns are a stark reversal from 2021, when all six earned returns over 35%. The key sectors performed better in the second half of 2022 than in the first, with only healthcare and IT posting negative results in both halves (Figure 5). Industrial companies in virtually all vintages earned positive returns for the year, with particularly strong contributions from those in vintages 2017–19. The 2019 vintage was the only one that did not suffer losses in healthcare and IT.
In 2022, managers in the index allocated about 64% of their invested capital to three sectors, IT (28%) and healthcare and industrials (each 18%), and another quarter of the capital in roughly equal parts to financials, consumer discretionary, and communications services. Since inception of the index (1986), the first three sectors (IT, healthcare, and industrials) have attracted about 53% of capital, and the second three about 33%.
US Venture Capital Performance Insights
Following its second-best year ever in 2021, the CA US Venture Capital Index lost about 21% in 2022, marking its third-worst calendar year ever (after 2001 and 2002), while staying competitive with the public markets. Like the PE industry, venture experienced a bit of a reset with slower fundraising, investing, and exits as investor appetite for risk waned amid higher inflation, rapidly rising interest rates, a closed IPO window, and a generally unsettled macroeconomic environment.
According to the National Venture Capital Association and Pitchbook, by number, US VC managers completed about 8% fewer deals in 2022 than they did in 2021 (17,504 from 18,990), a much smaller decline than when measured by value ($247 billion from $347 billion in 2021). There was a similar story in exits, whose decline in 2022 was due largely to the massive drop in IPO and SPAC activity. While the number of exits fell about 32% from 2021 levels, the number of public listings fell by nearly 75%. When looking at the values of exits, the story is more pronounced, and the drop is about 90% overall and 95% for IPOs and SPACs combined. Notably, for the first time since 2018, the value of exits via M&A transactions eclipsed that of public listings ($38 billion versus $33 billion).
Vintage Years
As of December 31, 2022, the eight meaningfully sized vintages represented 76% of the venture index’s net asset value. Annual returns ranged from -30.0% (2014) to -5.2% (2021) and the more recent vintages significantly outperformed the older ones (Figure 6).
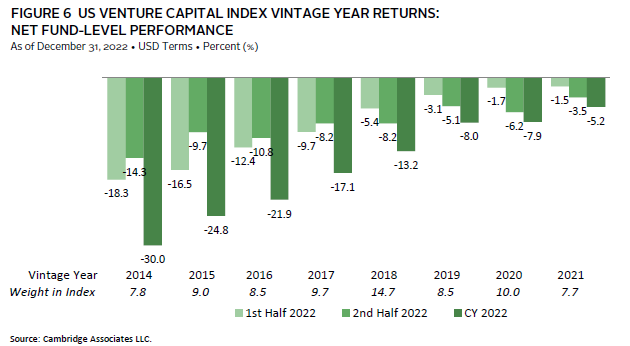
For the 2021 vintage, write-downs in industrials and financials were partially offset by write-ups in IT and healthcare companies, which to date have been the largest sector constituents in that vintage. For the worst-performing vintage year, 2014, write-downs were spread across sectors but led by investments in IT and financials. As the performance of the various vintages suggests, the “seasoned” investments in financials, healthcare, and IT were impacted the worst by public market volatility.
LP Cashflows
Following their record-setting year in 2021, LP contributions ($35 billion) and distributions ($32 billion) retreated in 2022, marking the first time since 2011 that contributions outnumbered distributions (Figure 7).
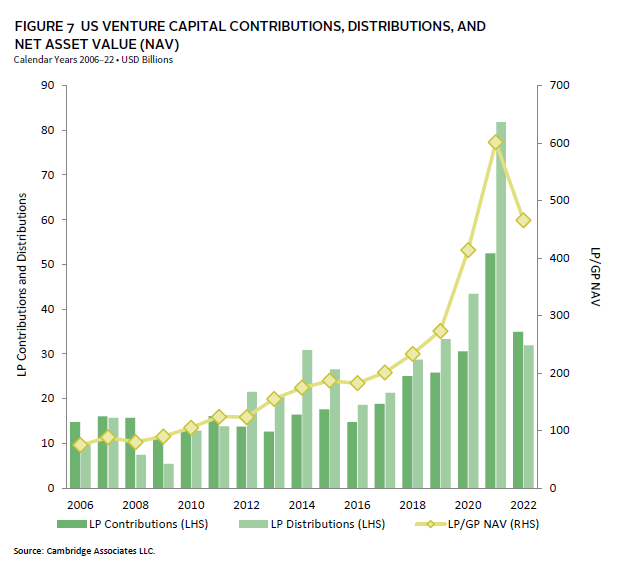
The three most recent vintage years (2020–22) issued 80% of the capital calls during the year ($28 billion in total), and for the second consecutive year, the 2021 vintage was responsible for the most calls and more than 30% of the total. The sources of distributions were more widespread, with four vintages (2006, 2014–15, and 2018) leading the way and returning at least $3.3 billion each to investors. The 2006 vintage, in its 16th year, returned almost $6 billion alone, highlighting the long-term nature of the asset class.
Sectors
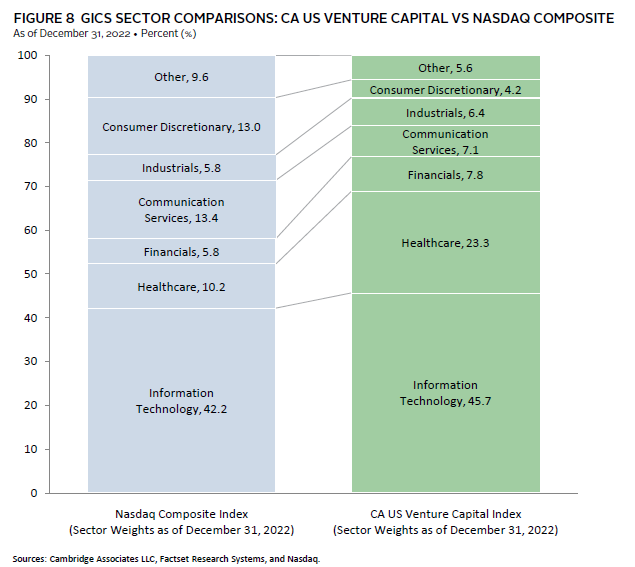
Figure 8 shows the GICS sector breakdown of the VC index and a public market counterpart, the Nasdaq Composite Index. The breakdown provides context when comparing the performance of the two indexes. The chart highlights the venture index’s meaningful overweight in healthcare and its considerable underweights in communication services and consumer discretionary. The indexes’ respective exposures to IT have grown more similar, with only 3.5% separating them, down from the 7.5% difference in 2018.
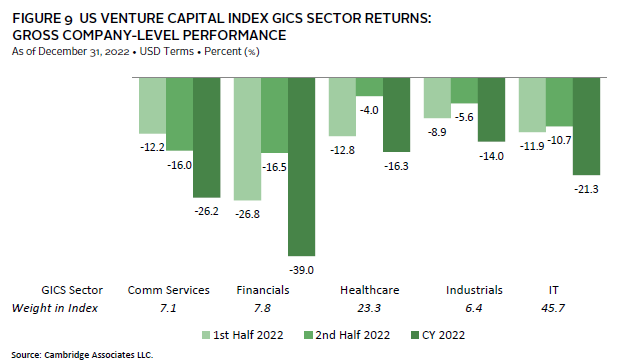
All five key sectors in the VC index posted negative results for the year, with financials earning the worst return and industrials earning the least negative of the group (Figure 9). Among the factors driving the financial sector’s results is the inclusion of fintech and cryptocurrency-related businesses, which were hit hard in 2022. As opposed to 2021 when “tech enablement” benefited a company’s performance, in 2022, it had the opposite effect. Sectors outside of IT were impacted by negative sentiment toward technology, such as fintech and crypto-related businesses, biotechnology, and some businesses in consumer discretionary and communication services.
VC managers allocated 72% of the total capital they invested to businesses in IT (40%) and healthcare (32%) and another 21% across communication services, consumer discretionary, financials, and industrials. Recent allocations by sector have been in line with long-term norms for most sectors, except for communication services, which has shifted over time from capital intensive infrastructure to internet-related businesses.
Caryn Slotsky, Senior Investment Director
Wyatt Yasinski, Associate Investment Director
Drew Carneal, Senior Investment Associate
Figure Notes
US Private Equity and Venture Capital Index Returns
Private indexes are pooled horizon internal rates of return, net of fees, expenses, and carried interest. Returns are annualized, with the exception of returns less than one year, which are cumulative. Because the US Private Equity and Venture Capital indexes are capitalization weighted, the largest vintage years mainly drive the indexes’ performance.
Public index returns are shown as both time-weighted returns (average annual compound returns) and dollar-weighted returns (mPME). The CA Modified Public Market Equivalent (mPME) replicates private investment performance under public market conditions. The public index’s shares are purchased and sold according to the private fund cash flow schedule, with distributions calculated in the same proportion as the private fund, and mPME net asset value is a function of mPME cash flows and public index returns.
Vintage Year Returns
Vintage year fund-level returns are net of fees, expenses, and carried interest.
Sector Returns
Industry-specific, gross company-level returns are before fees, expenses, and carried interest.
GICS® Sector Comparisons
The Global Industry Classification Standard (GICS®) was developed by and is the exclusive property and a service mark of MSCI Inc. and S&P Global Market Intelligence LLC and is licensed for use by Cambridge Associates LLC. “Other” includes sectors that make up less than 5% of the CA benchmark.
About the Cambridge Associates LLC Indexes
Cambridge Associates derives its US private equity benchmark from the financial information contained in its proprietary database of private equity funds. As of December 31, 2022, the database included 1,496 US buyouts and growth equity funds formed from 1986 to 2022, with an LP/GP value of $1,318 billion. Ten years ago, as of December 31, 2013, the index included 723 funds whose LP/GP value was $521 billion.
Cambridge Associates derives its US venture capital benchmark from the financial information contained in its proprietary database of venture capital funds. As of December 31, 2022, the database comprised 2,344 US venture capital funds formed from 1981 to 2022, with an LP/GP value of $466 billion. Ten years ago, as of December 31, 2013, the index included 990 funds whose LP/GP value was $155 billion.
The pooled returns represent the net end-to-end rates of return calculated on the aggregate of all cash flows and market values as reported to Cambridge Associates by the funds’ general partners in their quarterly and annual audited financial reports. These returns are net of management fees, expenses, and performance fees that take the form of a carried interest.
About the Public Indexes
The Nasdaq Composite Index is a broad-based index that measures all securities (over 3,000) listed on the Nasdaq Stock Market. The Nasdaq Composite is calculated under a market capitalization– weighted methodology.
The Russell 2000® Index includes the smallest 2,000 companies of the Russell 3000® Index (which is composed of the largest 3,000 companies by market capitalization).
The Standard & Poor’s 500 Composite Stock Price Index is a capitalization-weighted index of 500 stocks intended to be a representative sample of leading companies in leading industries within the US economy. Stocks in the index are chosen for market size, liquidity, and industry group representation.
Footnotes