For calendar year 2019, US private equity[1]The CA Private Equity Index includes US buyout and growth equity funds. and venture capital produced high double-digit returns, as indicated by the Cambridge Associates LLC benchmark indexes. The Cambridge Associates LLC US Private Equity Index® returned 18.6% and the Cambridge Associates LLC US Venture Capital Index® returned 19.3%. For both indexes, the third quarter was the weakest of the year. Despite the strong year for private equity and venture capital (PE/VC), both trailed the public markets, which were led by technology and large-cap businesses. Figure 1 depicts performance for the private asset classes compared to the public markets. Cambridge Associates’ mPME calculation is a private-to-public comparison that seeks to replicate private investment performance under public market conditions.
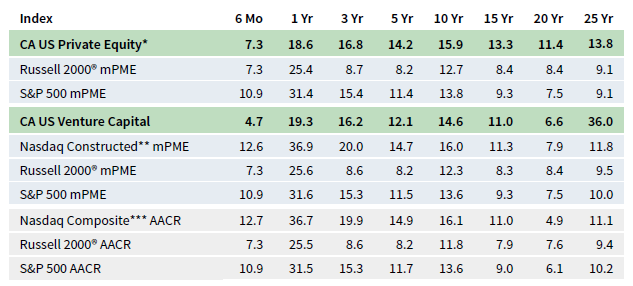
FIGURE 1 US PRIVATE EQUITY AND VENTURE CAPITAL INDEX RETURNS
Periods Ended December 31, 2019 • Percent (%)
* Includes US buyout and growth equity funds only.
** Data from 1/1/1986 to 10/31/2003 represented by the Nasdaq Price Index; data from 11/1/2003 to present by the Nasdaq Composite.
*** Capital change only.
Sources: Cambridge Associates LLC, Frank Russell Company, FTSE International Limited, Nasdaq, Standard & Poor’s, and Thomson
Reuters Datastream.
Calendar Year 2019 Highlights
- As of December 31, 2019, the private equity benchmark had outperformed the public indexes in all time periods, except for the most recent six-month and one-year periods. Despite double-digit performance in nearly all time periods longer than one year, the venture capital index had mixed success against the various public market indexes. The US venture capital index’s struggle to beat the NASDAQ composite reflects, at least in part, the extremely strong performance of public IT companies in 2019.
- Public companies accounted for a higher percentage of the venture capital index (almost 15%) than of the private equity index (less than 10%) at year-end 2019. Non-US company exposures have remained stable at approximately 18% and 11% of the US private equity and venture capital benchmarks, respectively, as of December 31, 2019.
- In 2019, among the largest sectors, information technology (IT) was the best- performing in US private equity and consumer discretionary was the worst. In US venture capital, healthcare nosed out IT for the top spot and industrials brought up the rear.
US Private Equity Performance Insights
Amid a healthy economy and continued low interest rates, public equities rebounded strongly in 2019, particularly in the first and fourth quarters. During the year, large-cap stocks outpaced small and in both the Russell 2000® and the S&P 500 indexes; the IT sector led the way. Large banks also performed well. The tech-heavy NASDAQ Composite outperformed other public indexes. With its return of nearly 19%, the US private equity benchmark extended its streak of double-digit calendar year returns to 11 (2009–19). At year end, 13 vintage years (2006–18) encompassed nearly all the index’s value; all but one (2018) posted annual results of at least 10.9%.
According to Dealogic, 33 private equity–backed companies went public in 2019 with a combined value of $15.6 billion. The year’s largest initial public offering (IPO) was Avantor Inc. (chemicals) in May 2019. By number and by value, 2019 was less active than the previous year for PE-backed IPOs, though by value the shortfall was small. About 75% of the year’s IPOs took place in technology, finance, or healthcare (which represented three of the four sectors that dominated 2017 and 2018 activity), but they only represented about 62% of the value. There were almost 60 more PE–backed merger & acquisition (M&A) transactions in 2019 than there were in 2018 (928 versus 871), with 23% (or 213 deals) having valuations disclosed to the public. Based on publicly available data, the average transaction size among those deals was $1.0 billion, driven up by the higher than average deal size in the second quarter ($1.5 billion compared with $901 million in the other three quarters). The number of M&A transactions in 2019 was higher than in each of the previous six years; the average over that period (2013–18) was 749 deals per year.
Vintage Years
As of December 2019, eight vintage years were meaningfully sized—representing at least 5% of the benchmark’s value—and, combined, accounted for 84% of the index’s value. From low to high, the weightings ranged from 6.5% for the youngest vintage year, 2017 to 15.5% for vintage year 2014 (Figure 2). The 2017 vintage’s weighting was largely a result of its being the most active vintage for capital calls during the year (that vintage accounted for 23% of all called capital). Notably, the 13-year-old 2007 vintage remains meaningfully sized.
For the year, all eight large vintages produced double-digit returns, ranging from 10.9% (2007) to 28.6% (2016). IT companies were the strongest drivers of positive returns for the best- and worst-performing vintages. Healthcare, industrials, and IT accounted for 83% of the write-ups for vintage year 2016 funds, with IT alone accounting for 47% of the valuation increases. Vintage year 2017’s performance suffered from a poor second half (a mere 0.6% return). Its annual return was propped up by IT in the first half and pulled down by significant second half write-downs in energy.
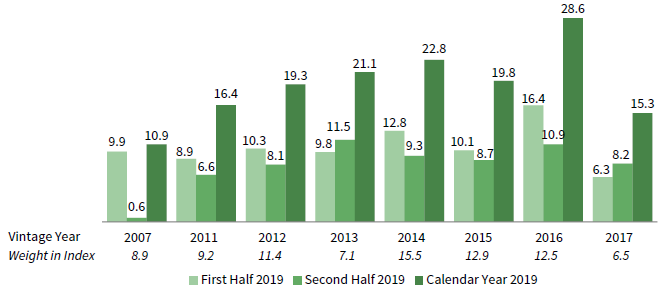
FIGURE 2 US PRIVATE EQUITY INDEX VINTAGE YEAR RETURNS:
NET FUND–LEVEL PERFORMANCE
As of December 31, 2019 • USD Terms • Percent (%)
Source: Cambridge Associates LLC.
Sectors
Figure 3 shows the GICS sector breakdown of the CA private equity index and a public market counterpart, the Russell 2000® Index. The breakdown provides context when comparing the performance of the private and public indexes. The chart highlights the most significant differences between the private equity and public indexes, namely private equity’s IT overweight (31.3% versus 13.4%) and financials underweight (8.6% versus 17.7%). Buried in the “other” category is another private equity underweight, real estate. In this edition of the commentary, Figure 3 also includes the sector weightings from December 2007, the period leading into the Global Financial Crisis (GFC) to enable a comparison with the sector breakdown heading into the COVID-19 crisis. The most notable changes in the private equity index are a significant increase in IT and corresponding decreases in communication services and consumer discretionary.
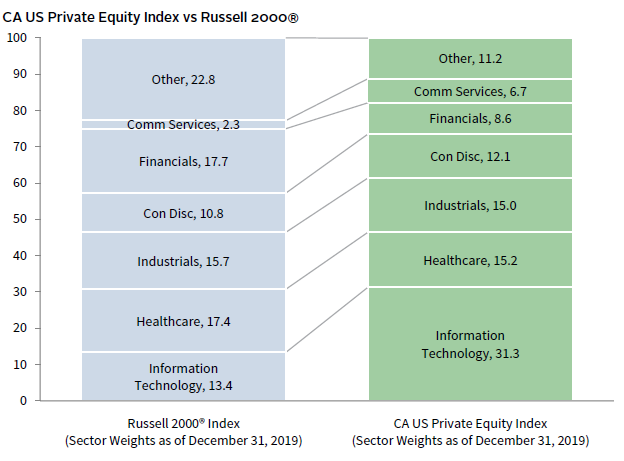
FIGURE 3 GICS SECTOR COMPARISONS
Percent (%)

Sources: Cambridge Associates LLC.
IT company write-ups were strong for the year and consistent across all meaningful vintages, with six different years, 2007, 2011–12, and 2014–16, producing north of $4 billion in valuation increases (Figure 4). Among the meaningful sectors, consumer discretionary was the worst performer during 2019, finishing the year with a 10.7% return. In the sector, vintages 2002–08 saw negative returns for the year, but the average return for 2009–16 vintages was 18.7%, which boosted the sector’s annual return. The four largest sectors (IT, healthcare, industrials, and consumer discretionary) earned a gross return of 24.6% for the year, outperforming the other sectors in the benchmark by more than 10%. Although not considered to be meaningfully sized, energy was the only sector with a negative return in 2019, and the worst performer by a significant margin.
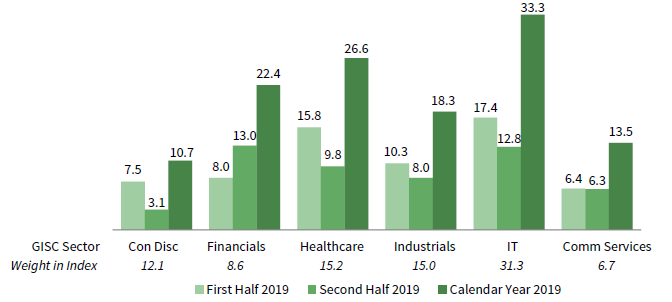
FIGURE 4 US PRIVATE EQUITY INDEX GICS SECTOR RETURNS:
NET FUND–LEVEL PERFORMANCE
As of December 31, 2019 • USD Terms • Percent (%)
Source: Cambridge Associates LLC.
LP CASH FLOWS
During 2019, managers in the US private equity index called $99.3 billion from limited partners (LPs), the fourth consecutive year of capital call increases and a close second to 2007 for the highest annual amount ever (Figure 5). Distributions totaled $115.4 billion for the year, the seventh in a row that distributions eclipsed $100 billion. Heading into the COVID-19 crisis, distributions outpaced contributions nine years straight (2011–19) but the cycle is expected to turn in 2020. As seen during the GFC, both contributions and distributions decreased from levels in the years leading up to the crisis. For a long-term perspective, of the $1.2 trillion called and $1.5 trillion distributed from March 1986 through December 2019, more than half of the calls and two-thirds of the distributions occurred in the last nine years ($643 billion in LP contributions and $1.02 trillion in LP distributions).
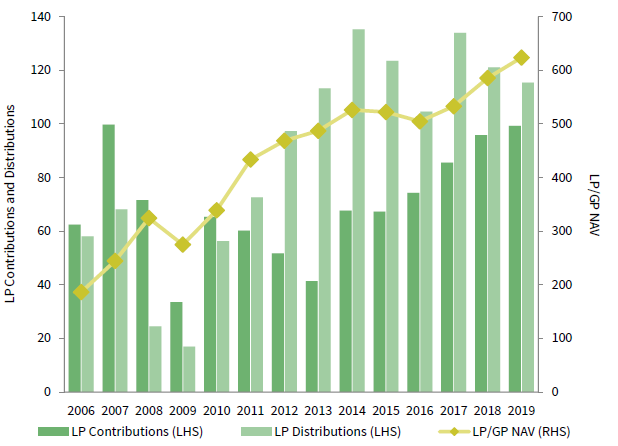
FIGURE 5 US PRIVATE EQUITY CONTRIBUTIONS, DISTRIBUTIONS,
AND NET ASSET VALUE (NAV)
Source: Cambridge Associates LLC.
Funds formed from 2014 to 2018 called $88 billion, or 89% of the total contributions in 2019, and investors in 2017 vintage funds alone paid just shy of $23 billion in capital calls, the most of any vintage year. Conversely, vintages 2011–15 accounted for more than half of the total distributions during the year but the 2007 funds continued to lead, exceeding $18 billion in distributions for the year.
US Venture Capital Performance Insights
The CA US venture capital index returned 19.3% in 2019, and despite the strong absolute performance, it substantially underperformed the returns of the public markets. The index’s 2019 performance was slightly stronger than that of 2018, when the benchmark returned 18.1%. Communication services, healthcare, and IT were the largest sectors of the index and, along with a strong performance in financials, were the drivers of the benchmark’s return. While 2019 fundraising, investment pace (in terms of dollars invested), and PE-backed buyouts dipped slightly from 2018, cash flows in and out of venture managers, M&A exit activity, and IPOs (based on value) saw increases from the prior year. Return data are not finalized yet, but preliminary reports suggest that first quarter 2020 was a down quarter and given the COVID-19 crisis, the year may prove to be a turbulent one for financial markets.
According to the National Venture Capital Association and Pitchbook, deal flow declined in the second half of 2019 compared to the first half, but investment activity for the year was comparable to 2018, with a higher number of deals completed in 2019 but at a slightly smaller dollar amount ($140.8 billion in 2018 compared to $136.1 billion in 2019). Exit activity, measured by IPOs, M&A, and PE buyouts was strong in 2019. While total exits (by deal count) decreased slightly year over year, the dollar value of exits in 2019 more than doubled that of 2018. The record $265.0 billion of exits was driven by the IPOs of several large technology companies, including Uber, Lyft, and Slack. In total, the 82 IPOs in 2019 were valued at $197.2 billion, down slightly in number from the 88 in 2018 but more than triple the value. By count, annual venture-backed M&A transactions dipped from 750 to 710 from 2018 to 2019, but at a value of $61.4 billion, 2019 surpassed 2018 by $1.1 billion. Finally, sales to financial buyers (PE buyouts) saw a modest reduction in both count and value, declining from 207 deals valued at $6.8 billion in 2018 to 193 deals valued at $6.5 billion in 2019.
Vintage Years
Despite its robust calendar year results, the venture capital index underperformed public equities. For the year, returns among the ten meaningfully sized vintage years, 2007–08, 2010, and 2011–17, ranged from 7.1% (2010) to 31.0% (2017). Nine of the ten large vintages—2007–08 and 2011–17—posted double-digit returns, and of this group eight posted returns above 15.0% (Figure 6); combined, the ten accounted for 82% of the index’s value.
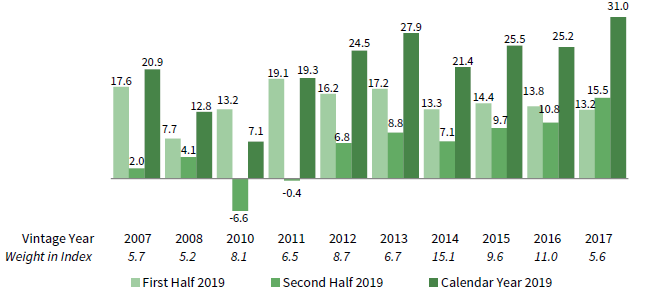
FIGURE 6 US VENTURE CAPITAL INDEX VINTAGE YEAR RETURNS:
NET FUND–LEVEL PERFORMANCE
Source: Cambridge Associates LLC.
Following recent trends, the performance of the best-performing vintage (2017) was driven by write-ups in IT and healthcare. These two sectors were by far the biggest drivers of annual performance, as valuations increased by more than $1.2 billion in each sector during the second half alone. IT company valuation changes were the primary drivers of the annual returns for all meaningfully sized vintage years except 2008 and 2013, where healthcare led the way. Valuation increases in the lowest performer, 2010, were again driven by IT and healthcare companies, but write-downs in real estate pulled down the overall return.
Sectors
Figure 7 shows the GICS sector breakdown of the venture capital index and a public market counterpart, the Nasdaq Composite Index. The breakdown provides context when comparing the performance of the two indexes. The chart highlights the venture index’s meaningful overweight in healthcare, and to a lesser extent IT, as well as its considerable underweights in communication services and consumer discretionary. Notably, the gap between public and private IT exposure has narrowed significantly, from 7.5% at the end of 2018 to 1.3% at the end of 2019. The smaller difference is due, at least in part, to the extremely strong 2019 performance of public IT companies. Like Figure 3 in the USPE section of this commentary, Figure 7 also includes the sector weightings from December 2007 to allow for comparisons with the pre-GFC period. Notably, the US venture capital index has become somewhat less concentrated over time, with the communication services, healthcare, and IT sectors all seeing a decrease in exposure.

FIGURE 7 GICS SECTOR COMPARISONS
Percent (%)
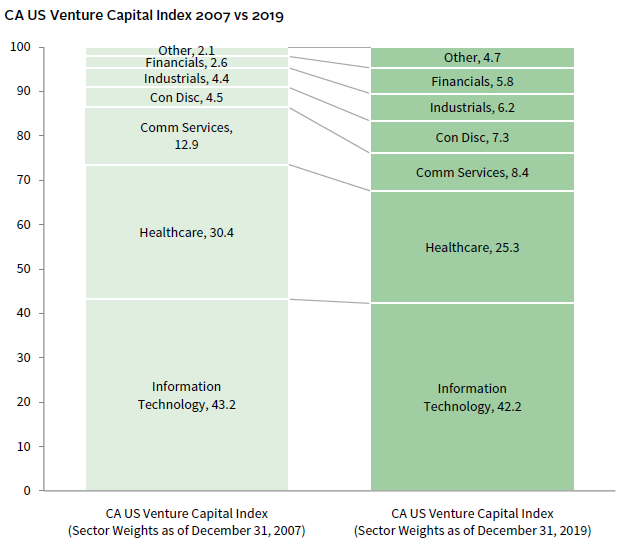
Sources: Cambridge Associates LLC, Nasdaq, and Factset Research Systems.
Since the end of 2018, two additional sectors have become meaningfully weighted within the venture capital benchmark: healthcare, IT, communication services, and consumer discretionary are now joined by industrials and financials (in rank order). Combined, the large sectors accounted for more than 95% of the index’s value at the close of 2019 (Figure 8). Additionally, almost 95% of capital invested during 2019 went into companies in these sectors. Two of the six, healthcare and IT, together accounted for 72% of invested capital, in line with the long-term average. Among the key sectors, healthcare performed best in 2019, returning 30.9%.
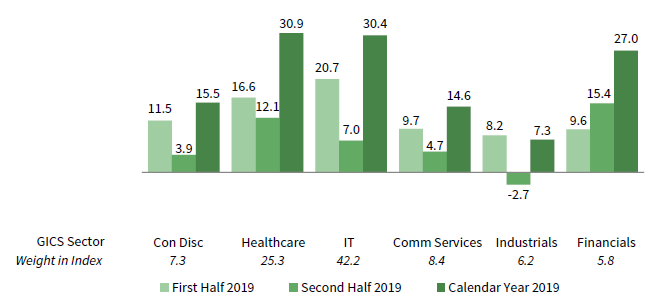
FIGURE 8 US VENTURE CAPITAL INDEX GICS SECTOR RETURNS:
GROSS COMPANY–LEVEL PERFORMANCE
As of December 31, 2019 • USD Terms • Percent (%)
Source: Cambridge Associates LLC.
For the year, healthcare performance was driven by write-ups in vintages 2005–08, 2010, and 2013–17, with an average of more than $1.2 billion for each vintage. Among the other key sectors, IT companies in vintages 2005, 2007, and 2010–17 were written up by greater than $1.0 billion, with 2007, 2011–12, and 2014–16 having valuation increases greater than $2.2 billion. The communication services return was driven by write-ups of $150 million or more in 2005, 2007, and 2013–17, including the increase of more than $900 million in 2014, while consumer discretionary valuations increased in vintages 2010, 2012, and 2014–16. In the industrials sector, vintages 2014 and 2016 each saw write-ups of greater than $200 million, while in financials, the bulk of the valuation increases came from vintages 2013–16, with an average of more than $550 million per vintage.
LP Cash Flows
Managers in the US venture capital index called and distributed more capital in 2019 than they did in 2018 (Figure 9). Contributions were just slightly above 2018 levels, at $22.8 billion, while distributions increased 13% to $33.1 billion, making 2019 the eighth straight year that more capital was distributed than called. At this level, 2019 distributions are second only to those in 2000 for the highest annual amount in the index’s history. While the difference between distributions and contributions narrowed slightly in second half 2019 compared to first half, the full year difference widened 57% compared to the 2018 figure, a trend that mirrors the overall pattern of increasing distributions.
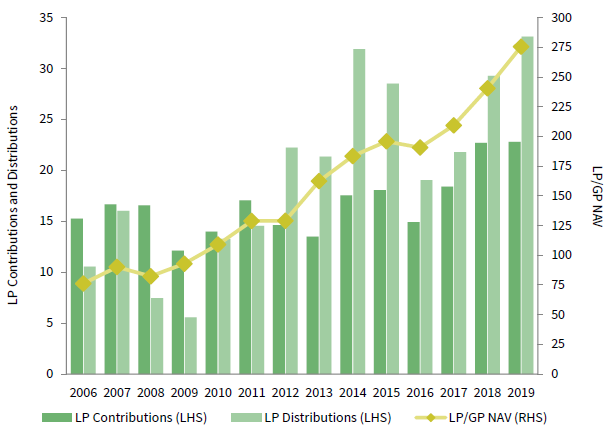
FIGURE 9 US VENTURE CAPITAL CONTRIBUTIONS, DISTRIBUTIONS, AND NAV
Calendar Years 2006–19 • USD Billions
Source: Cambridge Associates LLC.
Funds formed from 2016 to 2019 were responsible for 82% ($18.8 billion) of the total capital called during 2019. Each of these four vintage years each called more than $2.2 billion; the 2018 vintage led the way with capital calls of more than $7.2 billion. Distributions from vintage years 2005–08, 2010, and 2012–14 totaled $24.8 billion, representing almost 75% of the total of the semi-annual period. These eight vintages distributed an average of about $3.1 billion for the year, and the two vintage years with the largest distributions, 2007 and 2010, accounted for 25% of all distributions over the year.
Caryn Slotsky, Senior Investment Director
Wyatt Yasinski, Investment Associate
Drew Carneal, Investment Analyst
Figure Notes
US Private Equity and Venture Capital Index Returns
Private indexes are pooled horizon internal rates of return, net of fees, expenses, and carried interest. Returns are annualized, with the exception of returns less than one year, which are cumulative. Because the US private equity and venture capital indexes are capitalization weighted, the largest vintage years mainly drive the indexes’ performance.
Public index returns are shown as both time-weighted returns (average annual compound returns) and dollar-weighted returns (mPME). The CA Modified Public Market Equivalent replicates private investment performance under public market conditions. The public index’s shares are purchased and sold according to the private fund cash flow schedule, with distributions calculated in the same proportion as the private fund, and mPME net asset value is a function of mPME cash flows and public index returns.
Vintage Year Returns
Vintage year fund-level returns are net of fees, expenses, and carried interest.
Sector Returns
Industry-specific gross company-level returns are before fees, expenses, and carried interest.
GICS Sector Comparisons
The Global Industry Classification Standard (GICS®) was developed by and is the exclusive property and a service mark of MSCI Inc. and S&P Global Market Intelligence LLC and is licensed for use by Cambridge Associates LLC. The public index exposures are as of December 31, 2019, and represent the index’s sector breakdown after the GICS® reclassification that went into effect after close of business (ET) September 28, 2018. Cambridge Associates LLC implemented the GICS® reclassification for private companies with the release of September 30, 2018 benchmark data. “Other” includes sectors that make up less than 5% of the CA benchmark.
About the Cambridge Associates LLC Indexes
Cambridge Associates derives its US private equity benchmark from the financial information contained in its proprietary database of private equity funds. As of December 31, 2019, the database included 1,186 US buyouts and growth equity funds formed from 1986 to 2019, with a value of $710 billion. Ten years ago, as of December 31, 2009, the index included 740 funds whose value was $335 billion.
Cambridge Associates derives its US venture capital benchmark from the financial information contained in its proprietary database of venture capital funds. As of December 31, 2019, the database comprised 1,942 US venture capital funds formed from 1981 to 2019, with a value of $276 billion. Ten years ago, as of December 31, 2009, the index included 1,305 funds whose value was $93 billion.
The pooled returns represent the net end-to-end rates of return calculated on the aggregate of all cash flows and market values as reported to Cambridge Associates by the funds’ general partners in their quarterly and annual audited financial reports. These returns are net of management fees, expenses, and performance fees that take the form of a carried interest.
About the Public Indexes
The Nasdaq Composite Index is a broad-based index that measures all securities (more than 3,000) listed on the Nasdaq Stock Market.
The Nasdaq Composite is calculated under a market capitalization–weighted methodology.
The Russell 2000® Index includes the smallest 2,000 companies of the Russell 3000® Index (which is composed of the largest 3,000 companies by market capitalization).
The Standard & Poor’s 500 Composite Stock Price Index is a capitalization-weighted index of 500 stocks intended to be a representative sample of leading companies in leading industries within the US economy. Stocks in the index are chosen for market size, liquidity, and industry group representation.
Footnotes