Overview
Over the first nine months of 2017, US private equity quarterly returns were more consistent than those for US venture capital, as indicated by the Cambridge Associates LLC benchmark indexes of the two alternative asset classes. In third quarter 2017, the Cambridge Associates LLC US Private Equity Index® returned 3.9%, matching or beating the previous two quarters to bring its year-to-date return to 11.7%. The Cambridge Associates LLC US Venture Capital Index® returned 3.2% for third quarter, an increase from a weak second quarter; the venture index’s year-to-date performance was 8.1%. In the public markets, the Russell 2000® (small cap) and the tech-heavy Nasdaq outperformed the S&P 500 during the quarter. Figure 1 depicts performance for the private asset classes compared to the public markets. Cambridge Associates’ mPME calculation is a private-to-public comparison that seeks to replicate private investment performance under public market conditions.
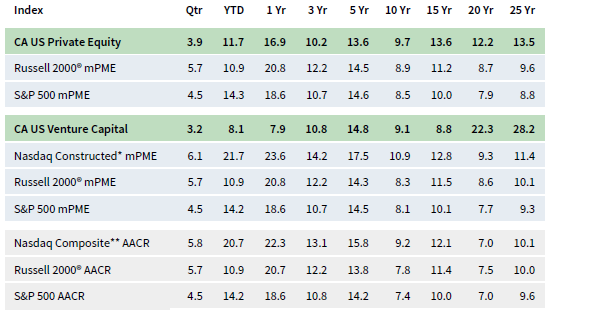
FIGURE 1 US PRIVATE EQUITY AND VENTURE CAPITAL INDEX RETURNS
Periods Ended September 30, 2017 • Percent (%)
Sources: Cambridge Associates LLC, Frank Russell Company, Standard & Poor’s, and Thomson Reuters Datastream.
Notes: Private indexes are pooled horizon internal rates of return, net of fees, expenses, and carried interest. Returns are annualized, with the exception of returns less than one year, which are cumulative. Because the US Private Equity and Venture Capital indexes are capitalization weighted, the largest vintage years mainly drive the indexes’ performance. Public index returns are shown as both time-weighted returns (average annual compound returns) and dollar-weighted returns (mPME). The CA Modified Public Market Equivalent replicates private investment performance under public market conditions. The public index’s shares are purchased and sold according to the private fund cash flow schedule, with distributions calculated in the same proportion as the private fund, and mPME net asset value is a function of mPME cash flows and public index returns.
* Constructed Index: Data from 1/1/1986 to 10/31/2003 represented by Nasdaq Price Index. Data from 11/1/2003 to present represented by Nasdaq Composite.
** Capital change only.
Third Quarter 2017 Highlights
- As of September 30, 2017, the private equity benchmark had limited success against the indexes tracking both large and small public companies in the time periods from one quarter to trailing five years; it outperformed the public markets in all time periods of ten years and longer. By and large, the venture capital index has struggled to beat public indexes on an mPME basis in any time period other than the longest ones listed in Figure 1.
- Public companies accounted for between 12% and 13% of both the private equity and venture capital indexes. Non-US company exposures in the private equity and venture capital indexes have remained fairly steady, sitting at about 17% in the private equity benchmark and a bit more than 8% in the venture capital index as of September 30, 2017.
Private Equity Performance Insights
- By the end of third quarter 2017, eight vintage years each represented at least 5% of the benchmark’s value and, combined, accounted for 83% of the index’s value. Returns among the meaningfully sized vintages were more widely dispersed this quarter than the last, ranging from 2.4% for the 2006 vintage to 6.4% for the 2012 vintage (Figure 2). Four other vintage years—2005, 2009–10, and 2016—represented between 3.1% and 4.6% of the benchmark (for a total of more than 14%). Pre–global financial crisis funds (2005–07), which distributed nearly $15 billion to investors in third quarter, still accounted for 27% of the index at September 30, while post-crisis funds (those raised from 2010 to 2012) accounted for about 30% of the index.
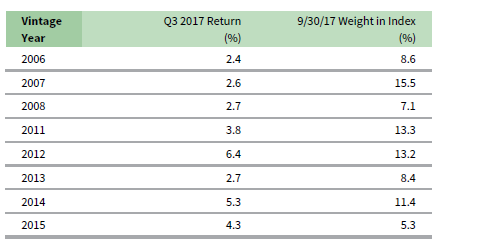
FIGURE 2 PRIVATE EQUITY VINTAGE YEAR RETURNS:
NET FUND-LEVEL PERFORMANCE
Note: Vintage year fund-level returns are net of fees, expenses, and carried interest.
- Industrials and IT saw the largest valuation increases in both the best- and worst-performing large vintage years. In the largest vintage, 2007, health care was the stand-out sector.
- Fund managers called $32.6 billion in third quarter, a 22.1% increase from the previous one, while they distributed $36.5 billion, an 11.2% quarter-over-quarter decrease. Over the last seven years, distributions have outpaced contributions in 25 of 28 quarters for a distributions/contributions ratio of 1.5. In the preceding six years (2005–10), contributions outnumbered distributions at a ratio of 1.4. It would not be surprising if the cash flow pendulum began to swing back toward capital calls.
- Seven vintage years (2007 and 2011–16) called more than $1.0 billion each (ranging from $1.0 billion to $10.0 billion) for a total of $32.2 billion, or virtually all the capital called in the quarter; the 2014 vintage called the most capital. Eleven vintages (2004–14) each distributed at least $1.2 billion, for a total of $35.2 billion. Of those distributing the most capital, four vintages, 2006–08 and 2011, stand out because they all distributed more than $3.9 billion and represented 57% of the total distributed during the quarter.
- Figure 3 shows the GICS sector breakdown of the private equity index and a public market counterpart, the Russell 2000® Index. The breakdown provides context when comparing the performance of the two indexes. The chart highlights the private equity index’s relative overweights in energy, IT, and consumer discretionary, and the significant underweight in financials.
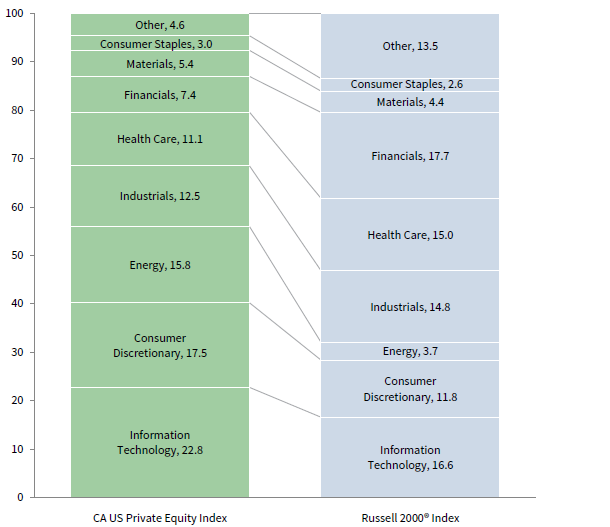
FIGURE 3 GICS SECTOR COMPARISONS: CA US PRIVATE EQUITY VS RUSSELL 2000®
As of September 30, 2017 • Percent (%)
Note: Other includes sectors that individually make up less than 2% of the CA benchmark.
- During the quarter, all seven large sector index components earned positive returns (Figure 4); returns ranged from 1.9% (consumer discretionary) to 7.8% (health care). Four of the seven sectors—health care, industrials, materials, and IT (in rank order)—rose more than 6.4%. Vintage year 2007 contributed most to the health care sector’s strong return, while most vintages had more middling performance (both positive and negative) in the consumer discretionary sector.
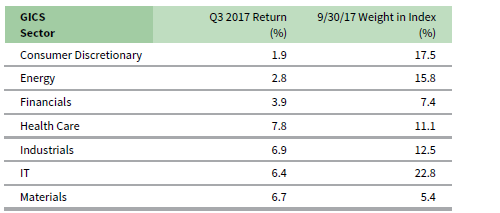
FIGURE 4 PRIVATE EQUITY GICS SECTORS RETURNS:
NET FUND-LEVEL PERFORMANCE
Note: Industry-specific gross company-level returns are before fees, expenses, and carried interest.
- Five sectors—IT, consumer discretionary, energy, health care, and industrials—combined to attract 90% of the capital invested during the quarter. IT (24%), consumer discretionary (20%), and energy (20%) companies led all others. Over the long term, the five sectors have garnered 76% of the capital invested. Driving the difference between the quarter and the long-term norm are the high allocations to IT, energy, and health care and the lower than historical allocation to industrials and financials, the latter of which saw inflows at less than half its long-term pace.
Venture Capital Performance Insights
- Nine of the ten meaningfully sized vintage years earned positive returns in third quarter 2017 (Figure 5). The lone vintage to post a negative return was 2008. Four of the large vintages—2010, 2011, 2013, and 2014—saw returns exceed 5%. Third quarter performance rebounded from the previous quarter, when only two of the nine key vintages posted returns greater than 3%. This quarter was the first time the 2015 vintage joined the group of meaningfully sized vintage years, crossing the 5% weight threshold.
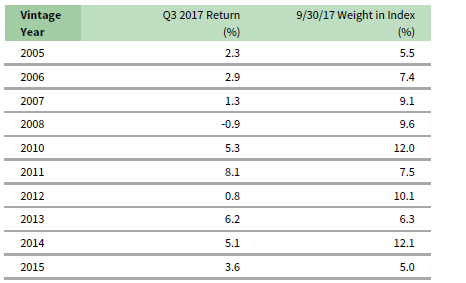
FIGURE 5 VENTURE CAPITAL VINTAGE YEAR RETURNS:
NET FUND-LEVEL PERFORMANCE
Note: Vintage year fund-level returns are net of fees, expenses, and carried interest.
- IT company valuation changes were the primary drivers of the quarterly returns for the best-performing vintage year, 2011, as well as the largest vintage, 2014. The 2014 group of funds also saw significant write-ups in health care, which contributed to its 5.1% quarterly gain. As for the worst-performing vintage year, 2008, health care companies drove the negative return; however, the poor performance was slightly offset by valuation increases in consumer discretionary. For the 2010 vintage, the index’s second largest and one of its best performers, performance was driven by a number of sectors.
- Venture capital fund managers called $4.3 billion from investors during the third quarter, a 2.6% decrease from the previous one, but the seventh highest over the past five years (20 quarters). Distributions from venture funds were $5.7 billion, a 25.8% increase from the second quarter in which the amount distributed was among the lowest quarterly outputs since 2012. Third quarter distributions were much more in line with the five-year average.
- Funds formed from 2014 to 2016 were responsible for 81% ($3.5 billion) of the total capital called during the quarter. The three vintage years each called more than $900 million; the 2014 and 2016 vintages had capital calls of more than $1.1 billion. Distributions from vintage years 2004–12 totaled $4.8 billion, representing almost 83% of the total from the quarter. All nine vintages distributed over $300 million, with four distributing over $600 million.
- Figure 6 shows the GICS sector breakdown of the venture capital index and a public market counterpart, the Nasdaq Composite Index. The breakdown provides context when comparing the performance of the two indexes. The chart highlights the venture index’s relative overweights in health care and IT, and its considerable underweights in consumer discretionary and financials.
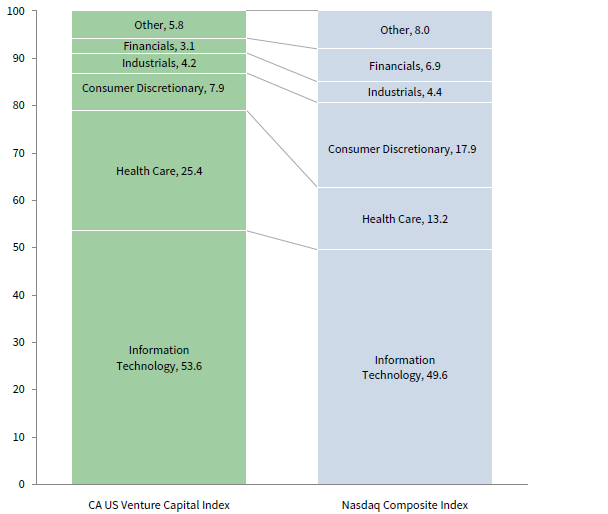
FIGURE 6 GICS SECTOR COMPARISONS: CA US VENTURE CAPITAL VS NASDAQ COMPOSITE
As of September 30, 2017 • Percent (%)
Note: Other includes sectors that individually make up less than 2% of the CA benchmark.
- All three sectors that represented at least 5% of the value of the index had positive returns in third quarter (Figure 7). Health care extended its streak to its third consecutive quarter of earning the best return, while IT posted the lowest return, a mediocre 1.9%. The health care return was mostly driven by write-ups in the 2010, 2013, 2003, and 2014 vintage year funds (in rank order) which, combined, represented almost 67% of the sector’s net appreciation change. Consumer discretionary valuations were driven mostly by 2005, 2008, and 2006 (in rank order). As noted earlier, IT was the lowest returning sector where the strongest-performing vintages, 2013 and 2014, were slightly offset by the 2000 vintage year, which accounted for 58% of the sector’s net appreciation.
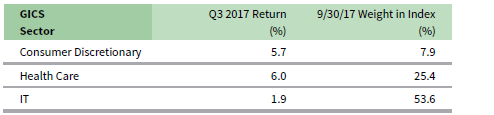
FIGURE 7 VENTURE CAPITAL VINTAGE YEAR RETURNS:
NET FUND-LEVEL PERFORMANCE
Note: Industry-specific gross company-level returns are before fees, expenses, and carried interest.
- During third quarter, venture capital managers in the index allocated the lion’s share of their investments to IT, health care, financials, and consumer discretionary companies (in rank order). Compared with long-term norms, 3.3% more capital was invested in financials while 2.6% less was invested in consumer discretionary. Health care and IT were about in line with their historical norms. At about 86% of capital invested, the amount is 1.4% less than the long-term trend for the three meaningfully size sectors combined.
About the Cambridge Associates LLC Indexes
Cambridge Associates derives its US private equity benchmark from the financial information contained in its proprietary database of private equity funds. As of September 30, 2017, the database comprised 1,421 US buyouts, private equity energy, growth equity, and subordinated capital funds formed from 1986 to 2017, with a value of $704 billion. Ten years ago, as of September 30, 2007, the index included 825 funds whose value was $330 billion.
Cambridge Associates derives its US venture capital benchmark from the financial information contained in its proprietary database of venture capital funds. As of September 30, 2017, the database comprised 1,762 US venture capital funds formed from 1981 to 2017, with a value of $203 billion. Ten years ago, as of September 30, 2007, the index included 1,232 funds whose value was $89 billion.
The pooled returns represent the net end-to-end rates of return calculated on the aggregate of all cash flows and market values as reported to Cambridge Associates by the funds’ general partners in their quarterly and annual audited financial reports. These returns are net of management fees, expenses, and performance fees that take the form of a carried interest.
About the Public Indexes
The Nasdaq Composite Index is a broad-based index that measures all securities (over 3,000) listed on the Nasdaq Stock Market. The Nasdaq Composite is calculated under a market capitalization–weighted methodology.
The Russell 2000® Index includes the smallest 2,000 companies of the Russell 3000® Index (which is composed of the largest 3,000 companies by market capitalization).
The Standard & Poor’s 500 Composite Stock Price Index is a capitalization-weighted index of 500 stocks intended to be a representative sample of leading companies in leading industries within the US economy. Stocks in the index are chosen for market size, liquidity, and industry group representation.