Overview
Second quarter 2017 US private equity performance was quite strong, while US venture capital performance was more middling, as indicated by the Cambridge Associates LLC benchmark indexes of the two alternative asset classes. The Cambridge Associates LLC US Private Equity Index® returned 3.6%, roughly in line with its first quarter performance of 3.9%, bringing its return for the first half of 2017 to 7.6%. The Cambridge Associates LLC US Venture Capital Index® returned 1.4%, a drop from a stronger first quarter; for the first six months of the year US venture capital returned 4.7%. In the public markets, the quarter was a better period for large caps than small, and the tech-heavy Nasdaq outperformed the broader indexes. Figure 1 depicts performance for the private asset classes compared to the public markets. Cambridge Associates’ mPME calculation is a private-to-public comparison that seeks to replicate private investment performance under public market conditions.
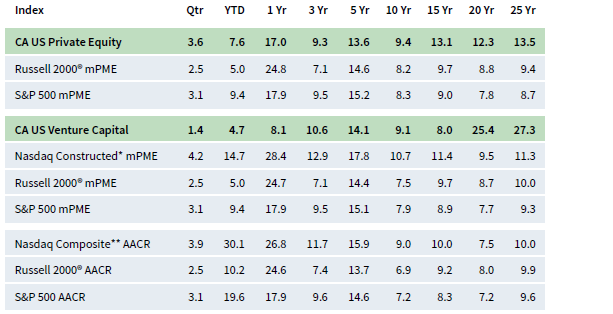
FIGURE 1 US PRIVATE EQUITY AND VENTURE CAPITAL INDEX RETURNS
Periods Ended June 30, 2017 • Percent (%)
Sources: Cambridge Associates LLC, Frank Russell Company, Standard & Poor’s, and Thomson Reuters Datastream.
Notes: Private indexes are pooled horizon internal rates of return, net of fees, expenses, and carried interest. Because the US Private Equity and Venture Capital indexes are capitalization weighted, the largest vintage years mainly drive the indexes’ performance. Public index returns are shown as both time-weighted returns (average annual compound returns) and dollar-weighted returns (mPME). The CA Modified Public Market Equivalent replicates private investment performance under public market conditions. The public index’s shares are purchased and sold according to the private fund cash flow schedule, with distributions calculated in the same proportion as the private fund, and mPME net asset value is a function of mPME cash flows and public index returns.
* Constructed Index: Data from 1/1/1986 to 10/31/2003 represented by Nasdaq Price Index. Data from 11/1/2003 to present represented by Nasdaq Composite.
** Capital change only.
Second Quarter 2017 Highlights
- As of June 30, 2017, the private equity benchmark had mixed success against the indexes tracking both large and small public companies in the time periods from one quarter to trailing five years; it outperformed the public markets in all time periods of ten years and longer. Similarly, the venture capital index has only bested all public indexes in the longest time periods listed in the table, struggling, in particular, against the Nasdaq over time periods shorter than 20 years.
- Public companies accounted for about 13% of the private equity index, as well as the venture capital index. Non-US company exposures in the private equity and venture capital indexes have remained fairly steady, sitting at roughly 17% in the private equity benchmark and about 8% in the venture capital index as of June 30, 2017.
Private Equity Performance Insights
- As of second quarter 2017, seven vintage years represented at least 5% of the benchmark’s value and, combined, accounted for 78% of the index’s value. Returns among the meaningfully sized vintages fell within a fairly tight band, ranging from 2.6% for vintage year 2012 to 4.0% for vintage year 2014 (Figure 2). Four other vintage years—2005, 2009–10, and 2015—represented between 3.5% and 4.9% of the benchmark (for a total of nearly 17%). Performance for these vintages was more widely spread, ranging from 0.4% (2010) to 12.3% (2009). By mid-2017, the funds raised in the years leading up to the global financial crisis (2005–07) and those raised in the wake of the crisis (2010–12) both accounted for about 30% of the index.

FIGURE 2 PRIVATE EQUITY VINTAGE YEAR RETURNS:
NET FUND-LEVEL PERFORMANCE
Note: Vintage year fund-level returns are net of fees, expenses, and carried interest.
- IT produced strong gains for the best-performing large vintage, 2014, with $1.6 billion in valuation increases. Although most sectors performed well in the lowest-performing vintage (2012), write-downs in energy and, to a lesser extent, industrials had an impact. Write-ups were widespread in the top-sized 2007 vintage; however, write-downs in health care and energy partially offset the gains in other sectors.
- During second quarter, fund managers called $24.5 billion a 5.4% increase from the previous quarter. Limited partner (LP) distributions equaled $40.1 billion, a 23.2% jump quarter-over-quarter, for the fifth highest quarterly distribution amount ever. Over the last six and three-quarter years, distributions have outpaced contributions in 24 of 27 quarters for a distributions/contributions ratio of 1.5. In the preceding six years (2005–10), contributions outnumbered distributions at a ratio of 1.4.
- Seven vintage years (2007 and 2011–16) called between $1.6 billion and $5.9 billion for a total of nearly $24 billion, or more than 97% of the total called; the 2015 vintage called the most capital. Eleven vintages (2004–14) combined to distribute almost $39 billion as each returned more than $1 billion to LPs. Three of the largest vintages (by dollars raised), 2006–08, distributed $19.6 billion, or nearly half of the total distributed during the quarter.
- Figure 3 shows the GICS sector breakdown of the private equity index and a public market counterpart, the Russell 2000® Index. The breakdown provides context when comparing the performance of the two indexes. The chart highlights the private equity index’s relative overweights in energy, IT, and consumer discretionary, and the significant underweight in financials.
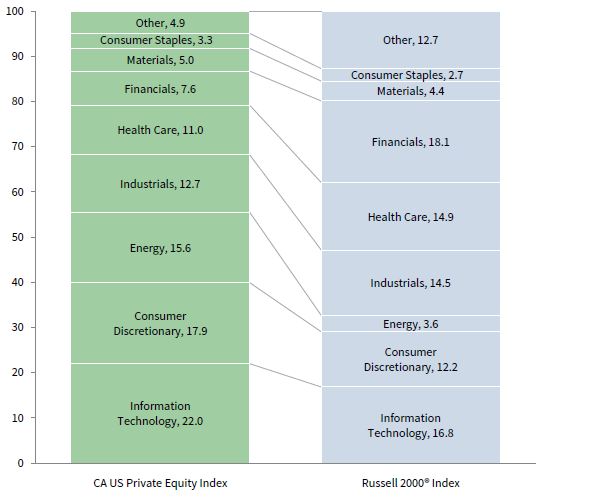
FIGURE 3 GICS SECTOR COMPARISONS: CA US PRIVATE EQUITY VS RUSSELL 2000®
As of June 30, 2017 • Percent (%)
Note: Other includes sectors that make up less than 3% of the CA benchmark.
- During the quarter, the materials sector crossed the 5% of index value threshold, joining six other sectors as meaningfully sized. Six of these seven sectors earned positive returns during the quarter (Figure 4); energy was the lone sector to lose value in the quarter. Five of the six sectors posting positive returns—materials, IT, consumer discretionary, industrials, and financials (in rank order)—rose more than 4%. Vintages 2007, 2010, and 2012 contributed most to the materials return of 7.3%, while vintage years 2006–07, 2009, and 2012–15 were instrumental in boosting the IT sector’s performance. For the energy sector, valuation decreases were most significant in the 2012 and 2007–08 vintages.

FIGURE 4 PRIVATE EQUITY GICS SECTORS RETURNS:
NET FUND-LEVEL PERFORMANCE
Note: Industry-specific gross company-level returns are before fees, expenses, and carried interest.
- IT (25%), energy (21%), and consumer discretionary (16%) companies attracted 63% of all invested capital during the quarter, which is about 12% higher than the average invested in these sectors over the long term. Driving the difference is the percentage of capital allocated to energy, historically about 14% of invested capital.
Venture Capital Performance Insights
- Meaningfully sized vintage years, 2005–07 and 2011–14, earned positive returns in second quarter 2017, while the 2008 and 2010 vintages posted negative returns (Figure 5). Only two of the large vintages, 2013 and 2014, saw returns exceed 2%. Second quarter performance was slightly muted compared to the previous quarter, when the nine large vintage years posted positive returns at an average of 3.6%.
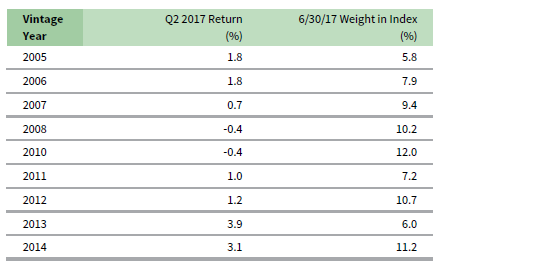
FIGURE 5 VENTURE CAPITAL VINTAGE YEAR RETURNS:
NET FUND-LEVEL PERFORMANCE
Note: Vintage year fund-level returns are net of fees, expenses, and carried interest.
- IT company valuation changes were the primary drivers of the quarterly returns for the best- and worst-performing vintage years, as well as the largest vintages. The best-performing vintage, 2013, enjoyed significant write-ups in IT, and the lowest performers, 2008 and 2010, experienced write-downs in the sector. For the 2010 vintage (the largest in the index), healthy write-ups in health care helped to offset the write-downs in IT.
- Venture capital fund managers called $4.2 billion from investors during second quarter, a 13.8% increase from the previous quarter, breaking a five-quarter trend of quarterly contributions less than $4 billion. Distributions from venture funds were $4.5 billion, a 12.9% decrease from first quarter and the third lowest quarterly output in the past five years (20 quarters).
- Funds formed from 2013 to 2016 were responsible for 87% ($3.6 billion) of the total capital called during the quarter. All four vintage years each called more than $450 million; the 2015 and 2016 vintages led the way with capital calls of more than $1 billion. Distributions from vintage years 2004–10 totaled $3.5 billion, representing almost 79% of the total from the quarter. On average, these seven vintages distributed about $500 million in the quarter.
- Figure 6 shows the GICS sector breakdown of the venture capital index and a public market counterpart, the Nasdaq Composite Index. The breakdown provides context when comparing the performance of the two indexes. The chart highlights the venture index’s relative overweights in health care and IT, and its considerable underweights in consumer discretionary and financials.
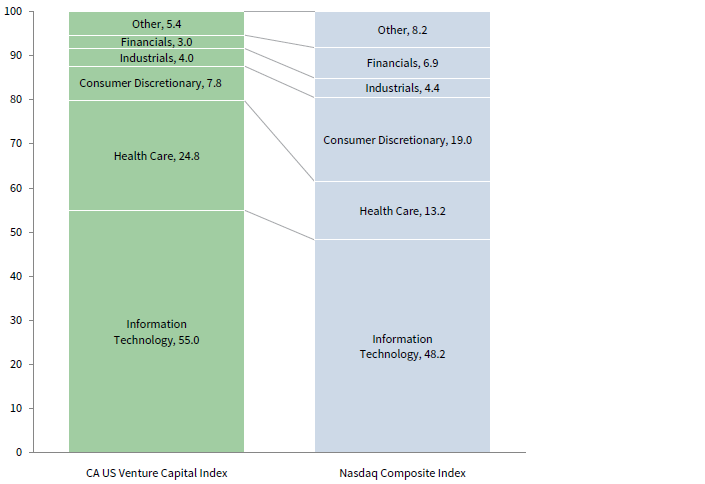
FIGURE 6 GICS SECTOR COMPARISONS: CA US VENTURE CAPITAL VS NASDAQ COMPOSITE
As of June 30, 2017 • Percent (%)
Note: Other includes sectors that make up less than 3% of the CA benchmark.
- All three sectors that represented at least 5% of the value of the index had positive returns in first quarter (Figure 7). In both quarters of the first half of the year, the best return was earned by the health care sector, while the lowest was posted by consumer discretionary companies. The health care return was mostly driven by write-ups in the 2006, 2014, and 2010 vintage year funds (in rank order) which, combined, represented almost 75% of the sector’s net appreciation change. Consumer discretionary valuations were generally flat to modestly positive in all vintages. As noted earlier, IT was a driving factor in the returns for several vintages but saw its greatest valuation increases in vintage years 2013–15. IT write-ups among the three vintages totaled $1.1 billion.
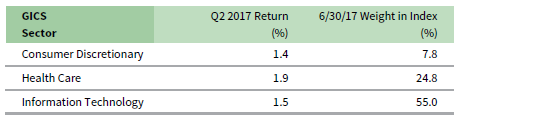
FIGURE 7 VENTURE CAPITAL VINTAGE YEAR RETURNS:
NET FUND-LEVEL PERFORMANCE
Note: Industry-specific gross company-level returns are before fees, expenses, and carried interest.
- In keeping with historical norms, during the second quarter, venture capital managers in the index allocated the lion’s share of their investments to IT, health care, and consumer discretionary companies (in rank order). At 90% of capital invested, the amount is about 3% higher than the long-term trend for the three sectors combined.
About the Cambridge Associates LLC Indexes
Cambridge Associates derives its US private equity benchmark from the financial information contained in its proprietary database of private equity funds. As of June 30, 2017, the database comprised 1,400 US buyouts, private equity energy, growth equity, and subordinated capital funds formed from 1986 to 2017, with a value of $678 billion. Ten years ago, as of June 30, 2007, the index included 798 funds whose value was $312 billion.
Cambridge Associates derives its US venture capital benchmark from the financial information contained in its proprietary database of venture capital funds. As of June 30, 2017, the database comprised 1,746 US venture capital funds formed from 1981 to 2017, with a value of $197 billion. Ten years ago, as of June 30, 2007, the index included 1,214 funds whose value was $86 billion.
The pooled returns represent the net end-to-end rates of return calculated on the aggregate of all cash flows and market values as reported to Cambridge Associates by the funds’ general partners in their quarterly and annual audited financial reports. These returns are net of management fees, expenses, and performance fees that take the form of a carried interest.
About the Public Indexes
The Nasdaq Composite Index is a broad-based index that measures all securities (over 3,000) listed on the Nasdaq Stock Market. The Nasdaq Composite is calculated under a market capitalization–weighted methodology.
The Russell 2000® Index includes the smallest 2,000 companies of the Russell 3000® Index (which is composed of the largest 3,000 companies by market capitalization).
The Standard & Poor’s 500 Composite Stock Price Index is a capitalization-weighted index of 500 stocks intended to be a representative sample of leading companies in leading industries within the US economy. Stocks in the index are chosen for market size, liquidity, and industry group representation.