Overview
US private equity[1]Beginning with this quarter’s edition of the US benchmark commentary, “private equity” will refer only to US buyout and growth equity funds rather than the CA US Private Equity Index®, which … Continue reading and venture capital returns were both in the double digits for calendar year 2017, but the divide between the results for the Cambridge Associates LLC indexes for the two asset classes was fairly wide. Key sectors (with the exception of energy) across the indexes posted strong returns against a backdrop of healthy public markets and an improving economy; in the public markets, US large-cap stocks had a stronger year than their smaller counterparts. When comparing the US private equity and venture capital indexes to public equities (based on modified public market equivalent [mPME] returns), the private indexes have the most success in longer time horizons (Figure 1). The Cambridge Associates US Private Equity Index has beaten small caps across all time horizons, but its record against the large-cap indexes has been mixed over the past five years. Through the end of calendar year 2017, the Cambridge Associates US Venture Capital Index® has outperformed small- and large-cap stocks and tech stocks on the 20- and 25-year horizons, but was either merely competitive or trailed in other time periods. Cambridge Associates’ mPME calculation is a private-to-public comparison that seeks to replicate private investment performance under public market conditions.
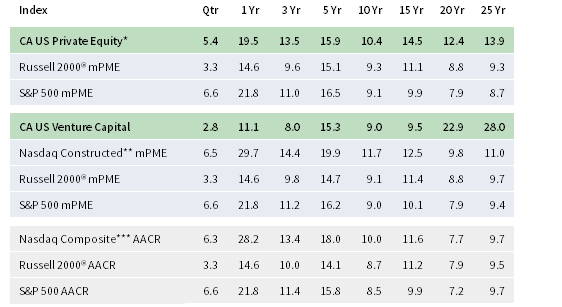
FIGURE 1 US PRIVATE EQUITY AND VENTURE CAPITAL INDEX RETURNS
Periods Ended December 31, 2017 • Percent (%)
Sources: Cambridge Associates LLC, Frank Russell Company, Standard & Poor’s, and Thomson Reuters Datastream.
Notes: Private indexes are pooled horizon internal rates of return, net of fees, expenses, and carried interest. Returns are annualized, with the exception of returns less than one year, which are cumulative. Because the US Private Equity and Venture Capital indexes are capitalization weighted, the largest vintage years mainly drive the indexes’ performance. Public index returns are shown as both time-weighted returns (average annual compound returns) and dollar-weighted returns (mPME). The CA Modified Public Market Equivalent replicates private investment performance under public market conditions. The public index’s shares are purchased and sold according to the private fund cash flow schedule, with distributions calculated in the same proportion as the private fund, and mPME net asset value is a function of mPME cash flows and public index returns.
* Includes US buyout and growth equity funds only.
** Constructed Index: Data from 1/1/1986 to 10/31/2003 represented by Nasdaq Price Index. Data from 11/1/2003 to present represented by Nasdaq Composite.
*** Capital change only.
Fourth Quarter and Calendar Year 2017 Highlights
- As detailed in Figure 1, the private equity index has had more recent success outperforming the Russell 2000® Index (small companies) than the S&P 500 Index (large companies), evidenced by the fourth quarter, one-, and five-year periods. The venture capital index has struggled a bit when compared with the public markets, only outperforming all three public indexes in two of the eight time periods (20- and 25-year horizons).
- As of December 31, 2017, public companies accounted for nearly the same amount in both the private equity and venture capital benchmarks (between 11% and 12%). At about 18%, exposure to non-US companies in the private equity index was double the percentage in the venture capital benchmark.
- In 2017, among the largest sectors, the best performing were industrials in US private equity and consumer discretionary in US venture capital.
US Private Equity Performance Insights
In 2017, large-cap stocks led strong public equity performance, as the economy’s biggest sectors (with the exception of energy) posted gains. The private equity index’s fourth quarter return was its best of the year and its annual performance was its highest since 2013. In a reversal from last year, the private equity index beat the Russell 2000® and trailed the S&P 500. Among the 13 vintage years (2004–16) that accounted for 98% of the index’s value, all but two earned positive returns in fourth quarter (2004 and 2005 were the exceptions); all 13 were up for the year.
According to Dealogic, ten private equity–backed companies went public in fourth quarter with a combined value of $2.4 billion. The quarter’s largest initial public offering (IPO) was Evoqua Water Technologies Corp (waste management). By number, 51, and by value, $19.6 billion, 2017 proved to be a much better year for private equity–backed IPOs than 2016 (29 and $8.2 billion, respectively), whose activity was a marked decline from the previous three years. Slightly more than two-thirds of the 51 IPOs took place in technology, finance, health care, and energy; the largest IPO of the year was Altice USA (cable TV). Fourth quarter saw 193 merger & acquisition (M&A) transactions, in line with third quarter. The values of 34 of those deals (17.6%) were disclosed to the public, compared with the 21% of disclosed deals in the previous quarter. Based on publicly available data, the average transaction size in fourth quarter was the lowest of the year at $602 million. Deals announced in the second and third quarters averaged over $1 billion. The number of M&A transactions in 2017 (681) was higher than in 2016, but remained lower than the average of the immediate past (the average from 2013 to 2016 was 736 deals per year). Transactions with disclosed values averaged $892 million in 2017, compared with an average of $601 million over 2013–16.
Eight vintage years—2006–08 and 2011–15—qualified as meaningfully sized (5% or more of the index’s value) and together represented 83% of the private equity index’s value at the end of 2017 (Figure 2); returns for these eight vintages ranged from 2.3% to 12.5% in fourth quarter. During the quarter, vintage year 2009 fell below the 5% of value threshold.
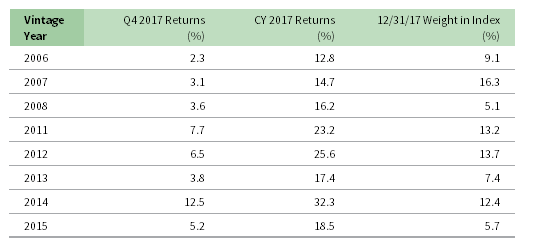
FIGURE 2 US PRIVATE EQUITY VINTAGE YEAR RETURNS: NET FUND-LEVEL PERFORMANCE
Notes: Vintage year fund-level returns are net of fees, expenses, and carried interest. US private equity is composed of US buyout and growth equity funds.
For the best- and worst-performing vintages in the quarter, 2014 and 2006, respectively, industrial companies were a key driver of success. For the 2014 group, other sectors, such as IT and health care also helped boost returns. For the full year, all eight large vintages produced double-digit returns. The year’s best and worst vintages mirrored fourth quarter. The 32.3% return earned by the 2014 vintage was driven mostly by IT investments with significant contributions from health care, industrials, and materials. Vintage year 2006 funds had gains in similar sectors but they were more muted. For the second year in a row, the largest vintage, 2007, was the second lowest performer for both fourth quarter and the year, despite meaningful write-ups in all large sectors except energy.
Figure 3 shows the GICS sector breakdown of the CA private equity index—with and without energy-focused funds—and a public market counterpart, the Russell 2000® Index. The breakdown provides context when comparing the performance of the private and public indexes. The chart highlights the relative overweights in the private equity index, such as IT and consumer discretionary, and the underweight in financials. We show the private equity index breakdown with and without energy-focused funds to highlight the impact of those funds on the index. In the future, for comparison with the public markets, the sector breakdown of the private equity index will include only buyouts and growth equity funds.
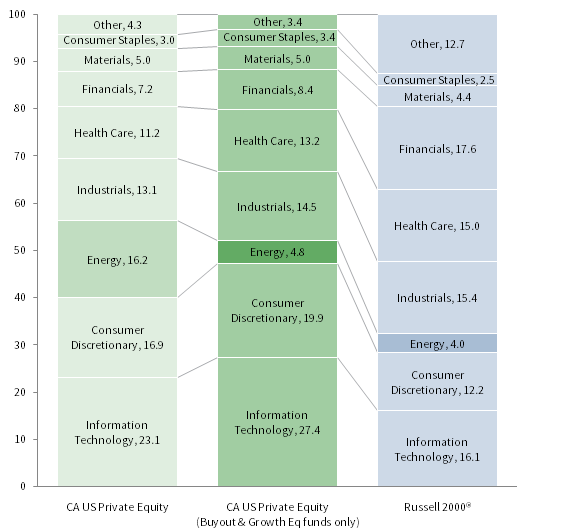
FIGURE 3 GICS SECTOR COMPARISONS: CA US PRIVATE EQUITY VS RUSSELL 2000®
As of December 31, 2017 • Percent (%)
Note: Other includes sectors that individually make up less than 2% of the CA benchmark.
All Key Sectors in the Private Equity Index Earned Positive Returns for the Quarter and Double-Digit Returns for the Year. The six meaningfully sized sectors—IT, consumer discretionary, industrials, health care, financials, and materials—composed more than 88% of the index’s total value, and returned between 4.6% and 11.5% during the quarter (Figure 4). On a dollar-weighted basis, they earned a gross return of 6.8%, slightly outperforming the total benchmark’s quarterly gross performance. Industrials posted the highest return for the quarter; four vintages (2007, 2011–12, 2014) each had more than $1.1 billion in net appreciation in the sector. In the consumer discretionary sector, no vintage suffered meaningful losses and only three—2007, 2009, and 2011—had significant gains. During the quarter, two-thirds of the capital deployed by fund managers was allocated to three sectors (from highest to lowest): IT, industrials, and health care. This allocation is almost 20% higher than long-term trends, with industrials and health care accounting for the bulk of the overweight. The high IT component and a smaller consumer discretionary focus is reflective of the investment activity in the private equity asset classes over the past ten years.
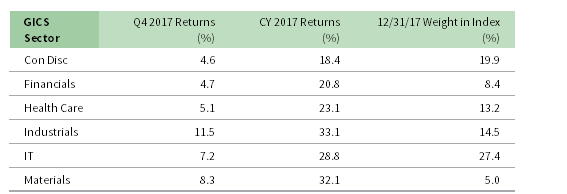
FIGURE 4 US PRIVATE EQUITY GICS SECTORS RETURNS: NET FUND-LEVEL PERFORMANCE
Notes: Vintage year fund-level returns are net of fees, expenses, and carried interest. US private equity is composed of US buyout and growth equity funds.
Annual returns for the large sectors in the private equity universe were strong; companies in the best-performing sectors, industrials and materials, earned north of 30% for the year; the “worst”-performing sector, consumer discretionary, posted a return of 18.4%. Write-ups for industrial companies were more widespread than those for materials businesses, with vintage years 2011, 2007, and 2012 (in rank order) leading the way. Write-ups for materials were dominated by vintages 2012, 2007, and 2014. By amount, write-ups in industrials were nearly three times the amount in materials, which is in line with the individual sectors representation in the index. The six large sectors earned a gross return of 25.5% for the year, outperforming the benchmark’s total gross return by 1.7%. Partly as a result of excluding energy and subordinated capital funds from the private equity index, the energy sector is no longer meaningfully sized, and its performance for the year (2.6%) stood out as by far the worst performance among all sectors.
Contributions and Distributions Rise from 2016 Levels. During 2017, managers in the US private equity index called $85.5 billion from limited partners (LPs), marking the highest year for capital calls since 2007, and a more than $10 billion increase over 2016 totals (Figure 5). Total distributions in 2017 were $134.7 billion, a jump of nearly $29 billion from the prior year, and second only to 2014 for the most distributions in any one year. The year marked the fifth in a row that distributions eclipsed $100 billion, and the seventh consecutive year that distributions outpaced contributions. Since the inception of the index in 1986, there have only been three other years when there were more distributions than contributions—1996, 2004, and 2005.

FIGURE 5 US PRIVATE EQUITY CONTRIBUTIONS, DISTRIBUTIONS, AND NET ASSET VALUE (NAV)
Calendar Years 2006–17 • USD Billions
Note: US private equity is composed of US buyout and growth equity funds.
In fourth quarter 2017, managers in the private equity index called $22.9 billion from LPs and returned $44.5 billion, representing a quarter-over-quarter decrease of 8% in contributions and a 43% increase in distributions. In dollar terms, the differences were -$1.9 billion for capital calls and $13.4 billion for distributions.
Investors in funds launched in 2011–16 contributed $22.4 billion, or 98% of the total capital called during the quarter; four of the six vintage years each called more than $3.4 billion from their LPs. Conversely, 11 vintage years (2005–15) distributed more than $900 million each in the quarter; of the 11, eight distributed $2.7 billion or more, and two distributed more than $8.3 billion. Vintages 2007 and 2011 distributed the most, a combined total of almost $18 billion, or 40%, of the capital distributed. Over the last seven years, distributions outpaced contributions in 25 of 28 quarters for a distributions/contributions ratio of 1.7. In the preceding six years (2004–10), contributions outnumbered distributions at a ratio of 1.3 times.
US Venture Capital Performance Insights
The US venture capital index had a respectable fourth quarter, helping it round out a return of 11.1% for the year. Keeping with historical trends, consumer discretionary, health care, and IT were the largest sectors of the index and the drivers of the benchmark’s return during the year. During the year, the volume of cash flows in and out of venture managers, as well as the IPO market, rebounded from a slow year prior.
According to the National Venture Capital Association and PitchBook, exit activity for venture-backed companies experienced an uptick in 2017. The 58 IPOs in 2017 were valued at close to $10 billion, a 41% increase in count and 236% increase in value over 2016. The 565 venture-backed M&A transactions during the year were 122 fewer than in 2016. M&A activity, as well as valuations, for deals with disclosed values was lower in 2017. The average size of a venture-backed M&A transaction in 2017 was $60 million, down nearly 11% from 2016, when disclosed values averaged $68 million.
The venture capital index’s fourth quarter results (2.8%), as well as its annual return (11.1%), were much weaker than those of public equities. For the year, returns among the ten meaningfully sized vintage years ranged from 21.4% (2013) to -0.8% (2008). Seven of the ten posted returns above 12% (Figure 6); combined, the large vintage years accounted for 84% of the index.
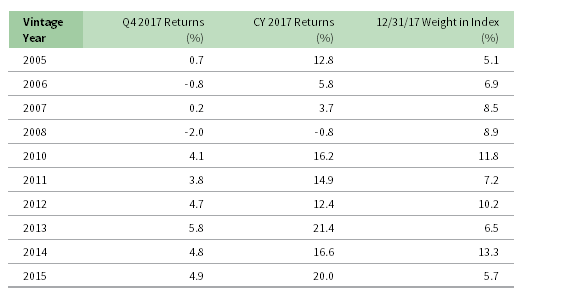
FIGURE 6 US VENTURE CAPITAL VINTAGE YEAR RETURNS: NET FUND-LEVEL PERFORMANCE
Note: Vintage year fund-level returns are net of fees, expenses, and carried interest.
For the 2013 vintage year, significant write-ups in health care and IT were the primary drivers of annual performance, each with about $1.3 billion in valuation increases. The 2008 vintage year was driven by $246 million in write-downs in health care, but slightly offset by write-ups in consumer discretionary and IT.
Figure 7 shows the GICS sector breakdown of the venture capital index and a public market counterpart, the Nasdaq Composite Index. The breakdown provides context when comparing the performance of the two indexes. The chart highlights the venture index’s relative overweights in IT and health care, and its underweight in consumer discretionary and financials.

FIGURE 7 GICS SECTOR COMPARISONS: CA US VENTURE CAPITAL VS NASDAQ COMPOSITE
As of December 31, 2017 • Percent (%)
Note: Other includes sectors that individually make up less than 2% of the CA benchmark.
Consumer Discretionary Posted the Highest Fourth Quarter and Annual Returns in 2017. The venture capital industry continues to be highly concentrated in the consumer discretionary, health care, and IT sectors; the three accounted for almost 87% of the venture capital index’s value at the close of 2017 (Figure 8). Almost 90% of capital invested during fourth quarter went into companies in these sectors, which is slightly above the long-term trend. Two of the three sectors, health care and IT, each garnered more than $1 billion in investments during the fourth quarter. Among these three sectors, consumer discretionary had the best performance for the quarter and the year, returning 10.4% and 19.7%, respectively.
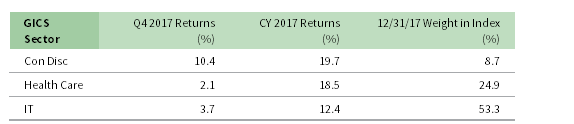
FIGURE 8 US VENTURE CAPITAL GICS SECTORS RETURNS: NET FUND-LEVEL PERFORMANCE
Note: Industry-specific gross company-level returns are before fees, expenses, and carried interest.
For the year, IT was driven by write-ups in vintages 2010 and 2012–15, with an average of almost $1.6 billion for each vintage. Health care company valuations in four vintage years (2004, 2010, and 2013–14) each had write-ups greater than $875 million, with 2010 and 2013 having valuation increases greater than $1 billion. Consumer discretionary was largely driven by the 2005 vintage year’s $700 million in write-ups, as well as write-ups of $200 million or more in six vintage years: 2006, 2008–11, and 2014.
2017 Venture Capital Calls and Distributions Increase from Prior Year. Managers in the US venture capital index called and distributed more capital in 2017 than they did in 2016 (Figure 9). Contributions increased 19% to $17.1 billion and distributions increased 14% to $21.5 billion, making 2017 the sixth straight year that more capital was distributed than called.
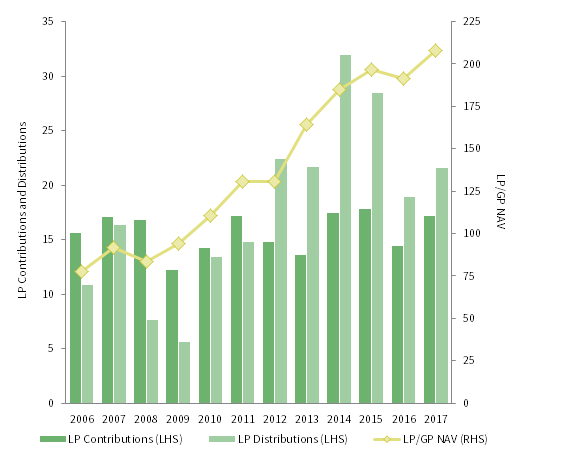
FIGURE 9 US VENTURE CAPITAL CONTRIBUTIONS, DISTRIBUTIONS, AND NET ASSET VALUE (NAV)
Calendar Years 2006–17 • USD Billions
In fourth quarter, managers in the venture capital index called $4.1 billion, a decrease of about $390 million, or 9%, from the previous quarter. Fourth quarter distributions were $6.1 billion, 7% higher than the third quarter. Including fourth quarter 2017, venture capital funds have distributed more capital than they have called in 23 of the 24 past quarters, a cash flow trend that the venture industry hasn’t experienced since the 1990s.
Managers of funds raised from 2014 to 2016 called $3.0 billion, or 72% of all capital called during the quarter. Each of the three vintages called more than $880 million, with the 2016 funds calling $1.2 billion. Six vintage years—2000, 2005–07, and 2010–11—returned more than $450 million to investors during the quarter. Distributions from these vintages averaged just over $600 million each, and the six combined to distribute 59% of the total.
Caryn Slotsky, Senior Investment Director
Jacob Gilfix, Senior Investment Associate
Sarah Grifferty, Investment Associate
About the Cambridge Associates LLC Indexes
Cambridge Associates derives its US private equity benchmark from the financial information contained in its proprietary database of private equity funds. As of December 31, 2017, the database included 1,078 US buyouts and growth equity funds formed from 1986 to 2017, with a value of $581.5 billion. Ten years ago, as of December 31, 2007, the index included 669 funds whose value was $327.3 billion.
Cambridge Associates derives its US venture capital benchmark from the financial information contained in its proprietary database of venture capital funds. As of December 31, 2017, the database included 1,794 US venture capital funds formed from 1981 to 2017, with a value of $208.1 billion. Ten years ago, as of December 31, 2007, the index included 1,257 funds whose value was $92.0 billion.
The pooled returns represent the net end-to-end rates of return calculated on the aggregate of all cash flows and market values as reported to Cambridge Associates by the funds’ general partners in their quarterly and annual audited financial reports. These returns are net of management fees, expenses, and performance fees that take the form of a carried interest.
About the Public Indexes
The Nasdaq Composite Index is a broad-based index that measures all securities (over 3,000) listed on the Nasdaq Stock Market. The Nasdaq Composite is calculated under a market capitalization–weighted methodology.
The Russell 2000® Index includes the smallest 2,000 companies of the Russell 3000® Index (which is composed of the largest 3,000 companies by market capitalization).
The Standard & Poor’s 500 Composite Stock Price Index is a capitalization-weighted index of 500 stocks intended to be a representative sample of leading companies in leading industries within the US economy. Stocks in the index are chosen for market size, liquidity, and industry group representation.
Footnotes