Overview
Calendar year 2016 results for the Cambridge Associates LLC benchmark indexes for US private equity and US venture capital dramatically diverged: the private equity index had its best year since 2013 while the venture capital benchmark had its worst year since 2008. All key sectors in the private equity index posted double-digit gross returns for the calendar year; after dampening the index’s performance in the previous few years, companies in the energy sector led the way in fourth quarter and for the year. In the public markets, US large-cap stocks had a weaker showing for fourth quarter than tech stocks and small caps, both of which also outperformed large caps for the calendar year. Comparing the US private equity and venture capital indexes to public equities (based on modified public market equivalent [mPME] returns), the private indexes have had mixed success in recent time periods (Table 1). The Cambridge Associates US Private Equity Index® has beaten both large and small caps on time horizons of ten years or longer, but trailed both over the past five years and only bested small caps over the past three years. Though the end of calendar year 2016, the Cambridge Associates US Venture Capital Index® has outperformed small- and large-cap stocks and tech stocks on the three-, 20-, and 25-year horizons, but trailed in other time periods. Cambridge Associates’ mPME calculation is a private-to-public comparison that seeks to replicate private investment performance under public market conditions.
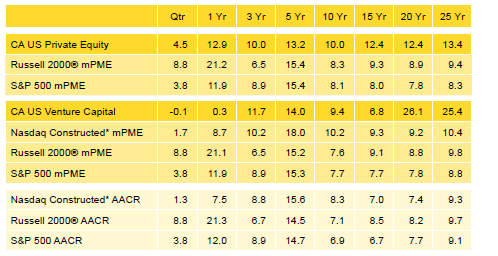
Table 1. US Private Equity and Venture Capital Index Returns
Periods Ended December 31, 2016 • USD Terms • Percent (%)
Sources: Cambridge Associates LLC, Frank Russell Company, Standard & Poor’s, and Thomson Reuters Datastream.
Notes: Private indexes are pooled horizon internal rates of return, net of fees, expenses, and carried interest. Because the US Private Equity and Venture Capital indexes are capital weighted, the largest vintage years mainly drive the indexes’ performance. Public index returns are shown as both time-weighted returns (average annual compound returns) and dollar-weighted returns (mPME). The CA Modified Public Market Equivalent replicates private investment performance under public market conditions. The public index’s shares are purchased and sold according to the private fund cash flow schedule, with distributions calculated in the same proportion as the private fund, and mPME net asset value is a function of mPME cash flows and public index returns.
* Constructed Index: Data from 1/1/1986 to 10/31/2003 represented by Nasdaq Price Index. Data from 11/1/2003 to present represented by Nasdaq Composite.
Fourth Quarter and Calendar Year 2016 Highlights
- As detailed in Table 1, the private equity index has recently had less success versus the Russell 2000® Index (small companies) than the S&P 500 Index (large companies), evidenced by the fourth quarter, and one- and five-year periods. The venture capital index has struggled somewhat when compared with the public markets, only outperforming all three public indexes listed in three of the eight time horizons (three-, 20-, and 25-year periods).
- As of December 31, 2016, public companies accounted for 13.5% of the private equity benchmark and 11.3% of the venture capital Exposure to non-US companies was 16.0% and 7.8% for the private equity and venture capital benchmarks, respectively.
- Of the largest sectors in each index, energy was the best-performing sector in the private equity index for 2016; IT was the best performer in the venture capital benchmark.
Private Equity Performance Insights
Amid slow economic growth and political uncertainty globally, the 2016 investment environment featured solid performance in public equities, led by small-cap stocks; a gradual increase in commodity prices; and a strengthening US dollar. The private equity index’s fourth quarter return was its best of the year and its annual performance was its highest since 2013. In both the fourth quarter and the year, the private equity index surpassed the S&P 500 Index and trailed the Russell 2000® Index. Looking at fourth quarter 2016 results for the 13 vintage years (2004 –16) that accounted for more than 97% of the index’s value, all but one earned positive returns (2016 was the exception).
According to Dealogic, nine private equity–backed companies went public in the fourth quarter with a combined value of $2.6 billion. This represents a slightly slower quarter than the prior two by number of companies but was the second best by value. The largest initial public offering (IPO) in the fourth quarter was Extraction Oil & Gas Inc. Overall, the year saw 29 private equity–backed IPOs despite a slow start with zero in the first quarter, fetching $8.2 billion. Slightly more than half of the 29 IPOs took place in food and beverage, health care, energy, and technology; the largest IPO of the year was US Foods Holding Corporation. In terms of both number and value, 2016 IPOs represented a significant drop from each of the previous three years. Both 2013 and 2014 saw more than 75 IPOs worth at least $30 billion. In 2015, 45 companies went public at a value of $14.7 billion.
The fourth quarter saw 134 M&A transactions, a decrease from 168 in the third quarter. The values of 34 of those deals (25.4%) were disclosed to the public, about the same percentage of disclosed deals in the previous quarter. Based on publicly available data, the average transaction sizes in the second half of the year were measurably larger than those in the first half of the year. In both the third and fourth quarters, transactions averaged over $1 billion in size, with no one industry dominating activity. While the number of M&A transactions in 2016 was much lower than during the three prior years (the average from 2013 to 2015 was more than 770 deals per year), the average size for transactions with disclosed values was much higher ($855 million in 2016 compared with an average of $517 million over 2013–15).
Seven vintage years—2006–08 and 2011–14 —qualified as meaningfully sized (5% or more of the index’s value) and together represented 79% of the private equity index’s value at the end of 2016 (Table 2); returns for these seven vintages ranged from 2.9% to 7.3% in the fourth quarter. During the quarter, two vintage years, 2005 and 2009, fell below the 5% of value threshold, while others, including 2013 and 2014, grew in representation, in part due to their respective stages of development.
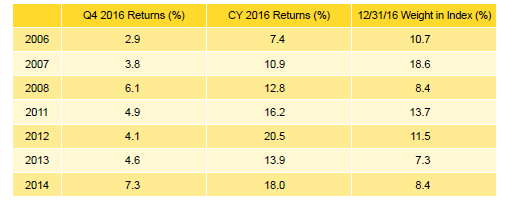
Table 2. Private Equity Vintage Year Returns: Net Fund-Level Performance
Note: Vintage year fund-level returns are net of fees, expenses, and carried interest.
The best-performing vintage for the fourth quarter, 2014, was buoyed by write-ups in its two largest sectors, IT and energy. For the worst-performing group, the 2006 vintage, strong gains in consumer staples, industrials, financials, and health care (in rank order) were partially offset by sizable write-downs in IT. For the full year, six of the seven large vintages produced double-digit returns (2006 was the exception). The funds formed in 2012 earned the year’s best return, mostly on the strength of energy and IT investments but also with significant contributions from health care and industrials. Vintage year 2006 funds were also the worst performers for the year as large write-ups in consumer staples and health care were partially offset by write-downs in energy and materials. The largest vintage, 2007, was the second lowest performer for both the fourth quarter and year, despite outsized write-ups in its three largest sectors: IT, energy, and consumer discretionary (in rank order of write-ups).
Figure 1 shows the GICS sector breakdown of the private equity index and its public market counterpart, the Russell 2000® Index. The breakdown provides context when comparing the performance of the two indexes. The chart highlights the relative overweights in the private equity index, such as IT, consumer discretionary, and energy, and the underweight in financials.
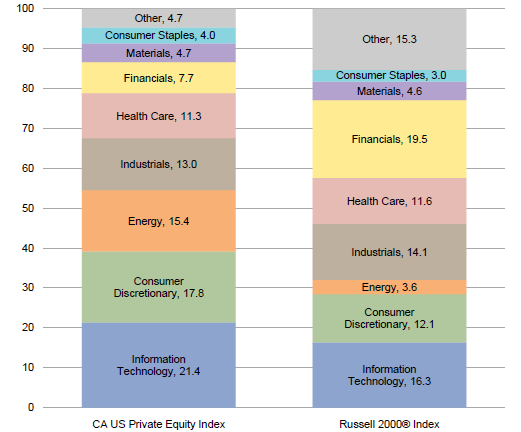
Figure 1. GICS Sector Comparisons: CA US Private Equity vs Russell 2000®
As of December 31, 2016 • Percent (%)
Sources: Cambridge Associates LLC, FactSet Research Systems, and Frank Russell Company.
Notes: The Global Industry Classification Standard (GICS®) was developed by and is the exclusive property and a service mark of MSCI Inc. and S&P Global Market Intelligence LLC and is licensed for use by Cambridge Associates LLC. Other includes sectors that make up less than 3% of the CA benchmark.
All Key Sectors in the Private Equity Index Earned Positive Returns for the Quarter and Double-Digit Returns for the Year; Energy Led All. The six meaningfully sized sectors (representing at least 5% of the index)—IT, consumer discretionary, energy, industrials, health care, and financials—composed almost 87% of the index’s total value and returned between 2.4% and 12.5% (Table 3). On a dollar-weighted basis, they earned a gross return of 5.3%, slightly outperforming the total benchmark’s gross performance. Energy posted the highest return for the quarter; seven vintages (2007–08 and 2011–15) had more than $900 million in write-ups in the sector. The consumer discretionary sector’s more muted return was driven largely by write-ups in the 2007 and 2011 vintages and write-downs in the 2006 vintage. During the quarter, 64% of the capital deployed by fund managers was allocated to three sectors (from highest to lowest): IT, energy, and consumer discretionary. This allocation is 14% higher than long-term trends, with IT and energy accounting for the overweight. The pattern, however, is more reflective of investment activity over the past five years, with only IT showing a significant overweight.

Table 3. Private Equity Sector Returns: Gross Company-Level Performance
Note: Industry-specific gross company-level returns are before fees, expenses, and carried interest.
In a reversal of fortune, the sector that posted the lowest returns in 2014 and 2015, energy, earned the highest return in 2016. Write-ups for energy companies were widespread and totaled $18 billion for the year. Financials earned the worst return among the large sectors for the year. The biggest positive contributors were vintages 2008 and 2011, while vintage 2005 was the only one with meaningful write-downs. Notably, materials and consumer staples, which represented more than 4% of the index, posted calendar year returns of 22.3% and 30.6%, respectively, also contributing to the index’s strong year. The six large sectors earned a gross return of 15.5% for the year, underperforming the benchmark’s total gross return by 0.8%.
Contributions Rise, Distributions Fall From 2015 Levels. In the fourth quarter, managers in the private equity index called $25.6 billion from limited partners (LPs) and returned $39.2 billion, representing a quarter-over-quarter decrease of 6.8% in contributions and a 31.5% increase in distributions. In dollar terms, the differences were -$1.9 billion for capital calls and $9.4 billion for distributions.
Investors in funds launched in 2007 and 2011–16 contributed $24.7 billion, or 97% of the total capital called during the quarter; all but one of the seven vintage years called more than $2.5 billion from their LPs. The exception, the 2007 funds, called $1.1 billion, notable for a vintage that is ten years “old” and reflecting the effect the global financial crisis had on the vintage year’s investment pace. Conversely, eight vintage years (2005–12) distributed more than $1.0 billion each in the quarter and, of the eight, six distributed $3.8 billion or more. Investors in funds launched in 2007 and 2011 received $16 billion, or 41%, of the capital distributed. Over the last six years, distributions have outpaced contributions in 21 of 24 quarters for a distributions/contributions ratio of 1.6. In the preceding six years (2005–10), contributions outnumbered distributions at a ratio of 1.4 times.
During 2016, managers in the private equity index called $99.1 billion from LPs, marking the highest year for capital calls since 2007 and an almost $11 billion increase over 2015 totals (Figure 2). Total distributions in 2016 were $122.2 billion, a drop of $20 billion from the prior year and about $37 billion off the record-setting pace of 2014. Despite the decline, 2016 marked the fifth year in a row that distributions eclipsed $100 billion. It was also the sixth in a row, but only the tenth since the inception of the private equity index, in which distributions outpaced contributions; the others were 1994, 1996, 2004, 2005, and 2011–15.

Figure 2. Private Equity Contributions, Distributions, and Net Asset Value (NAV)
Calendar Years 2005–16
Venture Capital Performance Insights
The US venture capital index was down slightly in the fourth quarter but managed to eke out a return of 0.3% for the year, its sixth worst annual return since inception of the benchmark (1981). As has been the case historically, consumer discretionary, health care, and IT were the largest sectors of the index and the drivers of the benchmark’s return during the year. During the year, cash flows in and out of venture managers were less robust than in recent years and the IPO market was also less robust.
According to the National Venture Capital Association and PitchBook, exit activity for venture-backed companies was much slower than in 2015. The 39 IPOs in 2016 were valued at $2.9 billion, amounts that were 49% and 64% lower, respectively, than those in 2015. The 687 venture-backed M&A transactions during the year represented 197 fewer than in 2015. While M&A activity was lower, valuations for deals with disclosed values were higher. The average size of a venture-backed M&A transaction in 2016 was $248 million, up nearly 51% from 2015, when disclosed values averaged $164 million.
The venture capital index’s fourth quarter performance, -0.1%, was much weaker than public equities but in line with its flat return for the year. In 2016, only three of the nine meaningfully sized vintage years posted returns above 5% (Table 4). The 2014 vintage earned the year’s best return, 8.8%, and the 2005 vintage produced the year’s worst, -4.2%. The nine largest vintage years accounted for 82% of the index.
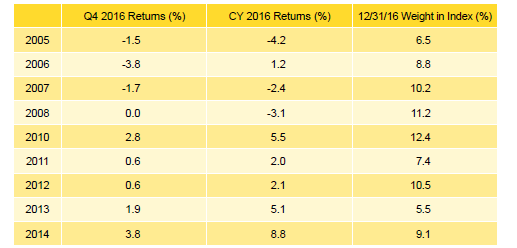
Table 4. Venture Capital Vintage Year Returns: Net Fund-Level Performance
Note: Vintage year fund-level returns are net of fees, expenses, and carried interest.
For the 2014 vintage year, significant write-ups in health care and IT were the primary drivers of performance, with over $315 million and $775 million in valuation increases, respectively. The 2005 vintage year was driven by write-downs in financials, health care, and IT for an average of about $215 million in valuation decreases in each sector.
Figure 3 shows the GICS sector breakdown of the venture capital index and a public market counterpart, the Nasdaq Composite. The breakdown provides context when comparing the performance of the two indexes. The chart highlights the venture index’s relative overweights in IT and health care, and its underweight in consumer discretionary.

Figure 3. GICS Sector Comparisons: CA US Venture Capital vs Nasdaq Composite
As of December 31, 2016 • Percent (%)
Sources: Cambridge Associates LLC, FactSet Research Systems, and Nasdaq Inc.
Notes: The Global Industry Classification Standard (GICS®) was developed by and is the exclusive property and a service mark of MSCI Inc. and S&P Global Market Intelligence LLC and is licensed for use by Cambridge Associates LLC. Other includes sectors that make up less than 3% of the CA benchmark.
IT Posted the Highest Fourth Quarter and Annual Returns in 2016. The venture capital industry continues to be highly concentrated in the consumer discretionary, health care, and IT sectors; the three accounted for almost 88% of the venture capital index’s value at the close of 2016 (Table 5). About 88% of capital invested during the fourth quarter went into companies in these sectors, which is consistent with the long-term trend. Two of the three sectors, health care and IT, garnered more than $2.5 billion in investments during the fourth quarter. Among these three sectors, IT was the best-performing for the quarter and the year, with 0.1% and 3.1% returns, respectively.
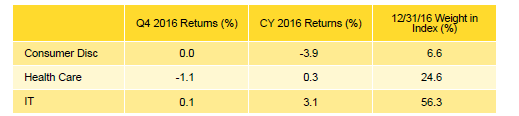
Table 5. Venture Capital Sector Returns: Gross Company-Level Performance
Note: Industry-specific gross company-level returns are before fees, expenses, and carried interest.
For the year, IT write-ups in vintages 2006 and 2010–15 were partially offset by write-downs in vintage years 2003–05 and 2007–09. Health care company valuations in five vintage years (2007, 2008, 2012, 2014, and 2015) were written up, while those in all others were flat to down. Consumer discretionary write-downs were concentrated in vintage years 2007–08. Another notable valuation shift included the financial services sector, which saw meaningful write-downs in vintages 2005 and 2008, leading the sector to post the lowest return among all sectors in the index.
2016 Venture Capital Calls and Distributions Decrease from Prior Year, Both Reaching Lows Compared with Recent Years. In the fourth quarter, managers in the venture capital index called $3.1 billion, a decrease of $132 million, or 4.0%, from the previous quarter. Fourth quarter distributions were $4.9 billion, 9.1% lower than the third quarter. Including the fourth quarter, venture capital funds have distributed more capital than they have called in 20 straight quarters, a cash flow trend that the venture industry hasn’t experienced since the 1990s.
Managers of funds raised from 2013 to 2016 called $2.6 billion, or 81.4% of all capital called during the quarter. Each of the four vintages called more than $360 million, with the 2014 funds calling $1.1 billion. Eight vintage years returned more than $300 million to investors during the quarter. Distributions from the 2006–08 vintages averaged about $690 million each, and the three combined to distribute 42% of the total.
Managers in the US venture capital index called and distributed less capital in 2016 than they did in 2015 (Figure 4). Contributions decreased 24.4% to $12.8 billion, and distributions decreased 33.6% to $18.7 billion. These decreases mark the lowest level in called capital in the past seven years and distributed capital in the past five years. Despite lower cash flows, 2016 marks the fifth straight year that more capital was distributed than called.
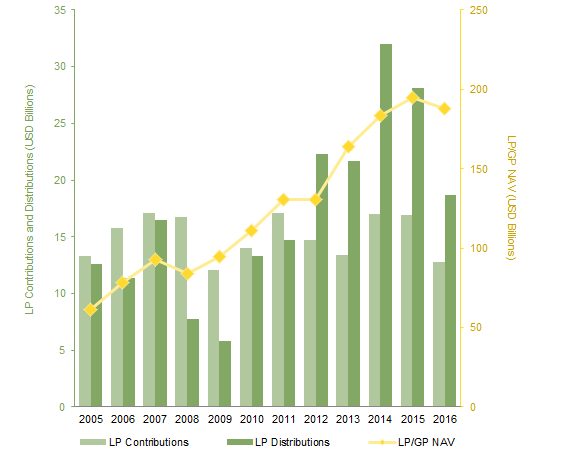
Figure 4. Venture Capital Contributions, Distributions, and Net Asset Value (NAV)
Calendar Years 2005–16
About the Cambridge Associates LLC Indexes
Cambridge Associates derives its US private equity benchmark from the financial information contained in its proprietary database of private equity funds. As of December 31, 2016, the database comprised 1,370 US buyouts, private equity energy, growth equity, and mezzanine funds formed from 1986 to 2016, with a value of $653.9 billion. Ten years ago, as of December 31, 2006, the index included 751 funds whose value was $274.5 billion.
Cambridge Associates derives its US venture capital benchmark from the financial information contained in its proprietary database of venture capital funds. As of December 31, 2016, the database comprised 1,708 US venture capital funds formed from 1981 to 2016, with a value of $188.0 billion. Ten years ago, as of December 31, 2006, the index included 1,186 funds whose value was $78.6 billion.
The pooled returns represent the net end-to-end rates of return calculated on the aggregate of all cash flows and market values as reported to Cambridge Associates by the funds’ general partners in their quarterly and annual audited financial reports. These returns are net of management fees, expenses, and performance fees that take the form of a carried interest.
About the Public Indexes
The Nasdaq Composite Index is a broad-based index that measures all securities (over 3,000) listed on the Nasdaq Stock Market. The Nasdaq Composite is calculated under a market capitalization–weighted methodology.
The Russell 2000® Index includes the smallest 2,000 companies of the Russell 3000® Index (which is composed of the largest 3,000 companies by market capitalization).
The Standard & Poor’s 500 Composite Stock Price Index is a capitalization-weighted index of 500 stocks intended to be a representative sample of leading companies in leading industries within the US economy. Stocks in the index are chosen for market size, liquidity, and industry group representation.