Overview
The Cambridge Associates LLC benchmark indexes for US private equity and US venture capital produced modest returns for fourth quarter 2015, leading to lower calendar year performance than either index earned in the two previous years. Many of the large sectors in the private indexes had strong returns for the year, particularly health care and software in the private equity benchmark and health care in venture capital, but for the second year in a row energy companies dampened the private equity return. In the seven years (28 quarters) since 2008 (2009–15), the private equity index earned positive returns in all but four quarters and the venture capital index rose in all but three quarters. In fourth quarter 2015, neither the private equity nor venture capital index outperformed the public markets, but for the year both private asset classes bested the public markets. Over the past five years, venture capital has outperformed private equity and the public markets, but during the 15-year period ending in 2015, private equity produced the best results among the private and public indexes.
The Cambridge Associates indexes are derived from performance data compiled for funds that represent the majority of the institutional capital raised by private equity and venture capital partnerships. The Cambridge Associates LLC US Private Equity Index® includes funds raised between 1986 and 2015, and the Cambridge Associates LLC US Venture Capital Index® represents funds raised between 1981 and 2015. Table 1 shows private equity and venture capital returns based on the performance data collected versus indexes tracking large- and small-capitalization public equities—the Nasdaq Composite, the Russell 2000®, and the S&P 500.
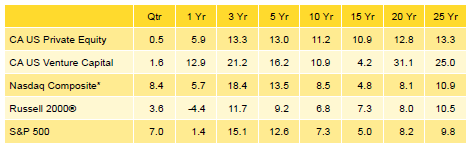
Table 1. US Private Equity and Venture Capital Index Returns
Periods Ended December 31, 2015 • US$ Terms • Percent (%)
Sources: Cambridge Associates LLC, Frank Russell Company, Standard & Poor’s, and Thomson Reuters Datastream.
Notes: Private indexes are pooled horizon internal rates of return, net of fees, expenses, and carried interest. Public indexes are average annual compound returns (time-weighted returns). Because the US Private Equity and Venture Capital indexes are capital weighted, the largest vintage years mainly drive the indexes’ performance.
* Capital change only.
Fourth Quarter and Calendar Year 2015 Highlights
- As detailed in Table 1, the toughest time periods for the private equity index versus public equities were the most recent quarter and the three-year period, due to strong public market performance in 2013 and the negative impact from private energy investments in 2014 and 2015. The venture capital index has had more success in outperforming the public markets, only underperforming all three public indexes listed in the latest quarter and 15-year period. The underperformance of the venture capital index in the 15-year horizon is due to the tech bubble at the beginning and the global financial crisis later in the period.
- As of December 31, 2015, public companies accounted for 14.7% of the private equity benchmark and 12.4% of the venture capital benchmark. Exposure to non-US companies was 18.0% and 10.0% for the private equity and venture capital benchmarks, respectively.
- In 2015, in both private equity and venture capital, the best performing sectors were health care, software, and IT (in rank order).
Private Equity Performance Insights
Elements of the investment environment during fourth quarter 2015 resembled the environment a year earlier, including low commodity prices and a strong dollar. However, in 2015, the tech-heavy Nasdaq and S&P 500 indexes bested the small company index, the Russell 2000®, in fourth quarter, while the Cambridge Associates LLC US Private Equity Index® again posted only a modestly positive return (0.5%). For the year, the index returned 5.9%, a steep decline from the prior two years, when the index earned double-digit returns. Looking at fourth quarter 2015 results for 16 vintage years (2000–15), nine vintages earned negative returns and seven vintages produced positive ones. Asset values for companies across the private equity index increased about $1.2 billion in fourth quarter 2015, a sharp drop from the same period in 2014 when valuations rose by more than $6.0 billion.
According to Dealogic, five private equity–backed companies went public in the fourth quarter at a value of $3.6 billion. By number, it was the worst quarter of the year for private equity–backed initial public offerings (IPOs), but by value, it was the second best. During 2015, 45 private equity–backed companies went public, fetching $14.7 billion. In terms of both number and value, IPOs dropped significantly from each of the previous two years when there were more than 75 IPOs that were worth between $30 billion and $31 billion. Roughly half of the 2015 IPOs took place in energy, finance, health care, and technology.
Compared with the previous two years, merger & acquisition (M&A) activity involving private equity–backed companies was lower in both fourth quarter and 2015. Fourth quarter saw 164 M&A transactions, a decrease from the 214 in the third quarter. The values of 45 of those deals (27.4%) were disclosed to the public, a drop from the previous quarter’s 69 (32.2%). Based on publicly available data, the average transaction size rose from $548 million in third quarter to $972 million in fourth quarter, due largely to outsized real estate transactions. The 786 M&A transactions in 2015 were a decrease from the 814 in the prior year. The values of 246 deals were disclosed to the public in 2015, and the average size was $556 million per transaction.
Seven vintage years—2005–09, 2011, and 2012—represented 81% of the private equity index’s value at the end of 2015 (Table 2). Returns for all but one of these seven vintages (2008 was the exception) were flat to modestly positive in the fourth quarter, an improvement over the third quarter when all vintages suffered losses. For the fourth quarter, the returns among the key vintages ranged from -1.6% for the 2008 funds to 3.6% for the 2009 funds. In 2015, the IPO and M&A environments were muted amid a volatile year for public markets, and depressed energy prices negatively impacted unrealized valuations for a key sector.
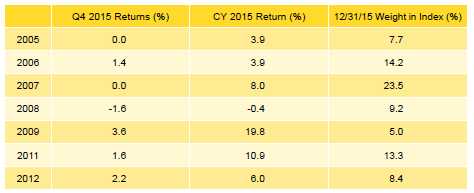
Table 2. Private Equity Vintage Year Returns: Net Fund-Level Performance
Note: Vintage year fund-level returns are net of fees, expenses, and carried interest.
With a flat return during fourth quarter, the largest vintage, 2007, slightly underperformed the index; the vintage’s performance was driven mostly by losses in energy and gains in health care and industrials. For the full year, vintage year 2007 funds benefited most from elevated valuations in the health care sector, but write-ups in consumer (second largest), IT, software, and industrials were also substantial; write-downs in energy equaled more than $5 billion for the year. In the second largest vintage year, 2006, IT was the only large sector with sizable gains, and for the year, software and health care were up big but energy losses cost the vintage. For the quarter and year’s best-performing vintage, 2009, health care and consumer gains surpassed losses in financial services in the quarter, and the consumer, IT, and health care sectors were the largest positive contributors to performance over the year.
Five of the Seven Key Sectors in the Private Equity Index Earned Positive Returns for the Quarter; Energy and Financial Services Were the Exceptions. All but two of the seven meaningfully sized sectors (representing at least 5% of the index) produced positive returns during fourth quarter 2015 (Table 3). The four largest sectors—consumer, energy, health care, and IT—composed more than 58% of the index’s total value and returned between -8.4% and 4.4%. On a dollar-weighted basis, those four sectors earned a gross return of -0.4%, underperforming the total benchmark’s gross performance by 0.6%. Among the seven meaningfully sized sectors, IT posted the highest return for the quarter; the 2006 vintage year contributed most to the performance and accounted for 20% of the sector’s market value at year end. The energy sector’s strongly negative return resulted largely from write-downs of more than $500 million each in vintage years 2006–08, 2010–11, and 2013. During the quarter, 82% of the capital deployed by fund managers was allocated to six sectors (from highest to lowest): consumer, energy, financial services, IT, health care, and software. This percentage is nearly 11% higher than historical norms, and the overweights were to consumer, energy, and financial services.
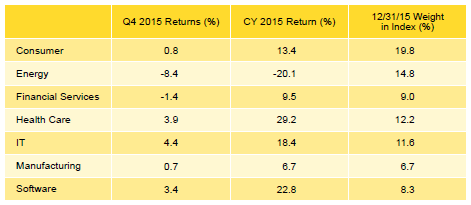
Table 3. Private Equity Sector Returns: Gross Company-Level Performance
Note: Industry-specific gross company-level returns are before fees, expenses, and carried interest.
For the second year in a row, the best- and worst-performing sectors were health care and energy, respectively. Write-ups for health care companies totaled nearly $11 billion in vintage years 2007, 2006, and 2011 (in rank order), which represented 65% of the sector’s yearly gains. Software was the only other sector that earned more than 20% for the year, with vintage years 2006, 2007, and 2011 contributing significantly to the sector’s performance. The 2007 and 2008 vintages were the largest negative contributors to the energy sector’s return for the year, representing half of the sector’s write-downs; in virtually every vintage year, energy company valuations suffered. The four largest sectors—consumer, energy, health care, and IT—earned 6.8% for the year, underperforming the benchmark’s total gross return by 1.3%.
Distributions and Contributions Fall From 2014 Levels. In the fourth quarter, managers in the US private equity index called $23.7 billion from limited partners and returned $36.7 billion, representing quarter-over-quarter increases of 29.0% and 3.9% in contributions and distributions, respectively. In dollar terms, the increases were $5.3 billion for capital calls and $1.3 billion for distributions.
Investors in funds launched in 2007 and 2011–14 contributed $19.8 billion, or 83% of the total capital called during the quarter; all five vintage years called more than $2 billion from their LPs. Conversely, eight vintage years (2004–09, 2011, and 2012) distributed more than $2 billion in the quarter. Investors in funds launched from 2005 through 2007 received $20.7 billion, or 56% of the capital distributed. Fourth quarter was the 16th consecutive period (and 19th of 21) where distributions were higher than contributions, the longest such streak in the index’s history.
During 2015, managers in the US private equity index called $78.3 billion from limited partners, $9.0 billion less than they called in 2014, the highest year for capital calls since 2008 (Figure 1). Total distributions in 2015 hit $140.6 billion, a drop of $17.8 billion from the record setting amount reached in 2014, and the fourth year in a row when distributions were more than $100 billion. Distributions stayed at a healthy level despite the increase in public market volatility, especially during the third quarter.
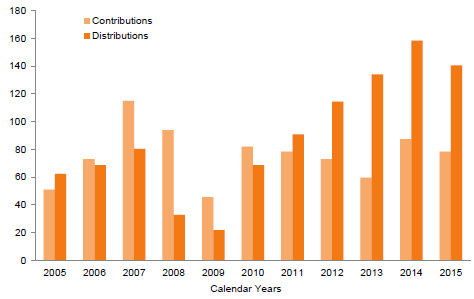
Figure 1. Private Equity Contributions and Distributions
2005–15 • US Dollar (billions)
Last year was the fifth in a row, but only the ninth since the inception of the private equity index, in which distributions outpaced contributions; the others were 1994, 1996, 2004, 2005, and 2011–14. From 2006 through 2010, when contributions surpassed distributions, private equity fund managers in the index called 1.5 times as much capital as they distributed; from 2011 through 2015, distributions outweighed contributions by a multiple of 1.7.
Venture Capital Performance Insights
Despite earning a double-digit return that was well above its average over the past 15 years, in 2015 the US venture capital index produced the eighth lowest annual return since 2001. As has been the case historically, health care, IT, and software were the largest contributors to the venture capital benchmark’s return during the year. The IPO market was relatively strong, particularly in the second quarter, and distributions hit their third highest annual level since 2000.
According to the National Venture Capital Association (NVCA) and Thomson Reuters, 77 venture-backed companies went public in 2015 for a total IPO offer value of $9.4 billion. The number and value of venture-backed IPOs were down 34% and 39%, respectively, from 2014. There were 372 venture-backed M&A deals during the year, 113 less than there were in 2014. For deals with values disclosed to the public, the average size of a venture-backed M&A transaction was $193.9 million, down nearly 44% in value from 2014, when it was $343.9 million.
While the venture capital index’s fourth quarter performance was much weaker than public equities, its return for the year was much stronger. In 2015, six of the eight meaningfully sized vintage years (Table 4) posted double-digit returns, and vintages 2011 and 2012 tied for the year’s best performance, 25.7%. Vintage years 2010 and 2012, which together accounted for 22% of the index, were the largest positive contributors to the index’s performance in the year. Significant write-ups in IT and health care contributed to the 2011 vintage year’s performance, and both sectors plus software were drivers for the 2012 vintage year’s strong return. The worst-performing vintage, 2005, saw robust write-ups in health care and software, which offset the hefty losses in chemicals and virtually flat returns for other sectors.
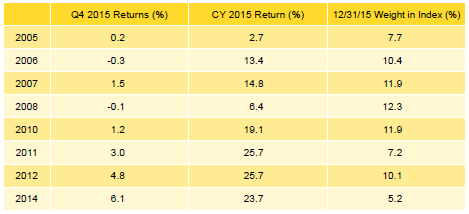
Table 4. Venture Capital Vintage Year Returns: Net Fund-Level Performance
Note: Vintage year fund-level returns are net of fees, expenses, and carried interest.
Health Care Posted the Highest Fourth Quarter and Annual Returns in 2015. The venture capital index remains concentrated by sector, with the three largest—IT, health care, and software—accounting for almost 82% of the index’s value (Table 5). About 86% of capital invested during the fourth quarter went into companies in these sectors, each seeing investments more than 10% higher than their long-term norms. Two of the three sectors, health care and IT, garnered more than $1 billion of investment during the fourth quarter. Among these three sectors, health care was the best performing for the quarter and the year, with 6.1% and 25.6% returns, respectively.
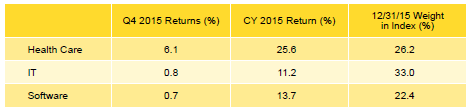
Table 5. Venture Capital Sector Returns: Gross Company-Level Performance
Note: Industry-specific gross company-level returns are before fees, expenses, and carried interest.
The annual returns posted by health care, IT, and software were driven by valuation increases of more than $4 billion for software and IT, as well as almost $10 billion for health care over the course of the year. Together, the three largest sectors returned 16.4% for the year, surpassing the total return for all portfolio companies by almost 1%.
2015 Venture Capital Calls and Distributions Decrease From Prior Year, Yet Distributions Reached Third Highest All-Time. In the fourth quarter, managers in the US venture capital index called $3.3 billion, a decrease of $584 million, or 15.1%, from the previous quarter. Fourth quarter distributions were $7.1 billion, 43.1% higher than the third quarter. Similar to their private equity counterparts, venture capital funds have now distributed more capital than they called in 16 straight quarters. The venture industry has not experienced a similar cash flow trend since the 1990s.
Managers of funds raised from 2012 to 2015 called $2.4 billion, or 74% of all capital called during the quarter. Each of the four vintages called more than $460 million, with the 2014 funds calling over $979 million. Seven vintage years returned more than $500 million to investors during the quarter. Distributions from the 2006 to 2008 vintages averaged $1.1 billion each, and the three combined to distribute 47% of the total.
Managers in the US venture capital index called and distributed less capital in 2015 than they did in 2014 (Figure 2). Contributions decreased 7.5% to $15.3 billion, and distributions decreased 12.3% to $28.0 billion. Distributions in 2015 were the third-highest annual total of all-time, trailing 2014 and the bubble year of 2000, when they totaled nearly $32 and $57 billion, respectively.
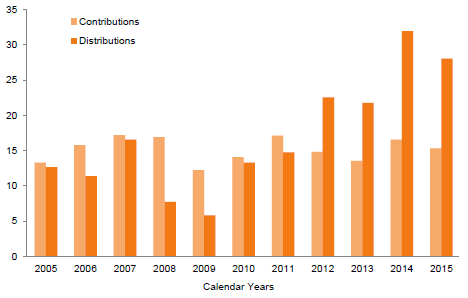
Figure 2. Venture Capital Contributions and Distributions
2005–15 • US Dollar (billions)
About the Cambridge Associates LLC Indexes
Cambridge Associates derives its US private equity benchmark from the financial information contained in its proprietary database of private equity funds. As of December 31, 2015 the database comprised 1,251 US buyouts, private equity energy, growth equity, and mezzanine funds formed from 1986 to 2015, with a value of $587.2 billion. Ten years ago, as of December 31, 2005, the index included 663 funds whose value was $208.0 billion.
Cambridge Associates derives its US venture capital benchmark from the financial information contained in its proprietary database of venture capital funds. As of December 31, 2015, the database comprised 1,619 US venture capital funds formed from 1981 to 2015, with a value of $193.5 billion. Ten years ago, as of December 31, 2005, the index included 1,101 funds whose value was $61.6 billion.
The pooled returns represent the net end-to-end rates of return calculated on the aggregate of all cash flows and market values as reported to Cambridge Associates by the funds’ general partners in their quarterly and annual audited financial reports. These returns are net of management fees, expenses, and performance fees that take the form of a carried interest.
Both the Cambridge Associates LLC US Venture Capital Index® and the Cambridge Associates LLC US Private Equity Index® are reported each week in Barron’s Market Laboratory section. In addition, complete historical data can be found on Standard & Poor’s Micropal products and on our website, www.cambridgeassociates.com.
About the Public Indexes
The Nasdaq Composite Index is a broad-based index that measures all securities (over 3,000) listed on the Nasdaq Stock Market. The Nasdaq Composite is calculated under a market capitalization–weighted methodology.
The Russell 2000® Index includes the smallest 2,000 companies of the Russell 3000® Index (which is composed of the largest 3,000 companies by market capitalization).
The Standard & Poor’s 500 Composite Stock Price Index is a capitalization-weighted index of 500 stocks intended to be a representative sample of leading companies in leading industries within the US economy. Stocks in the index are chosen for market size, liquidity, and industry group representation.