Overview
US private equity and venture capital funds had a good first quarter in 2017, as indicated by the Cambridge Associates LLC benchmark indexes of the two alternative asset classes. The Cambridge Associates LLC US Private Equity Index® returned 3.9%, slightly lower than its fourth quarter performance. Rebounding from a tough fourth quarter, the Cambridge Associates LLC US Venture Capital Index® returned 3.3%. In the public markets, the quarter was a better period for large caps than small, and the IPO market had a strong start to the year. Table 1 depicts performance for the private asset classes compared to the public markets. Cambridge Associates’ mPME calculation is a private-to-public comparison that seeks to replicate private investment performance under public market conditions.
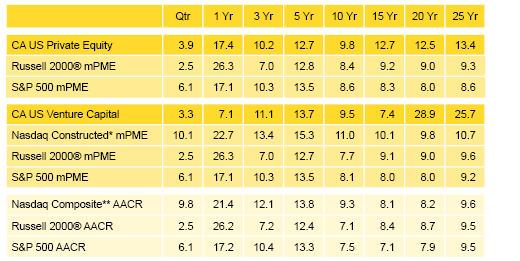
Table 1. US Private Equity and Venture Capital Index Returns
Periods Ended March 31, 2017 • USD Terms • Percent (%)
Sources: Cambridge Associates LLC, Frank Russell Company, Standard & Poor’s, and Thomson Reuters Datastream.
Notes: Private indexes are pooled horizon internal rates of return, net of fees, expenses, and carried interest. Because the US Private Equity and Venture Capital indexes are capitalization weighted, the largest vintage years mainly drive the indexes’ performance. Public index returns are shown as both time-weighted returns (average annual compound returns) and dollar-weighted returns (mPME). The CA Modified Public Market Equivalent replicates private investment performance under public market conditions. The public index’s shares are purchased and sold according to the private fund cash flow schedule, with distributions calculated in the same proportion as the private fund, and mPME net asset value is a function of mPME cash flows and public index returns.
* Constructed Index: Data from 1/1/1986 to 10/31/2003 represented by Nasdaq Price Index. Data from 11/1/2003 to present represented by Nasdaq Composite.
** Capital change only.
First Quarter 2017 Highlights
- As of March 31, 2017, the private equity benchmark had mixed success against the indexes tracking both large and small public companies in the time periods from one quarter to trailing five years; it outperformed the public markets in all time periods of ten years and longer. Similarly, the venture capital index has only bested all public indexes in the longest time periods listed in the table, struggling to beat the Nasdaq in particular over time periods shorter than 20 years.
- Public companies accounted for 13% of the private equity index and almost 15% of the venture capital index. Non-US company exposures in the private equity and venture capital indexes have remained fairly steady, sitting at roughly 17% in the private equity benchmark and about 8% in the venture capital index as of March 31, 2017.
Private Equity Performance Insights
- As of first quarter, seven vintage years represented at least 5% of the benchmark’s value, with returns for these meaningfully sized vintages ranging from 2.7% for vintage years 2006 and 2008 to 6.2% for vintage year 2012 (Table 2). The seven vintages combined represented 79% of the index’s value at quarter end. Four other vintage years—2005, 2009–10, and 2015—accounted for between 3.4% and 4.8% of the benchmark (for a total of nearly 16%). Performance for these vintages was in line with the index as a whole. The funds raised in the years leading up to the global financial crisis (2005–07) together accounted for about 31% of the index, which was nearly matched by the funds raised in the three years following the crisis (2010–12).
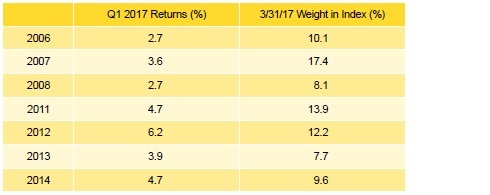
Table 2. Private Equity Vintage Year Returns: Net Fund-Level Performance
Note: Vintage year fund-level returns are net of fees, expenses, and carried interest.
- Five sectors produced strong gains for the 2009 vintage, led by IT and industrials. IT companies dominated the write-ups in the vintage year 2006 funds, which tied with the 2008 vintage for the quarter’s lowest return among the large vintage years. For the 2008 vintage, gains in industrials, financials, and IT were partially offset by write-downs in energy. The top-sized 2007 vintage enjoyed widespread write-ups in all the key sectors.
- During first quarter, fund managers called $22.2 billion, a nearly 15% decrease from the previous quarter. Limited partner distributions equaled $32.2 billion, an 18% drop quarter-over-quarter but fairly close to the average quarterly distribution amount over the past five years ($34.5 billion). Over the last six and a quarter years, distributions have outpaced contributions in 22 of 25 quarters for a distributions/contributions ratio of 1.6. In the preceding six years (2005–10), contributions outnumbered distributions at a ratio of 1.4.
- Six vintage years (2011–16) called between $2.0 billion and $7.1 billion for a total of nearly $21 billion, or 93% of the total called. The funds raised in 2014 called $7.1 billion, 32% of the total. Vintage year 2007 alone represented about a quarter of the LP distributions. Nine vintages (2001, 2005–08, and 2010–13) distributed more than $1 billion. Vintages 2005–07 together distributed $17.1 billion, or 53% of the total.
- Figure 1 shows the GICS sector breakdown of the private equity index and a public market counterpart, the Russell 2000® Index. The breakdown provides context when comparing the performance of the two indexes. The chart highlights the relative overweights in the private equity index, such as IT, consumer discretionary, and energy, and the underweight in financials.
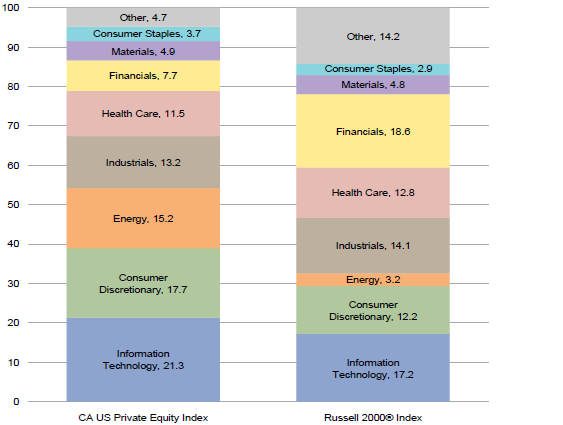
Figure 1. GICS Sector Comparisons: CA US Private Equity vs Russell 2000®
As of March 31, 2017 • Percent (%)
Sources: Cambridge Associates LLC, FactSet Research Systems, and Frank Russell Company.
Notes: The Global Industry Classification Standard (GICS®) was developed by and is the exclusive property and a service mark of MSCI Inc. and S&P Global Market Intelligence LLC and is licensed for use by Cambridge Associates LLC. Other includes sectors that make up less than 2% of the CA benchmark.
- Each of the six sectors that represented at least 5% of the private equity index earned positive returns during the quarter (Table 3). Four of the six, industrials, IT, health care, and financials (in rank order) rose more than 6%. Vintage years 2007–09 and 2011–12 were the biggest contributors to the industrial sector’s return. For the energy sector, which posted the lowest return among the key sectors, valuation increases were most significant in the 2012 and 2014 vintages.

Table 3. Private Equity Sector Returns: Gross Company-Level Performance
Note: Industry-specific gross company-level returns are before fees, expenses, and carried interest.
- Energy (23%), IT (16%), and consumer discretionary (16%) companies attracted 55% of all invested capital during the quarter, which is about 4 percentage points higher than the average invested in these sectors over the long term. Driving the difference is the percentage of capital allocated to energy, historically about 14% of invested capital.
Venture Capital Performance Insights
- All meaningfully sized vintage years, 2005–08 and 2010–14, posted positive returns in first quarter 2017. This is a stark difference from first quarter 2016 when only one of the eight largest vintage years posted a positive return. The range of quarterly returns for the meaningfully sized vintages in the venture capital index, 1.5% to 7.1% (Table 4), was much wider than in the private equity index, 2.7% to 6.2%.
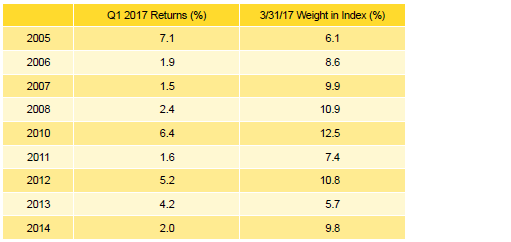
Table 4. Venture Capital Vintage Year Returns: Net Fund-Level Performance
Note: Vintage year fund-level returns are net of fees, expenses, and carried interest.
- The best-performing vintage, 2005, was driven by significant write-ups in IT. As for the lowest performer, 2007, most sectors were flat for the quarter with the exceptions of health care, IT, and industrials (in rank order).
- In the largest vintage, 2010, IT companies saw by far the biggest valuation increases and in the second largest vintage, 2008, health care was the primary contributor to write-ups.
- Venture capital fund managers called $3.2 billion from investors during first quarter, a 2.1% decrease from the previous quarter, and the third lowest quarterly level in the past six years (24 quarters). Distributions from venture funds were $5.1 billion, a 3.1% increase from fourth quarter. Distributions have outpaced contributions in every quarter over the past five and a quarter years.
- Funds formed from 2013 to 2016 were responsible for nearly 84% of the total capital called during the quarter; each of these four vintages called more than $300 million. Distributions from vintage years 2005–10 totaled almost $4 billion, representing about 77% of the total from the quarter. On average, these six vintages distributed about $650 million in the quarter.
- Figure 2 shows the GICS sector breakdown of the venture capital index and a public market counterpart, the Nasdaq Composite Index. The breakdown provides context when comparing the performance of the two indexes. The chart highlights the venture index’s relative overweights in IT and health care, and its underweights in consumer discretionary and financials.

Figure 2. GICS Sector Comparisons: CA US Venture Capital vs Nasdaq Composite
As of March 31, 2017 • Percent (%)
Sources: Cambridge Associates LLC, FactSet Research Systems, and Nasdaq Inc.
Notes: The Global Industry Classification Standard (GICS®) was developed by and is the exclusive property and a service mark of MSCI Inc. and S&P Global Market Intelligence LLC and is licensed for use by Cambridge Associates LLC. Other includes sectors that make up less than 2% of the CA benchmark.
- All three sectors that represented at least 5% of the value of the index had positive returns in first quarter (Table 5). The best return was earned by the health care sector, while the lowest was posted by consumer discretionary companies. The health care sector return was mostly driven by write-ups in the 2008, 2010, and 2013 vintage year funds, which together represented more than half of the sectors net positive valuation increase. Consumer discretionary performance was flat to modest in all vintages, with the 2010 funds accounting for the most write-ups.

Table 5. Venture Capital Sector Returns: Gross Company-Level Performance
Note: Industry-specific gross company-level returns are before fees, expenses, and carried interest.
- In keeping with historical norms, IT, health care, and consumer discretionary companies (in rank order) attracted the lion’s share of the dollars invested by venture capital managers in the index. At almost 87% of capital invested, the amount is in line with the long-term trend for the three sectors combined.
About the Cambridge Associates LLC Indexes
Cambridge Associates derives its US private equity benchmark from the financial information contained in its proprietary database of private equity funds. As of March 31, 2017, the database comprised 1,376 US buyouts, private equity energy, growth equity, and mezzanine funds formed from 1986 to 2017, with a value of $671 billion. Ten years ago, as of March 31, 2007, the index included 774 funds whose value was $294 billion.
Cambridge Associates derives its US venture capital benchmark from the financial information contained in its proprietary database of venture capital funds. As of March 31, 2017, the database comprised 1,718 US venture capital funds formed from 1981 to 2017, with a value of $193 billion. Ten years ago, as of March 31, 2007, the index included 1,205 funds whose value was $80 billion.
The pooled returns represent the net end-to-end rates of return calculated on the aggregate of all cash flows and market values as reported to Cambridge Associates by the funds’ general partners in their quarterly and annual audited financial reports. These returns are net of management fees, expenses, and performance fees that take the form of a carried interest.
About the Public Indexes
The Nasdaq Composite Index is a broad-based index that measures all securities (over 3,000) listed on the Nasdaq Stock Market. The Nasdaq Composite is calculated under a market capitalization–weighted methodology.
The Russell 2000® Index includes the smallest 2,000 companies of the Russell 3000® Index (which is composed of the largest 3,000 companies by market capitalization).
The Standard & Poor’s 500 Composite Stock Price Index is a capitalization-weighted index of 500 stocks intended to be a representative sample of leading companies in leading industries within the US economy. Stocks in the index are chosen for market size, liquidity, and industry group representation.