For the first half of 2018, returns for US private equity[1]“Private equity” refers only to US buyout and growth equity funds, and not to the CA US Private Equity Index®, which currently also includes energy-focused and subordinated capital funds. The … Continue reading and venture capital were strong, with only 1 percentage point (ppt) separating the performance of the two asset classes, as indicated by the Cambridge Associates LLC benchmark indexes. The Cambridge Associates LLC US Private Equity Index returned 9.1% from January through June (3.2% and 5.8% for first quarter and second quarter, respectively), shy of its 10.3% return for the previous six-month period. The Cambridge Associates LLC US Venture Capital Index® returned 10.2% for the same period (3.9% and 6.0% for first quarter and second quarter, respectively), a jump from the prior six months when US venture capital earned 6.4%. In the public markets, technology and small-cap companies outpaced large caps during the six-month period ended June 30, 2018. Figure 1 depicts performance for the private asset classes compared to the public markets. Cambridge Associates’ mPME calculation is a private-to-public comparison that seeks to replicate private investment performance under public market conditions.
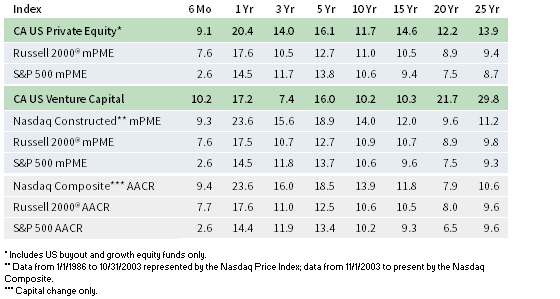
FIGURE 1 US PRIVATE EQUITY AND VENTURE CAPITAL INDEX RETURNS
Periods Ended June 30, 2018 • Percent (%)
Sources: Cambridge Associates LLC, Frank Russell Company, FTSE International Limited, Nasdaq, Standard & Poor’s, and Thomson Reuters Datastream.
Notes: Private indexes are pooled horizon internal rates of return, net of fees, expenses, and carried interest. Returns are annualized, with the exception of returns less than one year, which are cumulative. Because the US Private Equity and Venture Capital indexes are capitalization weighted, the largest vintage years mainly drive the indexes’ performance. Public index returns are shown as both time-weighted returns (average annual compound returns) and dollar-weighted returns (mPME). The CA Modified Public Market Equivalent replicates private investment performance under public market conditions. The public index’s shares are purchased and sold according to the private fund cash flow schedule, with distributions calculated in the same proportion as the private fund, and mPME net asset value is a function of mPME cash flows and public index returns.
* Includes US buyout and growth equity funds only.
** Constructed Index: Data from 1/1/1986 to 10/31/2003 represented by Nasdaq Price Index. Data from 11/1/2003 to present represented by Nasdaq Composite.
*** Capital change only.
First Half 2018 Highlights
- As of June 30, 2018, the private equity benchmark had outperformed the public indexes in all time periods. The venture capital index had mixed success against the various public market indexes, consistently outperforming only in the longest time periods listed in the table.
- Public companies accounted for nearly 13% of the private equity index and almost 11% of the venture capital index. Non-US company exposures in the private equity and venture capital indexes have remained fairly steady, sitting at roughly 18% in the private equity benchmark and close to 10% in the venture capital benchmark as of June 30, 2018.
US Private Equity Performance Insights
Vintage Years
As of June 2018, eight vintage years were meaningfully sized—representing at least 5% of the benchmark’s value—and, combined, accounted for 83% of the index’s value. Six-month returns among the meaningfully sized vintages ranged from 6.1% for vintage year 2016 to 14.4% for vintage year 2014 (Figure 2). Two other vintage years, 2008 and 2009, represented between 4.1% and 4.6% of the benchmark and their returns fell within the range of their larger peers. Despite its “age,” the 2007 vintage year remained the largest component of the index.
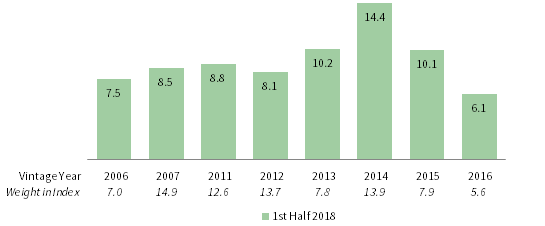
FIGURE 2 US PRIVATE EQUITY INDEX VINTAGE YEAR RETURNS:
NET FUND-LEVEL PERFORMANCE
As of June 30, 2018 • USD Terms • Percent (%)
Source: Cambridge Associates LLC.
Note: Vintage year fund-level returns are net of fees, expenses, and carried interest.
Reflecting the sector weighting in many of the largest vintages, IT was by far the largest contributor to the valuation increases in the 2014 and 2016 vintages. In each case, IT accounted for nearly 70% of the valuation increases. Write-ups were more widespread in the top-sized 2007 vintage, with IT, industrials, financials, and consumer discretionary posting significant gains.
During the first six months of the year, fund managers called $39.4 billion, a 19% decrease from the previous six months. Limited partner (LP) distributions equaled $60.3 billion, a 21% decline from the six months ending December 2017. Most of these declines can be attributed to first quarter activity, which showed a significant drop off from fourth quarter 2017. In both first quarter 2018 and second quarter 2018, the industry continued to distribute more capital than it called.
Seven vintage years (2011–17) each called more than $2 billion in first half 2018, led by vintages 2014–16, which called a combined $26.2 billion; the 2015 vintage called the most capital ($10.7 billion). Ten vintage years (2005–14) each returned $2 billion or more, for a total of almost $57 billion. Just three of those vintages—2006, 2007, and 2011—combined to distribute almost $30 billion, or nearly half of the total distributed during the period.
Sectors
Figure 3 shows the GICS sector breakdown of the private equity index and a public market counterpart, the Russell 2000® Index. The breakdown provides context when comparing the performance of the two indexes. The chart highlights the private equity index’s relative overweights in IT and consumer discretionary, and the underweight in financials. It is worth noting that the S&P redefined GICS sector classifications in September 2018 and, as a result, a large number of companies shifted from one sector to another, which will lead to different GICS sector breakdowns for both the public and private indexes in future analyses.
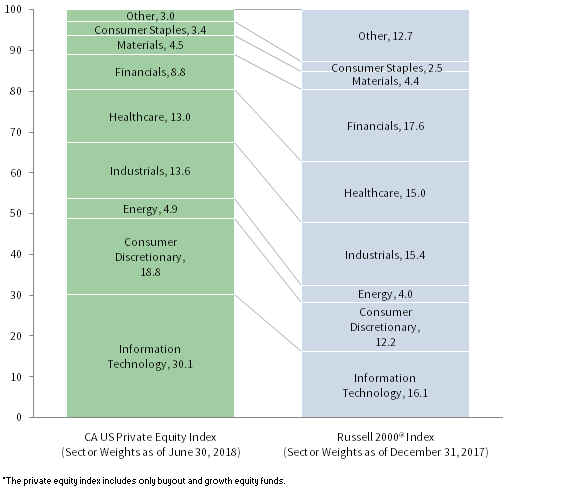
FIGURE 3 GICS SECTOR COMPARISONS: CA US PRIVATE EQUITY VS RUSSELL 2000®
Percent (%)
Sources: Cambridge Associates LLC, Frank Russell Company, and FTSE International Limited.
Notes: The private equity index includes only buyout and growth equity funds. The Global Industry Classification Standard (GICS®) was developed by and is the exclusive property and a service mark of MSCI Inc. and S&P Global Market Intelligence LLC and is licensed for use by Cambridge Associates LLC. The Russell 2000® exposures are as of December 31, 2017, and represent the index’s sector breakdown prior to the GICS® reclassification that went into effect after close of business (ET) September 28, 2018. Cambridge Associates LLC will implement the GICS® reclassification for private companies with the release of September 30, 2018 benchmark data. “Other” includes sectors that make up less than 3% of the CA benchmark.
As of June 2018, there were five meaningfully sized sectors. Six-month returns among the large sectors ranged from 8.5% (consumer discretionary) to 16.4% (IT) (Figure 4). Write-ups for IT companies were widespread and led by the 2014 vintage. IT performance was also strong in the public markets. In the consumer discretionary sector, write-downs in vintages 2004–06 were outnumbered by gains in most other vintages, led by 2012, 2007, and 2011 (in rank order).
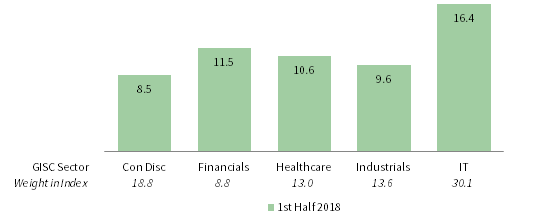
FIGURE 4 US PRIVATE EQUITY INDEX GICS SECTOR RETURNS:
NET FUND-LEVEL PERFORMANCE
As of June 30, 2018 • USD Terms • Percent (%)
Source: Cambridge Associates LLC.
Note: Industry-specific gross company-level returns are before fees, expenses, and carried interest.
IT (42%), industrials (14%), consumer discretionary (13%), and healthcare (10%) companies attracted 79% of all invested capital during first half 2018, which is about 7 ppts higher than the average invested in these sectors over the long term. Driving the difference is the percentage of capital allocated to IT, which historically was about 22% of invested capital.
US Venture Capital Performance Insights
Vintage Years
Venture managers returned 10.2% for the first six months of 2018 with all meaningfully sized vintage years, 2006–08 and 2010–16, earning positive returns for the period (Figure 5). Six of the ten large vintages—2006, 2010, 2012–13, and 2015–16—posted double-digit returns. First half 2018 performance was much higher than that of the last six months of 2017, when the benchmark returned 6.4% for the period.
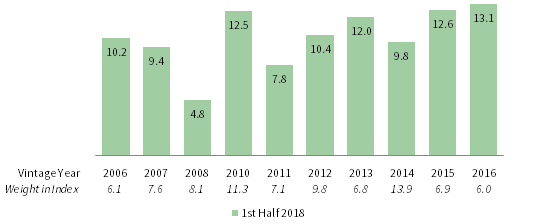
FIGURE 5 US VENTURE CAPITAL INDEX VINTAGE YEAR RETURNS:
NET FUND-LEVEL PERFORMANCE
As of June 30, 2018 • USD Terms • Percent (%)
Source: Cambridge Associates LLC.
Note: Vintage year fund-level returns are net of fees, expenses, and carried interest.
Similar to private equity, IT company valuation changes were the primary drivers of the semi-annual returns for the best- and worst-performing vintage years, as well as the largest vintages. The best-performing vintage, 2016, enjoyed significant write-ups in IT and healthcare, and the lowest performer, 2008, experienced 86% of its net appreciation change from IT. For the 2014 vintage (the largest in the index), healthy write-ups in IT and healthcare were significant contributors, seeing about $1.3 billion and $800 million in write-ups, respectively.
Venture capital fund managers called $9.3 billion from investors during the first six months, a 5.7% increase from the last six months of 2017, and the third largest semi-annual inflow, behind the first six months of 2000 and the last six months of 2000, both of which experienced about $12 billion in capital calls. Distributions from venture funds were $14.9 billion, a 25.1% increase from second half 2017, and the sixth largest semi-annual output since the inception of the benchmark.
Funds formed from 2014 to 2017 were responsible for 87% ($8.2 billion) of the total capital called during the first six months. These four vintage years each called $1.5 billion or more; the 2016 vintage led the way with capital calls of more than $3.4 billion. Distributions from vintage years 2005–08, 2010, 2012, and 2014 totaled $11.4 billion, representing almost 76% of the total of the semi-annual period. These seven vintages each distributed an average of about $1.6 billion in the first six months.
Sectors
Figure 6 shows the GICS sector breakdown of the venture capital index and a public market counterpart, the Nasdaq Composite Index. The breakdown provides context when comparing the performance of the two indexes. The chart highlights the venture index’s relative overweights in healthcare and IT, and its underweights in consumer discretionary and financials. It is worth noting that the S&P redefined GICS sector classifications in September 2018 and, as a result, a large number of companies shifted from one sector to another, which will lead to different GICS sector breakdowns for both the public and private indexes in future analyses.

FIGURE 6 GICS SECTOR COMPARISONS: CA US VENTURE CAPITAL VS NASDAQ COMPOSITE
Percent (%)
Source: Cambridge Associates LLC, Nasdaq, and Factset Research Systems.
Notes: The Global Industry Classification Standard (GICS®) was developed by and is the exclusive property and a service mark of MSCI Inc. and S&P Global Market Intelligence LLC and is licensed for use by Cambridge Associates LLC. The Nasdaq Composite exposures are as of December 31, 2017, and represent the index’s sector breakdown prior to the GICS® reclassification that went into effect after close of business (ET) September 28, 2018. Cambridge Associates LLC will implement the GICS® reclassification for private companies with the release of September 30, 2018 benchmark data. “Other” includes sectors that make up less than 3% of the CA benchmark.
All three meaningfully sized sectors had positive returns in first half 2018 (Figure 7). IT earned the best return (13.7%), narrowly beating out the healthcare sector (13.5%), while consumer discretionary companies posted the lowest return (3.6%). The IT return was mostly driven by write-ups in the 2012, 2014–15, 2005 and 2010 vintage year funds (in rank order) which, combined, represented about 55% of the sector’s net appreciation change. Healthcare valuations were concentrated in four vintages, 2010 and 2013–15. Consumer discretionary was relatively flat across all vintages with the exception of 2008 and 2014, which both returned slightly more than $100 million in write-ups for the period.
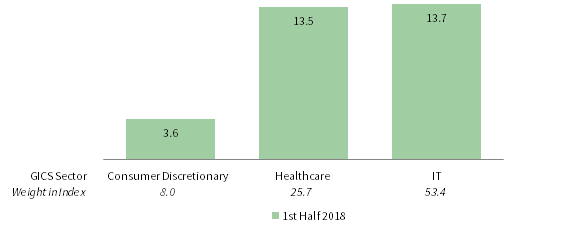
FIGURE 7 US VENTURE CAPITAL INDEX GICS SECTOR RETURNS:
NET FUND-LEVEL PERFORMANCE
As of June 30, 2018 • USD Terms • Percent (%)
Source: Cambridge Associates LLC.
Note: Industry-specific gross company-level returns are before fees, expenses, and carried interest.
In keeping with historical norms, during the first six months, venture capital managers in the index allocated the lion’s share of their investments to IT, healthcare, and consumer discretionary companies (in rank order). At 85% of capital invested, the amount is about 2% lower than the long-term trend for the three sectors combined.
Caryn Slotsky, Senior Investment Director
Jacob Gilfix, Senior Investment Associate
Sarah Grifferty, Investment Associate
About the Cambridge Associates LLC Indexes
Cambridge Associates derives its US private equity benchmark from the financial information contained in its proprietary database of private equity funds. As of June 30, 2018, the database included 1,105 US buyouts and growth equity funds formed from 1986 to 2018, with a value of $615 billion. Ten years ago, as of June 30, 2008, the index included 692 funds whose value was $335 billion.
Cambridge Associates derives its US venture capital benchmark from the financial information contained in its proprietary database of venture capital funds. As of June 30, 2018, the database comprised 1,807 US venture capital funds formed from 1981 to 2018, with a value of $224 billion. Ten years ago, as of June 30, 2008, the index included 1,271 funds whose value was $94 billion.
The pooled returns represent the net end-to-end rates of return calculated on the aggregate of all cash flows and market values as reported to Cambridge Associates by the funds’ general partners in their quarterly and annual audited financial reports. These returns are net of management fees, expenses, and performance fees that take the form of a carried interest.
About the Public Indexes
The Nasdaq Composite Index is a broad-based index that measures all securities (over 3,000) listed on the Nasdaq Stock Market. The Nasdaq Composite is calculated under a market capitalization–weighted methodology.
The Russell 2000® Index includes the smallest 2,000 companies of the Russell 3000® Index (which is composed of the largest 3,000 companies by market capitalization).
The Standard & Poor’s 500 Composite Stock Price Index is a capitalization-weighted index of 500 stocks intended to be a representative sample of leading companies in leading industries within the US economy. Stocks in the index are chosen for market size, liquidity, and industry group representation.
Footnotes