Slowing buyback activity is a sure sign it’s getting late in the current market cycle, but we expect buybacks to continue fueling the market for now. Specifically, buyback activity remains concentrated among some of the least indebted, most cash-abundant businesses. Current economic conditions combined with recent and prospective policy developments would seem to support a steady (albeit slower) pace of buybacks going forward.
With US buybacks in dollar volume terms having approached record levels last year and the pace of share repurchases recently slowing, some investors are concerned that an important support for the market is starting to wane. Although buyback activity has likely peaked for this cycle and could continue to slow in the coming quarters, our analysis suggests that it should remain resilient in the near term. In this paper, we assess how important a component of US equity returns buybacks have been this cycle, both from a demand and earnings standpoint; review the signs that share repurchases have peaked for the cycle; and discuss potential near-term supports to buyback activity.
How Much Have Buybacks Mattered?
At first glance, buyback activity this cycle appears to have matched the exuberance for share repurchases observed in the run-up to the global financial crisis. Trailing four-quarter buybacks for the S&P 500 Index touched $589 billion in the period ended first quarter 2016, just shy of the $590 billion all-time record set in third quarter 2007 (Figure 1). However, a dollar volume comparison does not account for share price appreciation. When measured in average market value terms, this cycle’s buyback activity has been far less extraordinary (Figure 2). Said another way, buyback activity this cycle in share count terms has been far less prolific than last cycle. In addition, buyback activity in dollar volume terms has been falling now for five consecutive quarters, and buybacks were just 2.6% of average market value for the four-quarter period ended second quarter 2017, even as US share prices continued to rise to new peaks. So just how important have buybacks been to supporting US equities?
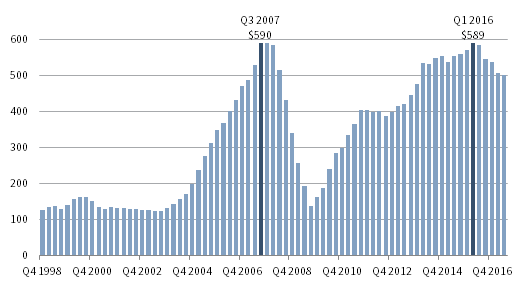
FIGURE 1 S&P 500 BUYBACKS: DOLLAR VOLUME
Fourth Quarter 1998 – Second Quarter 2017 • Trailing Four Quarters • USD Billions
Source: Standard & Poor’s.
Note: Buyback figures for second quarter 2017 are preliminary.
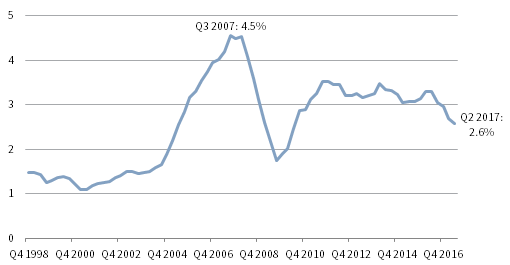
FIGURE 2 S&P 500 BUYBACKS: DOLLAR VOLUME AS A PERCENTAGE OF INDEX MARKET VALUE
Fourth Quarter 1998 – Second Quarter 2017 • Trailing 12 Months • Percent (%)
Sources: Standard & Poor’s and Thomson Reuters Datastream.
Notes: Data represent the dollar value of aggregate S&P 500 quarterly buybacks as a percentage of the average quarterly index free float–adjusted market capitalization. This quarterly ratio is summed across a trailing four-quarter period.
Buybacks Still Driving US Equity Demand, Despite Increasing Flows from ETFs. Buybacks have been an increasingly important source of demand for US equities. Over the current cycle, roughly 80% of S&P 500 companies on average have conducted buybacks (and roughly 60% bought back more than 1% of stock per year) versus just 40% of companies 25 years ago. From 2014 to 2016, US companies spent $1.7 trillion in buybacks, spending no less than $500 billion in any 12-month period during that time.
Net buybacks of US equities have exceeded aggregate net demand every year since 2010 (Figure 3). In 2016, they exceeded the next largest source, equity exchange-traded funds (ETFs), by a multiple of six! The trend has continued into 2017, with net buybacks of $136 billion in first quarter the largest driver of US equity demand, despite a notable pickup in ETF purchases. Goldman Sachs has estimated net buybacks by public US corporations will equal $640 billion this year, driven by positive earnings growth, near-record cash ratios, and below-average capacity utilization. The forecast for buyback activity in 2017 compares to $250 billion of estimated demand from equity-focused ETFs, which would be an all-time record. Based on this data, buybacks will likely continue to be the primary driver of US equity demand, at least in the near term.
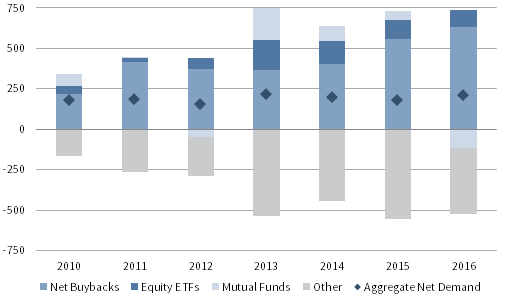
FIGURE 3 SOURCES OF DEMAND FOR US EQUITIES
2010–16 • US Dollar (billions)
Sources: Federal Reserve Board, Goldman Sachs Investment Research, and Thomson Reuters Datastream.
Note: The other category includes demand from foreign investors, life insurance, pension funds, and households, as well as US investors’ demand for foreign equities.
Buybacks Have Supported Earnings Growth in Per Share Terms. In recent years, net buybacks have been accretive to earnings per share (EPS) growth at the aggregate index level. Over the last five years, we estimate that a shrinking S&P 500 index divisor, driven in some part by a declining share count due to buybacks, has added approximately 1.0% on average to quarterly year-over-year EPS growth (Figure 4). This boost was particularly helpful during the commodity-related earnings recession of 2015–16, when aggregate earnings declined on a year-over-year basis for six consecutive quarters.
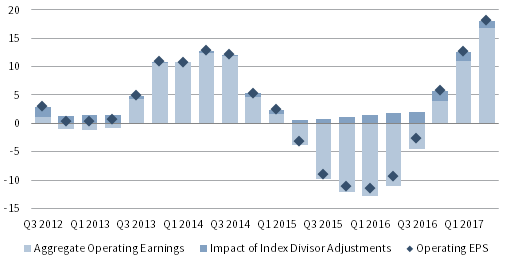
FIGURE 4 ESTIMATED IMPACT OF BUYBACKS ON S&P 500 OPERATING EPS
Third Quarter 2012 – Second Quarter 2017 • Year-over-Year Change (%)
Sources: Standard & Poor’s and Thomson Reuters Datastream.
Notes: Second quarter 2017 buyback figures are preliminary. The index divisor is calculated as aggregate S&P 500 free float-adjusted market capitalization divided by the price index level. Reasons for Index Divisor Adjustments include: a change in shares outstanding due to share repurchases or secondary issuance, a change in a company’s investable weight factor based on the free float–adjusted market cap, a company added to or deleted from the index, a special dividend, or a rights offering.
On a company level, the median company in the S&P 500 has also shrunk its share count by approximately 1.0% on average over the past five years (Figure 5). In addition, the percentage of S&P 500 companies in the index pursuing buybacks noticeably accretive to EPS—defined by Standard & Poor’s as a greater than 4% decline in the share count on a year-over-year basis—averaged over 20% between 2011 and 2016. These data points speak to the popularity of share repurchases as a means to return capital to shareholders and support EPS growth this cycle.
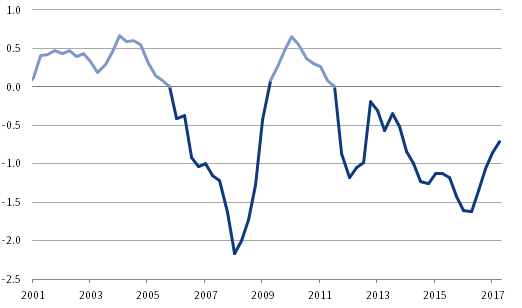
FIGURE 5 MEDIAN SHARE COUNT CHANGE FOR S&P 500 COMPANIES
First Quarter 2001 – Second Quarter 2017 • Year-Over-Year Percent Change (%)
Sources: FactSet Research Systems and Standard & Poor’s.
Can the Financial Engineering Continue?
Several signs point to buybacks having already peaked for this cycle. As noted earlier, through second quarter 2017, quarterly buybacks have shrunk on a year-over-year basis for five consecutive quarters. Further, the percentage of S&P 500 companies with share counts that fell by more than 4% year-over-year (i.e., those companies most likely to have significant buyback programs) dropped by 6 percentage points in second quarter 2017 to approximately 14%. Concentration of buyback purchases is also now beginning to return to more normal levels. This cycle, the concentration of buyback activity among the top 20 companies in terms of completed annual buybacks in dollar volume terms had steadily declined as an increasing number of companies completed buybacks, hitting a low in 2015. Starting in 2016 through the first half of 2017, concentration increased, suggesting that buyback activity may not be as widespread going forward.
The sources of cash to complete buybacks depend on the specific stocks involved, but an important trend in this cycle of historically low interest rates has been the decision by some companies to issue inexpensive debt to fund buybacks. According to J.P. Morgan, more than 20% of the dollar buyback volume has been funded with debt over the past five years, with this figure peaking at an all-time high of just below 35% in late 2016. Certain companies with significant cash holdings and earnings stranded offshore for tax reasons, such as Apple, have issued debt as a tax-efficient means to return some of that capital to shareholders. Receptive capital markets, characterized by strong demand for corporate debt, have helped.
However, some firms have purposefully sought to leverage up their balance sheets by issuing cheap debt to fund share repurchases to lower their overall cost of capital. According to Barclays, dividends and buybacks for the S&P 500 ex financials have exceeded free cash flow (measured as cash flow from operations net of capex) since 2013. Partly as a result of this activity, leverage ratios have been steadily ticking up in recent years, with net debt-to-EBITDA (i.e., earnings before interest, tax, depreciation, and amortization, a proxy for cash flow) for the S&P 500 Index at the highest point in the cycle. Furthermore, net debt-to-EBITDA at the median company is at an all-time high based on observations since 1997, and according to research by Barclays, leverage ratios for certain S&P 500 companies are bumping up against important thresholds that potentially threaten their investment grade ratings.
As a result, debt-financed buyback activity is likely to continue slowing going forward, and buyback volumes have likely peaked for this cycle. However, we do not expect buyback activity to fall off a cliff in the coming quarters. Stable economic growth, modest capital spending expectations, still-high corporate cash balances, along with certain one-off drivers like the bank stress test results and prospects for a repatriation tax holiday, both discussed below, will support buyback activity in the quarters ahead, even if the dollar volume is unlikely to return to the cycle peak.
Bank Stress Test Results. On June 28, the Federal Reserve announced the results of its Comprehensive Capital Analysis and Review (CCAR), more commonly known as the bank “stress tests.” The Fed’s report noted all 34 banks tested showed sufficient levels of capital and only one bank (Capital One) was required to resubmit a conditional capital plan. After the release of these results, banks immediately started announcing payouts. Year-to-date, 25 banks have announced just over $100 billion in planned share buybacks.
Among the largest announcements were J.P. Morgan, Citigroup, and Bank of America, which immediately authorized repurchases of $19.4 billion, $15.6 billion, and $12.0 billion, respectively, following the stress test results. Year-to-date in 2017, the broader S&P 500 financial sector has seen a 40% increase in buyback announcements relative to 2016. These recent developments in the financial sector could provide a short-term boost to the aggregate amount of buybacks over the next few quarters.
Homeland Investment Act 2.0? US companies still sit on massive cash reserves, seemingly giving them the option to increase shareholder distributions, however this cash is concentrated among a small number of sectors and companies. The ratio of cash to assets of the S&P 500 ex financials was nearly 17% as of June 30, the highest level based on observations since 1985. In addition, Moody’s recently estimated that listed US non-financial companies held $1.3 trillion in cash overseas. This represents over two-thirds of the $1.8 trillion held in total by non-financials.[1]Please see Moody’s Investors Service, “Cash pile grows 9.2% to $1.84 trillion, tech extends lead over other sectors,” July 19, 2017. With cash repatriations typically taxed at high levels—as much as 35%—companies will likely continue to let overseas cash positions grow, absent some type of tax reform. The cash-rich information technology sector, with total cash holdings above $800 billion and of which up to 75% may be held offshore, would be a major beneficiary of any repatriation tax break and therefore is expected to continue to be a major driver of buyback activity going forward. Unsurprisingly, three blue-chip IT companies—Apple, Microsoft, and Oracle—have been among the top five stocks in terms of completed buyback dollar volume since 2010, and were also among the top five non-financial issuers with the largest cash and marketable investment positions as of year-end 2016.
House Republicans have proposed a one-time tax holiday, which would assess a tax of 8.75% on overseas cash and a tax of 3.5% on previously untaxed earnings held offshore; the Trump administration has made a similar proposal. Goldman Sachs estimates that S&P 500 companies could repatriate $250 billion of overseas capital in 2018 if such a holiday were enacted next year. In addition, S&P Global Ratings estimates that the top 1% (in terms of cash holdings) of non-financial companies could repatriate more than $700 billion over time. A previous one-time tax holiday, part of the Homeland Investment Act (HIA) in 2004, seemed to provide a strong boost to buybacks. The Act permitted the repatriation of foreign earnings at a tax rate of just 5.25%. Analysis from the National Bureau of Economic Research indicated that about $300 billion was repatriated by US multinationals during 2005 alone, and that an estimated $0.79 of every $1.00 of repatriated capital was allocated to share purchases.[2]Dhammika Dharmapala, C. Fritz Foley, and Kristin J. Forbes, “Watch What I Do, Not What I Say: The Unintended Consequences of the Homeland Investment Act,” NBER Working Paper No. 15023, June 2009. However, recent research by Deutsche Bank suggests that the surge in buybacks in 2005 was driven much more by cyclical conditions than by passage of the HIA.
Although such a holiday would provide a one-time support to buybacks, ongoing US political gridlock threatens to delay the tax reform process and the specific details and timetable of these policies remain to be seen. In a recent interview, Senator Diane Feinstein of California indicated that Congress and the technology sector remain far apart in their expectations for a repatriation tax rate. Depending on the ultimate timing and specifics of any tax reforms, companies could prioritize repatriated funds for other purposes, such as debt reduction, capital expenditures, or increased merger & acquisition activity, given that it is now later in the current market cycle and stock valuations are considerably higher today compared with 2005.
The Bottom Line
The buyback train is slowing but hasn’t stopped yet. While increasing leverage may constrain the ability of some companies to maintain their recent pace of share repurchases, buyback activity remains concentrated among some of the least indebted, most cash-abundant businesses in the market. In addition, current economic conditions, in combination with recent and prospective policy developments, would seem to support a steady, albeit slower, pace of buybacks going forward. The recent positive stress test results for the largest US banks caused a jump in new buyback authorizations from the financial sector and, despite ongoing gridlock in Washington, a repatriation tax holiday would appear to be “low-hanging fruit” for a tax reform bill that Republicans will face increasing pressure to pass in the run-up to the 2018 mid-term elections. Slowing buyback activity is a sure sign that it’s getting late in the current market cycle; however, we expect this gravy train to continue fueling the market for now.
Michael Salerno, Senior Investment Director
Sean Duffin, Manager
Nroop Bhavsar, Senior Investment Associate
Footnotes