Our examination of incorporation of environmental, social, and governance factors into the stock selection process for two major MSCI indexes finds evidence that ESG factors added value in emerging markets equities but not developed markets equities
- Examination of the first three years data for the new MSCI Emerging Markets ESG Index provides early but consistent evidence that ESG–based stock selection can add value after accounting for the impact of other factors such as style, country, and sector exposure. Analysis of available ESG data for the preceding six and half years broadly indicates the same.
- For the nearly six-year period that could be examined for developed markets, MSCI World ESG slightly underperformed MSCI World, much of which was attributable to poor selection of US stocks.
- Given these findings, investors evaluating managers would do well to focus on understanding if and how the manager incorporates ESG factors, for what reason and how consistently, and whether ESG-based stock selection has added value to their funds.
Kyle Johnson, “Environmental, Social, and Governance (ESG) Integration: For Performance, For Ethics, or for Both?,” Cambridge Associates Research Report, 2010.
Since our 2010 report examining environmental, social, and governance (ESG) factors in investing and encouraging investors with interest in ESG factors to assess whether their interest arises from ethics, performance, or both, many more investors have begun to consider ESG and sustainability factors as part of their investment process. As of April 2015, the United Nations Principles for Responsible Investment (UNPRI) had 1,380 signatories, both asset managers and asset owners, nearly double the amount from 2010.
A 2015 report by Oxford University and the ESG-focused manager Arabesque Partners[1]Gordon L. Clark, Andreas Feiner, and Michael Viehs, “From the Stockholder to the Stakeholder: How Sustainability Can Drive Financial Outperformance,” University of Oxford and Arabesque Partners, … Continue reading reviewed over 200 academic studies on sustainability to assess the impact of sustainable practices on business and investments. In 88% of 51 studies focused on operational performance, solid ESG practices resulted in superior operational performance of companies, and in 80% of 41 studies focused on financial market performance, companies’ stock price performance was positively correlated to good sustainability practices.
Yet other research has shown that while some ESG issues may be material for investment performance, many others are not.[2]See, for example, Mozaffar Khan, George Serafeim, and Aaron Yoon, “Corporate Sustainability: First Evidence on Materiality,” The Accounting Review, March 9, 2015, as well as Seb Beloe, “What Do … Continue reading This brings into question the value of broader ESG indicators for selecting stocks versus more specific data on the ESG pillars—for example, data on various governance issues are generally considered to be more material to investment performance, and are more widely used even by investors that don’t consider themselves “ESG” focused. Adoption of environmental and social factors is less mainstream. When looking at broad ESG factors, some studies conclude they must be used in more nuanced ways to add value or combined with other investment metrics. For example, focusing on ESG “momentum” by buying companies showing improvement in ESG ratings has improved performance relative to focusing on the rating itself,[3]Zoltán Nagy, Altaf Kassam, and Linda-Eling Lee, “Can ESG Add Alpha? An Analysis of ESG Tilt and Momentum Strategies,” MSCI ESG Research, June 2015. while, as one might expect, combining ESG data with standard financial metrics has shown more positive results than using ESG data on a standalone basis.[4]See, for example, Natalie A. Trunow and Joshua Linder, “Perspectives on ESG Integration in Equity Investing: An Opportunity to Enhance Long-Term, Risk-Adjusted Investment Performance,” Calvert … Continue reading
Further, often due to ESG data availability, many studies only examine recent periods, where the equity styles that have outperformed (e.g., quality-focused growth) are those that selection based on positive ESG factors would tend to tilt toward and the sectors that have underperformed (e.g., energy and materials) are those that selection based on positive ESG factors would typically tilt away from. ESG-based stock selection can also introduce a size or geographic bias relative to more standard exposure. In other words, some would argue that after accounting for other factors, the underlying contribution of ESG data to investment outperformance is marginal, and the highest returns ultimately go to those unencumbered by sustainability or other ESG constraints. Assessing this argument has been difficult to date as few studies look at the contribution to performance of the various factors.
Thus, the aim of this paper is to specifically look at the contribution to performance of ESG-based stock selection. We examine the MSCI World Index and MSCI Emerging Markets Index (“World” or “EM”) two widely used benchmarks[5]The MSCI Emerging Markets Index represents a free float–adjusted market capitalization index that is designed to measure equity market performance of emerging markets. As of October 2016, the MSCI … Continue reading that each have an ESG-focused version (MSCI World ESG Index, or “World ESG,” and MSCI Emerging Markets ESG Index, or “EM ESG”). Data are available from late 2010 in the former case and mid-2013 in the latter case. Recognizing the short period of our analysis, we believe our findings are interesting nonetheless.
In summary, our analysis finds that the method employed for selecting stocks from MSCI World on ESG factors has had little effect on performance over the nearly six-year period for which data are available. In emerging markets, we observe a substantial effect for the first three years of the ESG-focused version of this index. We extend our analysis by looking at the years prior to the index launch when MSCI was building out ESG ratings for emerging markets. Although coverage is limited, we find evidence that ESG ratings were a strong source of stock-specific alpha during most of this earlier six and half year period as well.
After providing some background on these indexes, we delve into the analysis, looking at how much of the ESG index excess returns are explained by style, sector, country, and currency exposure versus ESG-based stock selection. For emerging markets, we also examine the value of the more limited ESG data before the live index. Finally, we advance some hypotheses for why ESG selection factors have mattered more for emerging markets in the period we analyze and briefly discuss the active manager experience.
Construction of the MSCI ESG Indexes
MSCI’s Global Sustainability Indexes, of which the MSCI Emerging Markets ESG Index and MSCI World ESG Index are a part, are constructed by including companies with the highest broad ESG ratings representing a target of 50% of the market capitalization in each sector of the parent standard index. Detailed methodology is laid out in MSCI’s November 2014 “Global Sustainability Indexes Methodology” report, but the key point is that by aiming to take the best 50% from each sector, sector weights do not diverge materially from the parent, although the ESG index can be underweight a sector when too few companies are eligible for inclusion.[6]Sector matching is done for the underlying regional indexes that make up the World and Emerging Markets indexes. For example, MSCI World ESG is an aggregation of MSCI Canada ESG, MSCI Europe and … Continue reading MSCI’s construction methodology is a key differentiator compared to other investment universes influenced by ESG factors.
MSCI assigns companies an ESG rating (formerly known as an intangible value assessment or IVA rating) from AAA to CCC, relative to industry peers. The ratings aim for complete coverage of the MSCI All Country World Index (the combination of MSCI World and MSCI EM), though immaterial gaps can exist when new securities are introduced.[7]According to MSCI, gaps in coverage are typically below 10 of the 2,500 stocks in MSCI ACWI. Any stock without an ESG rating is not eligible for the MSCI ESG indexes. To be eligible for inclusion in one of the ESG indexes, companies must have a rating above B to join the index and above CCC to remain in the index. Additionally, the indexes use MSCI Impact Monitor controversy scores—which identify companies involved in serious environmental, social, or governance controversies on a scale of zero to ten, with zero being the worst—to screen out the worst ESG controversies. Companies must have an Impact Monitor score above two to join the index and above one to remain in the index. Companies that are eligible based on their ESG rating and Impact Monitor score are then included in the ESG indexes based on a ranking of ESG quality that starts with the best[8]MSCI selects from eligible ranked universe of securities based on ESG ratings in descending order specifically as follows: top 35% of ESG ratings, then AAA and AA securities in top 50%, then current … Continue reading, with weight based on free-float-adjusted market capitalization, until the target weight (50% of parent weight) is achieved in each sector.
MSCI’s ESG indexes are therefore based on a very broad measure of ESG quality. Figure 1 shows the broad range of 37 key issues used to create the MSCI ESG ratings, weighted for each industry based on materiality. The ratings use over a thousand data points, and consider both exposures to these key issues and how companies are managing each material issue.[9]Further detail on MSCI’s ESG ratings methodology can be found on their website at www.msci.com/documents/1296102/1636401/MSCI_ESG_Ratings.pdf.

Figure 1. Structure of ESG Ratings Methodology
Source: MSCI ESG Research. MSCI data provided “as is” without any express or implied warranties. Reproduced by permission.
The MSCI World ESG Index launched October 1, 2007. On September 1, 2010, the FTSE KLD indexes transitioned into the MSCI World ESG Index. As a result of the integration of these datasets, the performance attribution analysis for MSCI World ESG that we show later in this paper covers the period October 2010 to June 2016, the longest available consistent dataset.
The MSCI EM ESG Index launched June 6, 2013. At launch, MSCI made available data back to October 2007 for the index. However, over this earlier period, MSCI had ESG ratings available for only a partial set of companies in the parent MSCI EM index, as coverage was ramped up over 2012 to launch the index in mid-2013 with more complete coverage. To create the back-test to 2007, MSCI took the constituents as of the launch date, chosen based on 2013 ESG ratings, froze them, and brought them back to 2007. This introduces significant hindsight bias into the pre-launch data, so although data for this fixed set of constituents are available (and show substantial outperformance by the EM ESG index of the parent), we will only analyze the live data in this paper. To augment the short period, we have conducted analysis on the 2007–13 period using only those stocks for which ESG ratings were available.
Performance of the MSCI ESG Indexes
From the launch of the live index in June 2013 through June 2016, the MSCI EM ESG Index has outperformed the EM parent index by a cumulative 12% on a total return US dollar basis, while the MSCI World ESG Index shows barely any divergence from its parent index over this period, over the nearly six-year period we will use for our attribution analysis, or over the period since its own launch on October 1, 2007 (Figure 2).
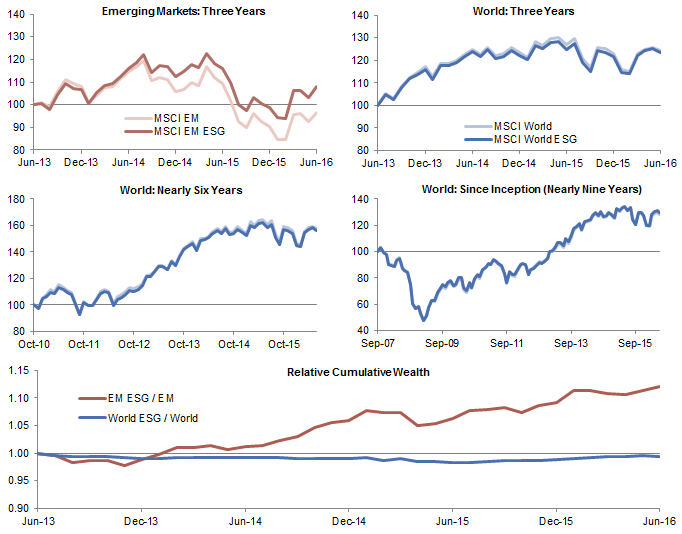
Figure 2. Cumulative Wealth of the MSCI World and Emerging Markets Indexes and the ESG Versions
As of June 30, 2016 • USD Terms
Sources: MSCI Inc. and Thomson Reuters Datastream. MSCI data provided “as is” without any express or implied warranties.
The outperformance generated by the MSCI EM ESG relative to its parent has been remarkably consistent (Figure 2) over the three years data are available, during a volatile, but ultimately sideways period, for emerging markets in dollar terms.[10]In local currency terms, the MSCI EM Index has returned 12% from June 2013 to June 2016. Meanwhile, the MSCI World ESG Index has been remarkably static versus its parent.
Comparing the MSCI EM ESG Index and the Parent Index
What explains the outperformance of the MSCI EM ESG Index over its parent index? As mentioned in the introduction, selection based on ESG quality may favor particular styles, often quality and growth over value, or disproportionately avoid certain sectors, including materials and energy, though as discussed sector deviations are relatively controlled in this index. If ESG ratings are only a proxy for these factors, the backdrop over the last three years has been very favorable in emerging markets, and ESG selection factors themselves would be a less significant source of investment outperformance. We tested this by conducting an attribution analysis for the period July 2013 to June 2016.[11]This analysis starts in July 2013, as that is the first month of live attribution data following the index launch on June 6, 2013. Further, our attribution uses arithmetic rather than geometric … Continue reading
The analysis shows that style and sector factors have indeed contributed to outperformance of the EM ESG Index versus its parent over this period, with sector contributing more (Figure 3). However, 54% of the ESG index’s excess return over its parent is attributable to stock-specific sources: 199 basis points (bps) of the 367 bps annualized outperformance. In other words, the selection of stocks in emerging markets based on a broad measure of ESG quality has meaningfully contributed to the index’s outperformance over the three-year time period available for analysis. Further, this stock-specific contribution has been consistent (Figure 4) in a period when emerging markets were quite volatile. The stock-specific factors only contributed 35% of the active risk for this index over the period alongside nearly half the active return. Thus on a risk-adjusted basis, the value of ESG-based stock selection was even greater.

Figure 3. Performance Attribution: Contribution to the MSCI EM ESG Index Excess Return
July 31, 2013 – June 30, 2016 • US Dollar
Sources: MSCI ESG Research and Applied Research. MSCI data provided “as is” without any express or implied warranties.
Note: The total active return is the annualized arithmetic excess return of MSCI EM ESG over the standard index.
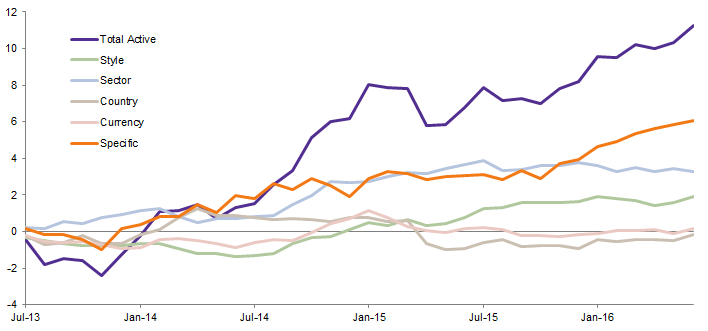
Figure 4. Excess Return of the MSCI Emerging Markets ESG Index by Source Over Time
July 31, 2013 – June 30, 2016 • Percent (%)
Sources: MSCI ESG Research and Applied Research. MSCI data provided “as is” without any express or implied warranties.
Note: Returns shown are derived from the arithmetic excess return of the MSCI Emerging Markets ESG Index over the standard index.
Taking a closer look at the contribution of style factors (which contributed 63 bps of the 367 bp annualized excess return), the momentum factor had the largest impact at 37 bps annually, and was a substantial overweight relative to the parent index, at 13% (Figure 5). Residual volatility and liquidity factors, meaningful underweights, contributed 21 bps and 11 bps, respectively. More broadly, the EM ESG Index has been overweight quality, and we observe that the “quality family” of style factors, which includes higher profitability, lower earnings variability, higher investment and earnings quality, higher growth, and lower leverage, had an overall positive effect on performance.

Figure 5. MSCI Emerging Markets ESG Index: Active Exposure and Excess Return Contribution by Style Factor
July 31, 2013 – June 30, 2016
Sources: MSCI ESG Research and Applied Research. MSCI data provided “as is” without any express or implied warranties.
Notes: Active exposure is relative to the MSCI Emerging Markets Index. Contribution of each style factor to the overall style active return is derived from arithmetic excess returns.
While the ESG index methodology limits the sector impact by closely tracking the parent index sector weights, index stability rules allow modest deviations to the target of 50% of parent index sector market capitalization; a modest average overweight to information technology in the EM ESG Index relative to the parent significantly contributed to the excess return (47 bps of the 107 bp overall sector contribution), as shown in Figure 6. As noted, when too few companies are eligible for inclusion in the ESG index, sector holdings can go below the targeted 50%. This has been the case in the energy and materials sectors, where lower average weightings over the period have benefited the ESG index.
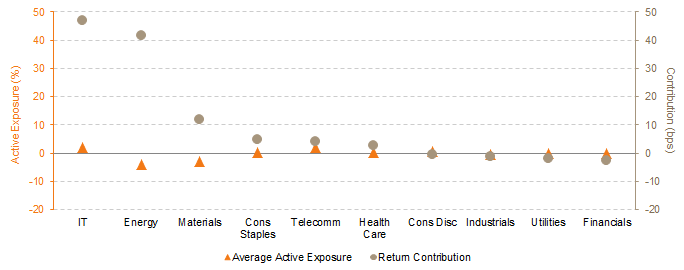
Figure 6. MSCI Emerging Markets ESG Index: Active Exposure and Excess Return Contribution by Sector
July 31, 2013 – June 30, 2016
Sources: MSCI ESG Research and Applied Research. MSCI data provided “as is” without any express or implied warranties.
Notes: Active exposure is relative to the MSCI Emering Markets Index. Contribution of each sector to the overall sector active return is derived from arithmetic excess returns.
The energy and materials sectors have underperformed substantially over the period examined, and their weights have consequently declined in the parent index. Has the ESG index’s rebalancing process “locked in” outperformance versus the parent index? In a scenario where the ESG index holdings in a sector have met the targeted “best” 50% of the parent index, but the “poorer quality” other half have fallen much more (as was the case for energy and materials), this 50% weight would move up, and then the ESG index would remove some sector constituents at the annual rebalance to get back down to 50%. It would effectively “sell out” rather than “wipe out” of energy and materials stocks to some degree during the declines seen over recent years, locking in outperformance. That the ESG index was on average 4% underweight in energy and 3% in materials tells us this has not had a substantial effect, and we are capturing the impact of these weights in our sector-level attribution. All other sector active weights and contributions were modest. The overall contribution of active country and currency exposures to the ESG index relative return was a negligible -5 bps and 4 bps.
Examining EM ESG Ratings Data Pre-Index
While three years is too short a period by far to draw firm conclusions, the strong impact of selection on ESG ratings in emerging markets is interesting. MSCI did have ratings available for select EM companies prior to the launch of the index in 2013, so we have reviewed this dataset to see whether stock-specific value add from selecting based on ESG ratings can been seen for a longer period. From 2007 to 2011, the number of companies with ratings doubled, but was still quite low (Figure 7). Coverage really started to increase over 2012 in time for the launch of the EM ESG Index in June 2013. Overall, this is an interesting period since underlying disclosure of ESG data by emerging markets companies, on which these ratings rely, was also improving, while still lagging the situation in developed countries.[12]See, for example, Andrea van Dijk, Lotte Griek, and Chloe Jansen, “Bridging the Gaps: Effectively Addressing ESG Risks in Emerging Markets,” Sustainalytics, June 2012. Also see The USSIF … Continue reading
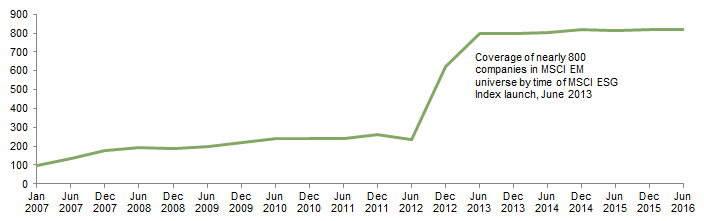
Figure 7. Number of EM Companies Assigned ESG Ratings by MSCI
January 31, 2007 – June 30, 2016
Sources: MSCI ESG Research and Applied Research. MSCI data provided “as is” without any express or implied warranties.
Note: After January 2007, MSCI provided coverage data for June and December of each year.
To conduct this analysis, we took the rated companies in each month from January 2007 and split them in half to compare the best rated half versus the worst rated half. This is a simple equally weighted analysis of two groups that do not overlap (best half versus worst half), with semi-annual rebalancing of the constituents to include any newly rated companies and update any ratings changes. This is not a replication of the ESG index methodology, and we do not compare the performance of either “half” versus the EM parent index, as there is some selection bias based on the order in which MSCI built up coverage. For example, larger companies and larger sectors were generally tackled first, creating significant early differences in coverage by sector and country.
Our analysis begins with less than 50 companies in each half, given the 95 rated companies in January 2007, and grows to almost 400 companies in each half with 795 rated companies in June 2013. We performed the same attribution analysis done for the live EM ESG Index data to assess the stock-specific contribution to the performance of the best half versus the worst half over the 2007–13 period. Since the two halves never overlap, active risk is not relevant and has not been analyzed.
Overall, we observe 267 bps of annualized outperformance by the better half based on ESG ratings (Figure 8). As was the case in our analysis of the EM ESG Index, style and sector factors have contributed to outperformance but 235 bps, or 88%, of the excess return is attributable to stock specific sources. This stock-specific contribution has been reasonably consistent over the period, although it did not add value in the first year, when data coverage was extremely limited, or during the period from March 2011 to May 2012 (Figure 9). Given our simple equal weighting methodology and a small dataset that grows over time, the country and currency[13]Our decision to use equal weighting lends integrity to the stock-specific impact of ESG selection as coverage was built up, which is the key factor we wish to examine. The mutually exclusive nature … Continue reading factors are far more volatile in this analysis than in our analysis of the EM ESG Index.

Figure 8. Performance Attribution: Contribution to Excess Return of Best Half vs Worst Half of EM ESG Rated Companies
February 28, 2007 – June 30, 2013 • US Dollar
Source: MSCI ESG Research and Applied Research. MSCI data provided “as is” without any express or implied warranties.
Note: The total active return is the annualized arithmetic excess return of best half of ESG ratings versus the worst half.
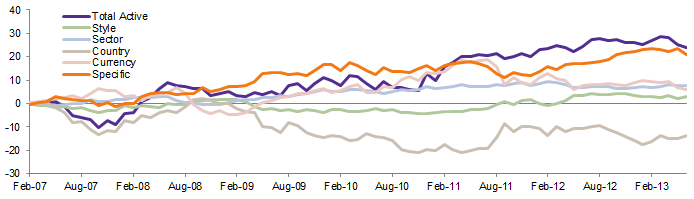
Figure 9. Excess Return for the Best Half of ESG Ratings versus the Worst Half
February 28, 2007 – June 30, 2013 • Percent (%)
Sources: MSCI ESG Research and Applied Research. MSCI data provided “as is” without any express or implied warranties.
Note: Returns shown are derived from the arithmetic excess return of the best half of ESG rated companies in a given month versus the worst half.
As noted, there are limitations to this earlier dataset and simple analysis, but the findings are nonetheless interesting since they support the findings of our study of the live ESG index—that stock selection based on ESG quality added alpha and the majority of this was due to stock-specific sources. Combining our study of the live ESG index with this earlier data suggests that ESG-based stock selection has added value over an eight and a half year period from 2008 onward.
Comparing the MSCI World ESG Index and the Parent Index
Unlike in emerging markets, the developed markets ESG index did not post materially better performance than its parent (refer to Figure 2). The MSCI World ESG Index has outperformed the MSCI World Index by just 10 bps on an annualized basis in US dollar terms since inception in 2007. Over the shorter October 2010 to June 2016 for which we have attribution data[14]As discussed, MSCI’s acquisition of the FTSE KLD indexes in 2010 changed the MSCI World Index sufficiently that the dataset prior to 2010 isn’t comparable to the post-2010 data for purposes of … Continue reading and analyze in this section, the MSCI World ESG index actually underperformed the parent index by 14 bps annually in arithmetic terms.[15]For direct comparison, for the even shorter July 2013 to June 2016 period analyzed for the emerging markets dataset, the MSCI World ESG Index shows nearly exactly the same modest underperformance … Continue reading Over either time period the key point is that the World ESG index and its parent barely diverged. What explains this?
Our analysis shows that the stock-specific (ESG selection effect) contribution for developed markets was negative, detracting 54 bps from the excess return on an annualized basis (Figure 10). Furthermore, the stock-specific contribution has been generally getting worse over the nearly six-year period analyzed (Figure 11).[16]And over the period that coincides with the live data for emerging markets, developed markets showed an even more negative stock-specific (ESG selection effect) contribution, 113 bps on an annualized … Continue reading Stock-specific factors are also contributing proportionally more to active risk, in contrast to the three years of emerging markets data.

Figure 10. Performance Attribution: Contribution to MSCI World ESG Index Excess Return
October 31, 2010 – June 30, 2016 • US Dollar
Sources: MSCI ESG Research and Applied Research. MSCI data provided “as is” without any express or implied warranties.
Note: The total active return is the annualized arithmetic excess return of the MSCI World ESG Index over the standard index.
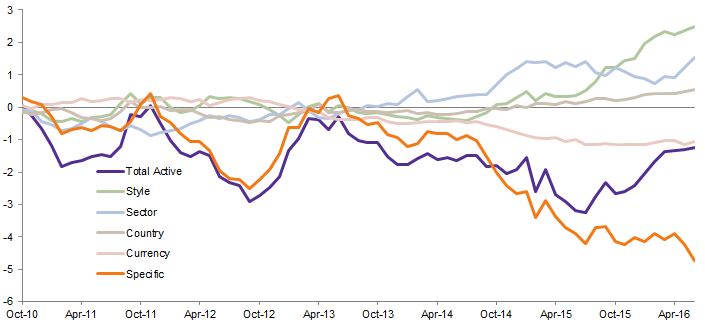
Figure 11. Excess Return of the MSCI World ESG Index vs MSCI World Index by Source Over Time
October 31, 2010 – June 30, 2016 • Percent (%)
Sources: MSCI ESG Research and Applied Research. MSCI data provided “as is” without any express or implied warranties.
Notes: Data represents cumulative returns. Returns shown are derived from the arithmetic excess return of the MSCI World ESG Index over the standard index.
Delving into the style factors (which contributed 28 bps to the annualized excess return), residual volatility contributed most significantly (25 bps) and was a meaningful underweight (Figure 12). Other deviations in exposure had generally small contributions. On a sector basis (17 bp contribution to excess return), despite zero active exposure on average over the period, variances over time modestly added value in materials (14 bps) and a few other sectors, while a small overweight in the industrials sector detracted (Figure 13).
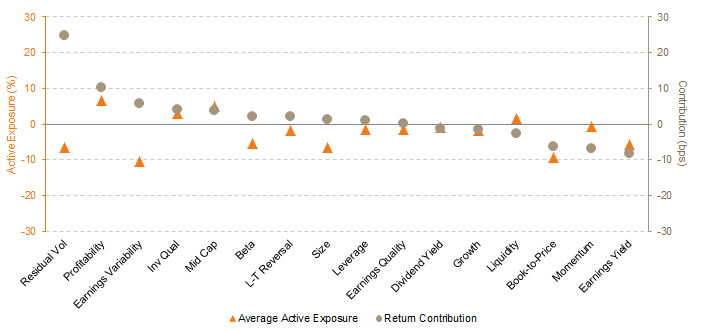
Figure 12. MSCI World ESG Index: Active Exposure and Excess Return Contribution by Style Factor
October 31, 2010 – June 30, 2016
Source: MSCI ESG Research and Applied Research. MSCI data provided “as is” without any express or implied warranties.
Notes: Active exposure is relative to the MSCI World Index. Contribution of each style factor to the overall style active return is derived from arithmetic excess returns.
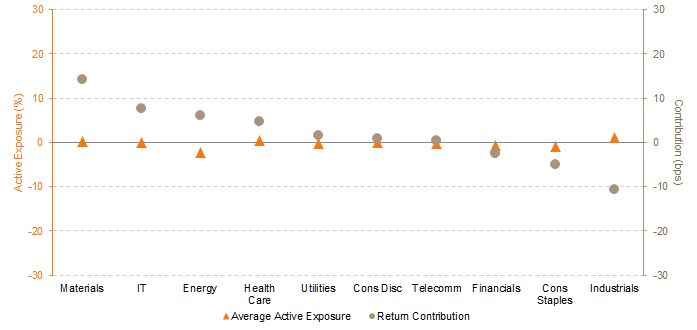
Figure 13. MSCI World ESG Index: Active Exposure and Excess Return Contribution by Sector
October 31, 2010 – June 30, 2016
Sources: MSCI ESG Research and Applied Research. MSCI data provided “as is” without any express or implied warranties.
Notes: Active exposure is relative to the MSCI World Index. Contribution of each sector to the overall sector active return is derived from arithmetic excess returns.
In aggregate, the country factor contributed a very small amount to the World ESG Index excess return (6 bps). However, examining World ESG Index exposure on a country-by-country basis, an interesting picture emerges. The ESG index was on average modestly underweight (1%) to US stocks in this period, exposure which detracted 6 bps from performance, while a 1% overweight to Japanese stocks contributed 10 bps (Figure 14).
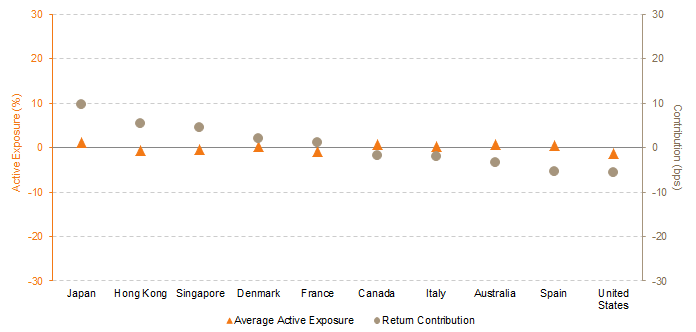
Figure 14. MSCI World ESG Index: Active Exposure and Excess Return Contribution by Country
October 31, 2010 – June 30, 2016
Source: MSCI ESG Research and Applied Research. MSCI data provided “as is” without any express or implied warranties.
Notes: Active exposure is relative to the MSCI World Index. Contribution of each country to the overall country active return is derived from arithmetic excess returns.
The Stock Specific Contribution: Understanding the Importance of ESG Factors
Emerging Markets. Over half the outperformance of the MSCI EM ESG Index over its parent index in the three-year period of live data examined came from stock-specific factors, i.e., the ESG-based stock selection. Why was incorporating ESG data into index stock selection so significant in emerging markets? It stands to reason that in a market where underlying ESG risks are higher[17]See discussion in Andrea van Dijk, Lotte Griek and Chloe Jansen, “Bridging the Gaps: Effectively Addressing ESG Risks in Emerging Markets,” Sustainalytics, June, 2012. that the emergence of new robust datasets represents an important tool in the stock selection process. Breaking out the impact of the three environmental, social, and governance dimensions is beyond the scope of this analysis, but we would hypothesize that governance quality, which is highly variable in emerging markets, is a key factor.
In particular, state-owned enterprises (SOEs) are prevalent in emerging markets, especially in the energy, financial, materials, and telecom sectors, and according to Goldman Sachs represented 28% of the parent MSCI EM benchmark in June 2016.[18]Prashant Kemka and Katie Koch, “EM Equities: Beware of the Benchmark,” Financial Times, July 7, 2016. ESG ratings have often been relatively low for large SOEs, often due to issues in the governance pillar (Figure 1), as studies have highlighted.[19]For more on this, see David Robinett, “Held by the Visible Hand: The Challenge of State-Owned Enterprise Corporate Governance for Emerging Markets,” World Bank, May 1, 2006, as well as Jeremy … Continue reading. SOEs are influenced by interests beyond generating profits for shareholders, which can negatively impact operational aspects of the business. The same accusation has also been made for some family-owned businesses, which are also common in emerging markets.
Poor ESG scores for SOEs are reflected in the EM ESG Index, which is heavily underweight SOEs. Of the largest 40 companies in the parent EM index, based on average weight over the July 2013 June 2016 period analyzed, 13 are SOEs. The EM ESG index had zero weights in 11 of them, and in nearly three-quarters of these cases not holding the stock was a positive stock-specific contribution to outperformance by the EM ESG Index. In the two other cases where the EM ESG Index was overweight relative to the parent index, this was a poor decision, as both detracted from relative performance on a stock-specific basis.
There is evidence that this SOE issue has been significant over longer periods as well, with SOEs lagging private sector stocks by 40% over the last five years (to June 2016), based on a Goldman Sachs analysis.[20]Prashant Kemka and Katie Koch, “EM Equities: Beware of the Benchmark,” Financial Times, July 7, 2016. Analysis by Morgan Stanley has shown that the failure of market values to recover to peaks seen before the global financial crisis is disproportionately due to poor performance of SOE stocks which overall still trade below half of their peak value (Figure 15). Concerns over SOEs have seemingly been around for so long, one wonders how they could not already be amply discounted by markets, but the ESG ratings process has clearly been effective in identifying underperforming companies here.
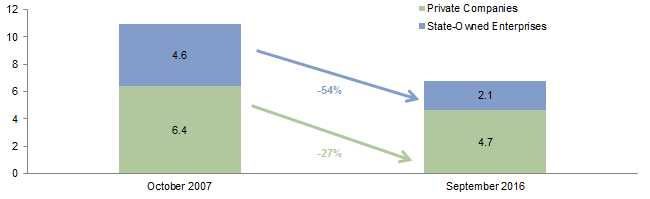
Figure 15. State and Private Sector Market Value in Emerging Markets Equities
October 2007 versus September 2016 • US Dollar (trillions)
Source: Morgan Stanley Investment Management Emerging Markets Equity team.
Notes: State-owned enterprises defined as companies with 30% or more government control. Emerging markets company dataset not limited to those in MSCI index.
Although our analysis has found a significant contribution from ESG stock-specific selection, emerging markets are still a young and developing asset class. The period examined coincides with a general underperformance by more cyclical and value companies in emerging markets. If we had the data to examine another period, the benefits of ESG data may not have been as pronounced. Certainly in the early years of EM equity indexes, SOEs were a key point of access and performed more strongly. And of course proximity to government may pump up stocks for long periods of time—the case of Petrobras, with serious ESG issues described in the sidebar, is a good example. Had the ESG index existed in the first decade of the 2000s, index performance relative to the parent may not have been quite as good.
The Rise and Fall of Petrobras
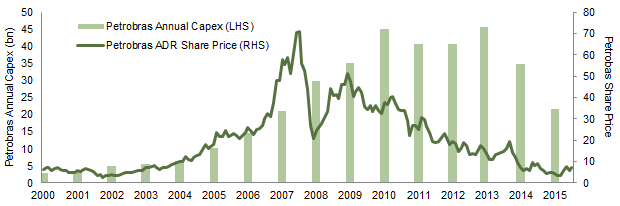
Petrobras Annual Capex and ADR Share Price
December 31, 2010 – June 30, 2016 • USD Terms
Source: Bloomberg L.P.
Developed Markets. What’s behind the negative contribution of stock-specific factors in the MSCI World ESG Index? The key observation is that ESG-based stock selection added value outside the United States, but detracted value in the choice of US stocks over the nearly six years we examined.[21]Over the period of our analysis, all three of the non-US regional ESG indexes that make up MSCI World ESG (Canada, Europe and Middle East, and Pacific) outperformed their parent indexes, while the … Continue reading This stock selection problem within the United States was a much more significant detractor than the negligible negative impact from the modest US country underweight shown in Figure 14.
Some research on ESG ratings has highlighted lower levels of disclosure for key ESG information for American versus European companies.[22]Seb Beloe, “What Do ESG Ratings Actually Tell Us?,” Responsible Investor, April 27, 2016. This could make it harder for ratings to differentiate and accurately reflect underlying ESG quality. It is interesting to observe that while disclosure levels are also relatively poor for emerging markets companies, dispersion of ESG performance is also greater.[23]See discussion in Andrea van Dijk, Lotte Griek and Chloe Jansen, “Bridging the Gaps: Effectively Addressing ESG Risks in Emerging Markets,” Sustainalytics, June, 2012. This may help explain the greater apparent link between ESG ratings and stock-specific performance for emerging versus American stocks.
Indeed, in our analysis the ESG quality selection process struggled with US stocks. In particular, some mega-cap US companies that performed well in recent years were excluded from the ESG index, significantly harming relative performance. Over the nearly six year period we analyzed, no fewer than nine of the ten biggest stock-specific detractors to the relative performance of the MSCI World ESG Index versus its parent were US stocks. Four of these stocks (Amazon, Apple, Facebook, and Home Depot) were completely excluded from the ESG index during the entire period, while one (Walt Disney) was underweight on average. The other four US stocks on the top detractors list were overweights selected by the ESG index that underperformed.
This issue continues in the dataset beyond the bottom ten, with 70% of the worst 40 stock-specific detractors to the MSCI World ESG Index’s relative performance relating to different weightings in US companies. The clear majority of these are MSCI World Index stocks wholly absent from the ESG Index over the whole period (0% average weight), or underweight on average. Put simply, investors liked some large-cap multinational US stocks more than the ESG ratings system did, and both the resulting US underweight, and poor US stock selection, harmed performance.
In contrast, US stocks are underrepresented in the top stock-specific contributors to the MSCI World ESG Index excess return, with only four in the top ten. Canadian pharmaceutical copmpany Valeant was the largest stock-specific relative contributor to the MSCI World ESG Index performance, likely surprising to those following recent events given the pharmaceutical stock’s 92% collapse from September 2015 to June 2016. This is a successful case of ESG factors screening out “bad actors” (as well as some fortunate timing in index rebalancing): the company’s MSCI ESG rating was downgraded to CCC in May 2015, making it ineligible for the ESG index, and it was removed in the next quarterly review (August 2015), meaning the index benefited from the previous run up and sold out before the sharp declines. The downgrade was based on a broad range of ESG concerns and was made roughly four months before the stock started to collapse amid a raft of drug pricing and accounting controversies.
While the MSCI World ESG Index has struggled to outperform its parent in the nearly six-year period we examined, a separate 2015 study by MSCI[24]Zoltan Nagy, Altaf Kassam, and Linda-Eling Lee, “Can ESG Add Alpha? An Analysis of ESG Tilt and Momentum Strategies,” MSCI ESG Research, June 2015.. looked at a slightly longer period from February 2007 to March 2015, and showed that the same ESG ratings dataset can add value when used in a more nuanced way than the indexing methodology. A much more concentrated portfolio of 100 well-rated stocks, using a risk model to optimize weights, found a 43 bp contribution from stock-specific factors to an overall 106 bp annualized outperformance of MSCI World. The report also analyzed performance for a momentum approach to ESG—buying companies showing improvement in ratings rather than just focusing on the ratings themselves. Backing up findings of previous studies,[25]Natalie A. Trunow and Joshua Linder, “Perspectives on ESG Integration in Equity Investing: An Opportunity to Enhance Long-Term, Risk-Adjusted Investment Performance,” Calvert Investment, 2015, as … Continue reading this analysis, which overweighted companies in developed markets that improved their ESG rating over the prior 12 months, found a 132 bp contribution from stock-specific factors to an overall 223 bp annualized outperformance of MSCI World. However, both strategies had much more total active risk than what we found in our analysis of the index data, and this larger active risk was largely stock specific.
The Active Manager Experience
Emerging Markets. The positive results of ESG-based stock selection highlight how important evaluating ESG quality of companies could be to active management in emerging markets. There are still relatively few explicitly ESG labeled active emerging market equity funds, though we have seen some interesting new launches in recent years. We note that most have handsomely outperformed the MSCI EM Index since their inception, including those with longer track records than the MSCI EM ESG Index, up to seven years, showing the experience in active management has backed up the findings of this paper. Beyond these funds, in our conversations with managers, a growing number of mainstream managers profess to inclusion of ESG factors in their process and are placing more emphasis here, although the products may not have an ESG “label.” Quality of governance has long been acknowledged as a key investment criterion for many active managers. Given the findings of this paper, and the growing availability and improving quality of emerging markets ESG information from MSCI as well as other providers, this is encouraging. However, we have observed huge variations in the depth of application and, as ever, manager selection is critical.
We acknowledge that consistent integration of ESG factors has been challenging given the relative lack of good data until recently. Certainly some of the lower ESG-rated EM companies today would have in the past been major beneficiaries of the more cyclical and value-based bull market periods in emerging markets. Further, as discussed in the sidebar, proximity to government was rationally often seen as a positive if it led to favorable treatment in the awarding of licenses or other business assets when prices and growth rates were booming. The same could be said of aggressive but ultimately unsustainable poor environmental and social business practices.
Developed Markets. Within developed markets, investors have a broader array of active ESG-focused and labeled strategies to choose from, and unlike the MSCI World ESG Index, many of these managers have outperformed MSCI World in recent years. The opportunity set covers generalist managers with a strong ESG focus, through to more specialized thematic sustainability strategies such as targeting resource efficiency and environmental markets. There are of course many ways to integrate ESG analysis beyond the MSCI dataset, and many developed markets equity managers, including quantitative managers, are making increasingly sophisticated use of ESG data alongside more conventional financial data. Many have asset allocations that are meaningfully different from the standard MSCI World Index, and being underweight to materials and energy has supported these managers in recent years. The improving quality and breadth of ESG data (beyond just MSCI ESG data) provides another key tool for thoughtful managers in this space to make individual judgments of materiality.
Conclusion
Our analysis of the MSCI index reveals that stock selection based on aggregate measures of corporate ESG quality significantly contributed to improving performance over the last three years for emerging markets equities. Stock-specific factors resulting from selection based purely on ESG scoring measures accounted for 199 bps out of 367 bps of annualized outperformance of the MSCI Emerging Markets ESG Index compared to the standard MSCI Emerging Markets Index. Additionally, while earlier ESG ratings data were not comprehensive, our analysis indicates that companies with higher ESG ratings outperformed overall in the preceding six-and-a-half years as well, with most of this outperformance again attributable to stock-specific factors. Overall, ESG data has made a strong contribution to the set of tools for investors in this asset class since it became available.
The data for developed markets have been more mixed, largely due to ESG ratings being a poor indicator of stock performance for US large-cap companies. Consideration of ESG quality can still add value in developed markets with the correct application, which may need to be more nuanced than using ratings in isolation.
ESG data for emerging markets has become more detailed and comprehensive in recent years. Investors in emerging markets equities often focus on commodity prices, currency, and macroeconomic factors, as well as domestic consumption trends for consumer goods and services, when making decisions about investments, and may have underestimated the value of now widely available information on the ESG strength of corporates in emerging markets.
Given these findings, investors evaluating managers would do well to focus on understanding if and how the manager incorporates ESG factors, for what reason and how consistently, and whether ESG-based stock selection has added value to their funds.
Chris Varco, Senior Investment Director
Disclaimer
Although Cambridge Associates information providers, including without limitation, MSCI ESG Research Inc. and its affiliates (the “ESG Parties”), obtain information from sources they consider reliable, none of the ESG Parties warrants or guarantees the originality, accuracy and/or completeness of any data herein. None of the ESG Parties makes any express or implied warranties of any kind, and the ESG Parties hereby expressly disclaim all warranties of merchantability and fitness for a particular purpose, with respect to any data herein. None of the ESG Parties shall have any liability for any errors or omissions in connection with any data herein. Further, without limiting any of the foregoing, in no event shall any of the ESG Parties have any liability for any direct, indirect, special, punitive, consequential or any other damages (including lost profits) even if notified of the possibility of such damages.
Footnotes