As US small-cap valuations have grown increasingly extreme, so has our conviction in underweighting them
- Small caps have benefited from the recovery in US economic conditions since 2009 and the perceived safe-haven status of domestic US assets.
- Investors have earned low single-digit nominal returns from historical valuation levels equivalent to those today, an unappetizing prospect for a volatile asset class with sensitivity to turns in the economic cycle.
- Although small-cap investors have historically benefited from a return premium relative to large caps, the forward-looking, medium-term small-cap premium will likely be nonexistent or negative in light of valuation extremes relative to large caps.
- Small-cap growth stocks are even more expensive than their value counterparts and are particularly vulnerable to valuation risk.
Despite a volatile start to 2014, US small-cap equities have trounced large-cap stocks since the dot-com bubble started deflating over a decade ago. The Russell 2000® Index, the most widely known measure of small US stocks, beat its large-cap counterpart, the Russell 1000® Index, by 3.0% per year from January 2000 through April 2014. Viewed through the long, historical lens of academic finance, this is hardly a surprise. Small caps in the United States have outperformed large caps by 2.2% per year since the data begin in 1926, leading many observers to conclude that a “size effect” provides them with a permanent tailwind.
From a valuation perspective, the result since 2000 has been similarly unsurprising, albeit for different reasons. At the time, we noted that small caps, which we considered merely “overvalued,” offered better return prospects than the “very overvalued” S&P 500 and the global tech companies caught up in a “dangerous bubble.” As the valuation extremes unwound, small caps bounced back with a vengeance.
Our valuation analysis today leads us to diverge from those counting on a continued excess return from the size effect—and has admittedly led us to do so prematurely, since we have preferred large-cap stocks over small-cap stocks throughout the post-crisis environment. Today, US small-cap valuations are flirting with all-time highs. Prices are especially unreasonable within the growth portion of the universe. While we acknowledge the apparent existence of a long-run small-cap premium—make that a very long-run small-cap premium—investors concerned with expected returns over the next three to ten years are likely to find that the premium will be nonexistent or negative. Moreover, pursuing the premium currently requires holding the asset class with the most valuation risk in the entire global equity universe. For value investors looking for a proverbial “fat pitch,” US small caps are better described as an attempt at a hole-in-one.
In this note, we review the long-run performance of US small caps, show that the historical size premium has been episodic in nature, and discuss the link between today’s high starting valuation and our low expected return over the medium term. We also distinguish between the merely high valuation of small-cap value stocks and the nearly unprecedented valuation of small-cap growth stocks.
Small Caps for the Long Run?
The smallest US stocks have outperformed the largest ones by a remarkable margin over the last 87-plus years (Figure 1). Starting from the tenth decile of stocks (which represents the largest) and moving down the cap spectrum, the performance benefit of choosing smaller companies has been continuous through each of the largest five deciles (deciles 10 through 6). Although the marginal benefit of “going smaller” appears to decrease in the smaller half of the equity universe, the most extreme decile of micro-cap stocks has nonetheless been the best performing over time.
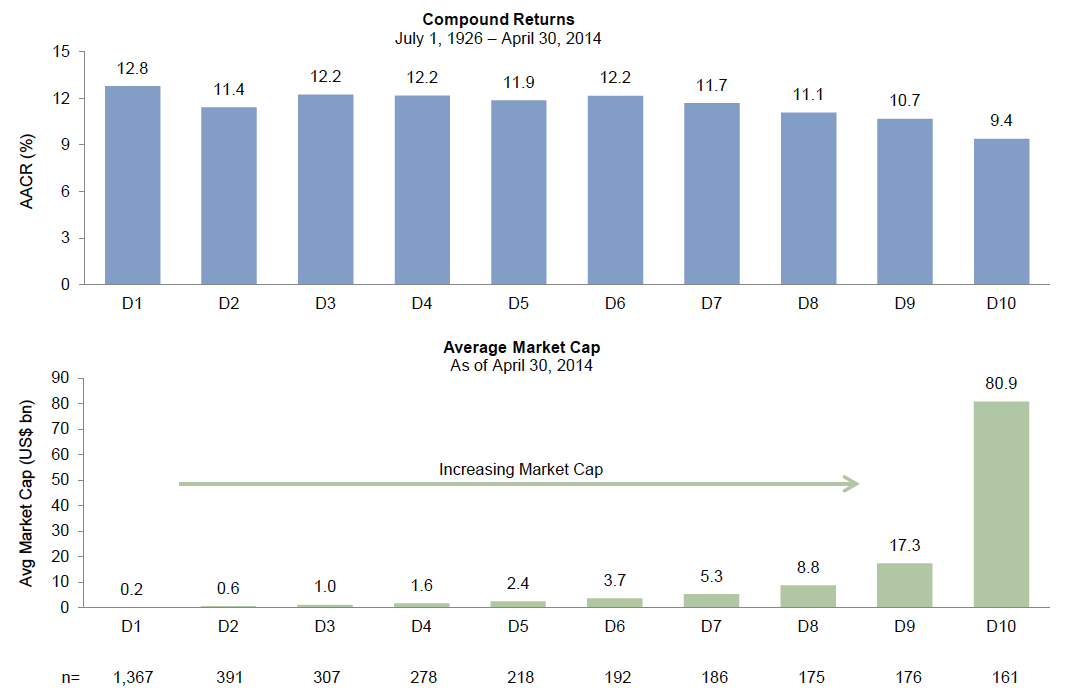
Figure 1. The Smallest US Stocks Have Outperformed the Largest Ones Over Time
Portfolios Formed by Decile of Market Capitalization (D10 = Largest Market Cap)
Although academics first began to consider the existence of a small-cap premium in the early 1980s[1]Rolf W. Banz, “The Relationship Between Return and Market Value of Common Stocks,” Journal of Financial Economics 9, no. 1 (March 1981): 3–18., and research on the topic accelerated after Eugene Fama and Kenneth French’s seminal 1992 paper[2]Eugene F. Fama and Kenneth R. French, “The Cross-Section of Expected Stock Returns,” The Journal of Finance 47, no. 2 (June 1992): 427–465., there is little consensus about why the size effect exists.[3]Mathijs van Dijk, “Is Size Dead? A Review of the Size Effect in Equity Returns,” Journal of Banking & Finance 35 (2011): 3263–3274. Some posit that it represents a premium for bearing excess risk or reduced liquidity. Others suggest that it reflects the consequences of investor behavior, such as a preference for stocks with recognizable names. Still others focus on the fact that the higher measured returns might be a statistical fluke arising from data mining, survivorship issues, and the extreme influence of outliers. Evidence from outside the United States also suggests that small stocks outperform, but the non-US results have been similarly critiqued for their lack of robustness.
Regardless of the academic debate, a hypothetical 87-year small-stock investor bore disproportionately more volatility than a similar holder of large stocks (Figure 2)—there was no obvious “free lunch” on offer. The extreme volatilities observed among the smallest stocks, however, are largely a function of the downright terrifying swings in these securities during the Great Depression. Looking only at the last 50 years, the rise in volatility is more incremental, and the compensation for risk (defined strictly by volatility) is more evenly distributed across the cap spectrum.

Figure 2. Small-Stock Investors Have Borne Considerably More Volatility
Portfolios Formed by Decile of Market Capitalization (D10 = Largest Market Cap)
The Erratic Size Premium
An investor who accepts the evidence that small stocks have outperformed must still confront the meaningful risk that he or she will not earn the historical premium over the intended investment horizon. Small-cap outperformance has been episodic. Between periods of dramatic outperformance in 1931–45 and 1975–83 was a long stagnation in which investors waited decades before their volatile small-cap portfolios finally out-earned their large-cap holdings for good (Figure 3). In the more recent 1983–2010 period investors also waited years for outperformance versus large caps to return (which is no surprise given the extreme relative valuations in the early 1980s, as depicted later in (Figure 7). Indeed, the dismal performance of small stocks heading into the late 1990s dot-com bubble prompted some observers to start asking whether the size effect was dead—if it even existed in the first place.

Figure 3. Small-Cap Outperformance Has Been Episodic
June 30, 1926 – April 30, 2014
All this said, small stocks have nonetheless surpassed large ones over most 15-year periods (Figure 4). Over shorter periods, the probabilities were less favorable; the odds that small stocks beat large ones over a given 12-month period have been slightly greater than 50/50 since 1926.

Figure 4. Small Stocks Have Beaten Large Ones Over Most Long Periods
June 30, 1926 – April 30, 2014
Definitions Matter
Investors who want to understand small-cap performance—or evaluate strategies that invest in small-cap stocks—first need to pay especially close attention to the benchmarks they are using. Benchmarks covering the US small-cap space have different criteria for inclusion, different capitalization tilts, different numbers of securities, and, ultimately, different returns. Data for the first four exhibits in this note come from Kenneth French, the Dartmouth professor who, with Eugene Fama, has published the most influential work about the size and value effects.[4]French offers a bounty of free, high-quality data. French relies primarily on individual stock data from the Center for Research in Security Prices (CRSP), the same provider used by Vanguard for 13 of its US index funds.
The Russell 2000® Index is the most ubiquitous benchmark of small US stocks, though not necessarily the best. We refer to it in this paper because we have valuation data for its full history. The Russell 2000® targets the US companies ranked 1,001 to 3,000 by market capitalization and carries a meaningfully smaller median market cap ($512 million) than the S&P SmallCap 600 and MSCI US Small Cap 1750 Index, which both have medians near $1 billion. The largest companies in the Russell index, however, are notably larger than the top holdings in S&P’s index.
A cause for concern with the Russell 2000® Index is its oft-discussed “annual reconstitution,” in which the benchmark’s holdings are revised. The index’s popularity as a passive benchmark, combined with the transparency of its construction and advance warning of the reconstitution, gives traders a chance to profit at the expense of passive investors by buying stocks before their inclusion and selling securities about to be removed. One analysis estimates the annual loss to passive Russell 2000® investors to be between 1.3% and 1.8%.[5]Honghui Chen, Vijay Singal, and Gregory Noronha, “Index Changes and Losses to Index Fund Investors,” Financial Analysts Journal 62, no. 4 (2006). The Russell 2000® Index has underperformed both the S&P and MSCI indexes by around 2.0% annually since their earliest common inception in 1994, though it is difficult to disentangle potential reconstitution losses from the indexes’ different capitalization characteristics and inclusion criteria. Readers using an S&P, MSCI, or CRSP index as their preferred benchmark may wish to add an extra 1% to 2% when considering performance figures in this note that cite Russell data.
The Outlook: Poor in Both Absolute and Relative Terms
Since 2009, small caps have benefited not only from a genuine recovery in US economic conditions—their real earnings per share are up 83% since March of that year—but also from the United States’ perceived status as a safe haven in a deleveraging world. Amid concerns about Eurozone debt problems and a slowdown in China, investors have sought refuge in domestic US investments, and the Russell 2000® Index is well suited to the task with its comparatively US-centric revenue exposure.[6]According to MSCI, US small caps derive only 23% of their revenue from outside North America (as of October 2013). For large caps, the figure is 33%. While harder to quantify, rising enthusiasm for factor tilts and “smart beta” indexes could also have led investors to pile in to smaller stocks.
Rising demand has led to a similar upward march in valuations (Figure 5). At 32.2, our composite normalized price-earnings ratio is higher than it has been 94% of the time since 1978, and is 44% above its long-run median. Russell 2000® Index investors have historically earned low single-digit nominal returns over the next five years when starting from this valuation (Figure 6). This is hardly an appetizing prospect for an asset class with 20% volatility that tends to underperform as the broader economy peaks and begins contracting.[7]See, for example, Antti Ilmanen, Expected Returns: An Investor’s Guide to Harvesting Market Rewards, John Wiley and Sons, Ltd: West Sussex, UK (2011).

Figure 5. Small-Cap Valuations Are Flirting With All-Time Highs
December 31, 1978 – April 30, 2014

Figure 6. Historically, Small-Cap Valuations Similar to Those Today Have Yielded Poor Five-Year Results
December 31, 1978 – April 30, 2014
The prospects look especially poor for small caps relative to large caps. Today’s relative valuation is higher than it has been 83% of the time since 1978, and, before the current cycle, was surpassed only in mid-1983—not coincidentally, the start of the last long period of stagnation for relative small-cap performance (Figure 7). Put bluntly, we do not think the realized small-cap premium will be able to hold the line against the relative valuation extremes much longer.

Figure 7. The Extreme Valuation of Small Caps Relative to Large Caps Invites Underperformance
December 31, 1978 – April 30, 2014
Admittedly, relative valuations have been stretched since 2011 (absolute valuations less so) and investors that followed our underweight missed the intervening gains as our assessment failed to foresee the strength of the post-crisis trends that have buoyed small caps. While we do not try to time market turns, the recent breakdowns in small-cap growth stocks hint at the possibility that these themes have started to run their course.
Small-Cap Value vs Small-Cap Growth.
Although small caps are expensive overall, there is an important distinction between the growth and value universes. Small-cap growth stocks (as categorized strictly on a price-to-book basis) have suffered from dismal long-run relative performance (Table 1). Research by Fama, French, and others suggests that a narrow sliver of expensive, unprofitable companies that continue to invest in their unprofitable operations lies at the heart of this performance drag.[8]Fama and French’s 2014 working paper, “A Five-Factor Asset Pricing Model,” highlights some of their most recent thinking on the topic.

Table 1. Long-Term Returns by Size and Style
June 30, 1926 – March 31, 2014
While investors would do well to heed these statistics in setting their strategic allocations, they are particularly relevant in today’s environment. Small-cap value stocks are very expensive, but small-cap growth shares have recently been testing valuation levels not seen since the dot-com bubble (Figure 8). The small-cap growth universe, which is biased heavily toward health care, technology, and consumer discretionary companies, seems to have offered investors the perfect place to hide from banks, China, European debt, and everything else bearing even the slightest whiff of macroeconomic risk since the financial crisis.

Figure 8. Small Value Stocks Are Expensive, But Small Growth Shares Are Reaching for the Sky
December 31, 1978 – April 30, 2014.
Nonetheless, it is difficult to imagine the nirvana-like economic outcomes that would be necessary to make small-cap growth companies deliver upside surprises from their current valuations. Will the rise of exchange-traded fund liquidity and investors’ desires to harvest risk premiums give small-cap relative valuations a new, higher average going forward? Perhaps, but we prefer to bet on the historical pattern that the use of the phrase “this time is different” does not typically precede high investment profits. From today’s valuation level, historical five-year returns from small-cap growth have been poor (Figure 9).

Figure 9. The Russell 2000® Growth Index: How High Can It Go?
December 31, 1978 – April 30, 2014
Conclusion
US small-cap stock holdings undoubtedly have a productive role to play in institutional portfolios in the long run, but we are very concerned with the pricing of these stocks today. The medium-term valuation risk embedded in small caps is likely not only to swamp the size premium investors might hope to earn, but also to hand them a poor absolute return. In risk-adjusted terms, it is hard to think of an asset class in our coverage universe with a worse prospective outlook than US small-cap growth stocks in particular.
Investors who maintain their small-cap positions should favor value strategies and consider moving their allocations to the bottom of permitted ranges. Investors opting to shift their equity risk elsewhere could consider moving to (in rough ascending order of attractiveness from a valuation perspective) US large caps, US quality equities, European equities, or emerging markets equities, bearing in mind the tracking error inherent in those choices.[9]While non-US small caps are also an option to consider—and are priced to deliver a better absolute return than US small stocks—we have similar concerns about the magnitude of the premium they … Continue reading While we may not get the timing right, we are convinced that the ex ante risk premiums are meaningfully higher in those asset classes.
Contributors
Jason Liebel, Senior Investment Director
Emily Ginsberg, Investment Associate
Exhibit Notes
The Smallest US Stocks Have Outperformed the Largest Ones Over Time
Source: Kenneth R. French Data Library.
Small-Stock Investors Have Borne Considerably More Volatility
Source: Kenneth R. French Data Library.
Small-Cap Outperformance Has Been Episodic
Source: Kenneth R. French Data Library.
Note: Small-cap relative performance is calculated based on the Fama-French “Small Minus Big” factor.
Small Stocks Have Beaten Large Ones Over Most Long Periods
Source: Kenneth R. French Data Library.
Note: Small-cap relative performance is calculated based on the Fama-French “Small Minus Big” factor.
Small-Cap Valuations Are Flirting With All-Time Highs
Sources: Frank Russell Company and Thomson Reuters Datastream.
Historically, Small-Cap Valuations Similar to Those Today Have Yielded Poor Five-Year Results
Sources: Frank Russell Company and Thomson Reuters Datastream.
The Extreme Valuation of Small Caps Relative to Large Caps Invites Underperformance
Sources: Frank Russell Company and Thomson Reuters Datastream.
Long-Term Returns by Size and Style
Source: Kenneth French Data Library.
Small Value Stocks Are Expensive, But Small Growth Shares Are Reaching for the Sky
Sources: Frank Russell Company and Thomson Reuters Datastream.
The Russell 2000® Growth Index: How High Can It Go?
Sources: Frank Russell Company and Thomson Reuters Datastream.
Footnotes