Frontier markets equities present an interesting opportunity for long-term investors with an understanding of the risks and pitfalls of this asset class
- Frontier markets economies face significant but not insurmountable challenges. Compared to emerging markets, frontier markets are less impacted by currency vulnerability and dependency on exports to China, but are more sensitive to oil prices.
- Frontier markets equities are undervalued today, and it would not take much of a fall in prices to push them into the realm of very undervalued. Relative to developed markets equities, frontier markets trade at a substantial discount.
- Investors should be aware just how illiquid frontier markets are. Emerging markets have 100 times the dollar trading volume of frontier markets. This is clearly a risk, but may also signal an opportunity (there is some evidence that investors require higher returns from illiquid stocks).
- Investors should consider active management, in part because expensive index reshuffling is a perennial feature of the market, adding transaction costs and systematically removing countries from the frontier universe as their capital markets develop.
Frontier markets equities are undervalued today, both on an absolute basis and relative to developed markets. However, frontier markets face some serious challenges including governance concerns, a lack of liquidity, sensitivity to oil prices, and the potential to offer less diversification to other equities than in the past. Frontier markets, as defined by index providers, will likely always remain a very small part of the overall global equity market and—by the very definition used to include countries in the indexes—will never be blue-chip markets (see the appendix for more on the definition of frontier markets and the markets’ evolution). Still, investors that take a long-term approach to managing their portfolio, and that understand the risks and pitfalls of this constructed “asset class,” may find now an attractive time to begin building allocations to frontier.
In this research note, we offer a snapshot of fundamentals in some key frontier markets, examine historical returns and current valuations, and discuss reasons for investing in frontier markets, as well as the challenges.
Fundamentals: How Healthy Are Frontier Markets Economies?
On the basis of current account balances, debt loads, and exposure to two of today’s key risks (oil prices and China), frontier markets economies as a group face significant but not insurmountable challenges. However, some of these countries have very little in common with each other. The index’s four largest components (Kuwait, Nigeria, Argentina, and Pakistan) are driven by quite different dynamics, and some are healthier than others (Figure 1).
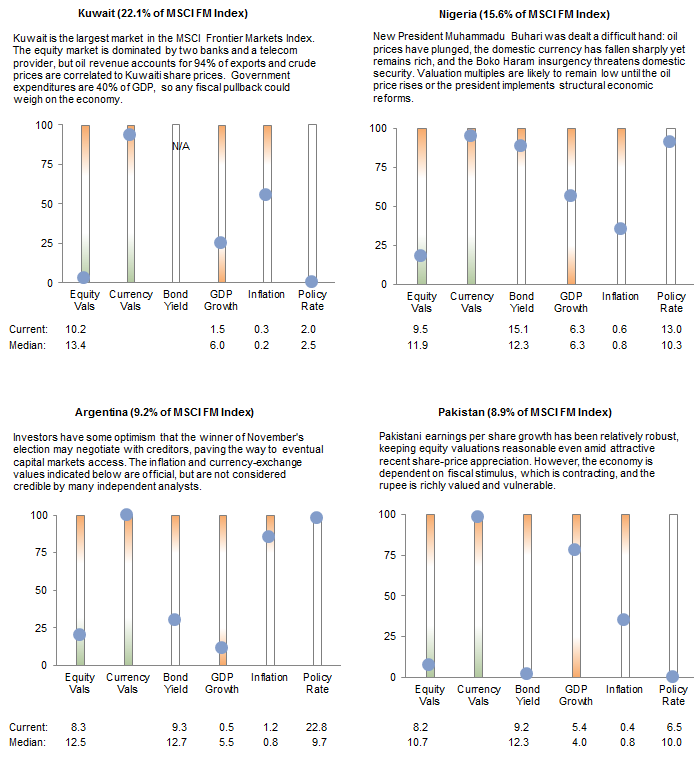
Figure 1. Snapshot of Conditions for the Largest Component Countries of the MSCI Frontier Markets Index
2005–15 • Current Percentile vs Ten-Year Historical
Sources: MSCI Inc. and Thomson Reuters Datastream. MSCI data provided “as is” without any express or implied warranties.
Notes: Policy rates and CPI are as of August 31, 2015. GDP growth data are annual and as of December 31, 2014, but GDP growth for Kuwait is as of December 31, 2013.
Currency vulnerability and volatility in frontier markets is a concern, though less so than for emerging markets today, given the prevalence of pegged or managed currencies.[1]Pegged currencies, of course, are more stable, until the peg breaks. However, for the countries within the frontier equity universe that use pegs, widespread devaluations of managed currencies seem … Continue reading Over the past three years, the US$ returns for emerging markets have lagged the local currency returns by 7.4 ppts annualized. The lag for frontier markets was still substantial, but half as much—3.8 ppts annualized. Nearly one-third of the countries in the MSCI Frontier Markets Index have positive current account balances (including index giant Kuwait), and the index as a whole remains in surplus for now (Figure 2). However, current accounts are deteriorating (and, excluding Kuwait, the index-level surplus nearly disappears), so investors must be aware of the risks.
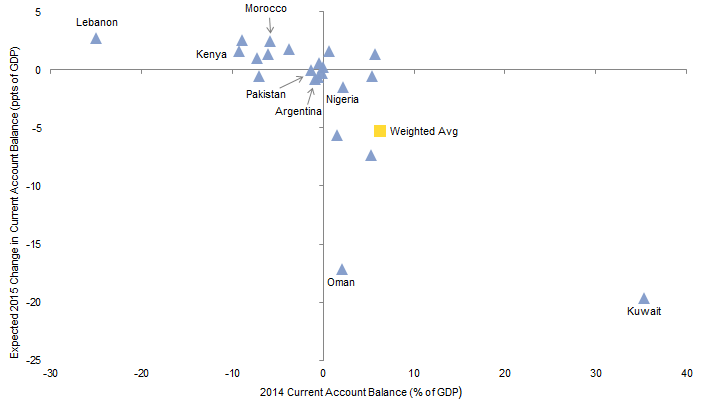
Figure 2. Comparing 2014’s Current Account Balance With Expected Change in 2015
As of September 30, 2015
Sources: International Monetary Fund, MSCI Inc., and World Bank. MSCI data provided “as is” without any express or implied warranties.
Note: Weighted average is the sum of the MSCI Frontier Markets Index’s country weights multiplied by their respective account balance.
Debt issuance by frontier markets borrowers has expanded in recent years, and the use of debt (and ability to service that debt) varies widely. About 45% of frontier markets borrowers currently carry an investment-grade rating, while a slight majority is below investment grade. By comparison, the governments of one-third of emerging equity markets and just 4% of developed equity markets hold credit ratings that are below investment grade.
Frontier markets span a very wide variety of economic exposures, with significant commodity exposure (oil producers Kuwait and Nigeria are the index’s largest positions). Dependence on China as an export destination, another area much on investors’ minds today, is generally modest, though countries like Kuwait and Oman have high exposures to both (Figure 3).[2]We know the level of each country’s oil exports and the level of total exports to China, and we know that 12% of oil exports from the Middle East went to China last year. We do not have data on … Continue reading
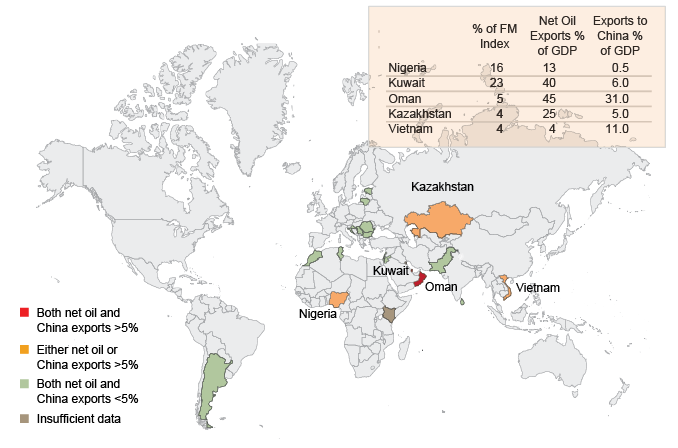
Figure 3. Oil-Related and China-Related Export Reliance Among Frontier Markets Economies
As of December 31, 2014
Sources: Bloomberg L.P., International Monetary Fund, International Trade Center, and MSCI Inc. MSCI data provided “as is” without any express or implied warranties.
Notes: No export data are available for Kenya, Bahrain, or Mauritius. Countries are divided among three categories based on net oil exports and total China exports as a % of GDP: both net oil and China exports >5% (red), either net oil or China exports >5% (orange), and both net oil and China exports <5% (green).
Direct China exposure appears to be somewhat lower for frontier markets than for emerging markets. However, commodity risk is substantial, with net oil exports totaling 7% of the asset class’s GDP. Further, while emerging markets investors that are particularly sensitive to commodity risk can easily tilt toward Asian emerging markets, frontier investors cannot accomplish this kind of tilt easily. Some of the largest and most liquid frontier markets countries are heavily exposed to the oil price, and it would be difficult for a frontier markets manager (or an indexed frontier product) to avoid oil-exporting countries because there is simply not enough aggregate liquidity outside of the oil-exporting countries. That said, frontier markets indexes do not have enormous direct exposure to the companies that produce oil & gas. The energy sector is 9% of the MSCI Frontier Markets Index.[3]However, emerging markets equities are plenty exposed to commodity prices with an even lower sector weight in energy: 7%. But with companies listed in frontier markets likely more domestically (or regionally) focused than emerging markets or developed markets peers, firms outside the energy sector (such as banks, construction-related, and consumer discretionary stocks) can suffer from energy downturns.
Investors comparing emerging markets economies to developed markets economies should also consider that within emerging markets countries, technology industries have helped power economic growth; frontier markets, however, do not currently have comparable tech powerhouses.
Valuations: Undervalued, but Could Get More So
Valuation data for the MSCI Frontier Markets Index only date back about a decade. Using valuation data much further back for several individual countries in the index, we built a basket that mimics the current index’s regional weightings, and we extended that basket’s cyclically adjusted valuation over time. The basket today is trading at just 9 times normalized (return on equity–adjusted) earnings, well below the median multiple of about 12 (Figure 4). Today’s valuation is in the 11th percentile over the past 18 years; assuming no change in normalized earnings, an additional price decline of just 10% would push our primary valuation metric to just 8.5 times normalized earnings, below the threshold at which we would typically call the asset class “very undervalued.”
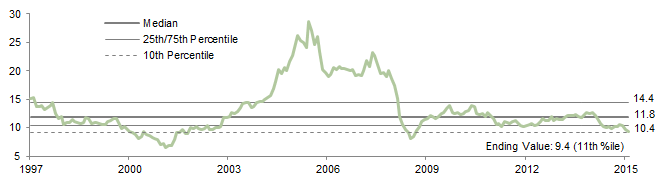
Figure 4. Frontier Markets ROE-Adjusted P/E Ratio
August 31, 1997 – September 30, 2015 • Weighted Average P/E Ratio of Representative Regions
Source: MSCI Inc. MSCI data provided “as is” without any express or implied warranties.
Note: Twelve countries represent four regions from 1997 to 2002, 22 countries represent five regions from 2002 to 2008, and 27 countries represent all six regions from 2008 to present.
This undervaluation is not driven by only one region (Figure 5). Some regions are cheaper than others, but all are below their average post-2007 level, and half are more than 20% below that level. The Gulf Cooperation Council (GCC) region is the cheapest (both in absolute terms and relative to its own history), but it is also economically exposed to low oil prices. No region trades at a normalized P/E multiple above 12.
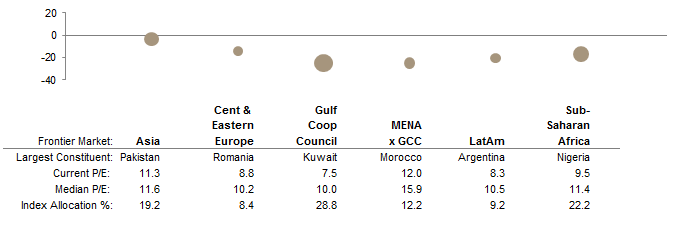
Figure 5. ROE-Adjusted P/E Ratio for Frontier Regions
Compared to Post-2007 History • As of September 30, 2015 • Deviation From Median (%)
Source: MSCI Inc. MSCI data provided “as is” without any express or implied warranties.
While this market could certainly get cheaper (and indeed it has been cheaper 11% of the time during the past 18 years, hitting 6 in 2002), valuations today are attractive. If valuations reverted to their long-term median today via price alone, this would equate to 26% price appreciation.
Of course, investors allocating to frontier markets are typically funding the investment from another equity asset class. Thus, it is useful to examine the relative valuations of frontier equities versus emerging and developed markets (Figure 6). Frontier markets today trade at a 16% discount to emerging markets, just a hair cheaper than their average level over the past 18 years. On the other hand, their discount to developed markets is 44%, about 22% below median. However, discount/premium cycles for equity styles and regions can be long indeed. In 1997, our frontier markets basket traded at a similar discount, yet not until 2004 did the discount finally move back to average levels. Investors thinking about incorporating frontier markets into their portfolios should take a long-term approach and should not be reliant on the discount narrowing in a few quarters or even a few years.
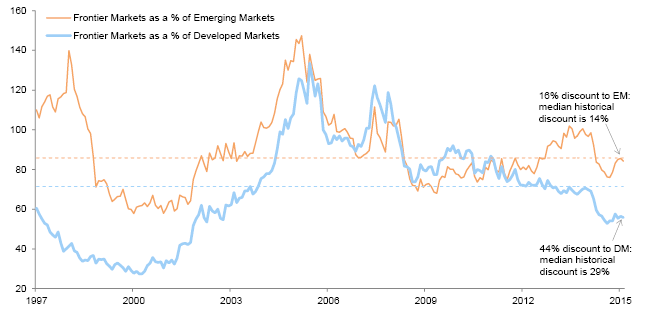
Figure 6. Frontier Markets ROE-Adjusted P/E Relative to Developed and Emerging Markets
August 31, 1997 – September 30, 2015
Source: MSCI Inc. MSCI data provided “as is” without any express or implied warranties.
Cutting Through the Hype: Reasons to Invest and Reasons to Remain Cautious
Investors researching frontier markets from a strategic perspective will likely find many arguments in favor of investing in the asset class, top among which are typically frontier markets’ superior demographics and ability to serve a diversifying role in the equity portfolio. Governance and illiquidity, in contrast, often appear in arguments against investing in frontier markets. We discuss these issues in more depth in the next sections.
To sum up our views, we would caution investors not to be overly enthusiastic about the investment benefits of frontier markets’ superior demographics and solid growth projections. The diversification benefits of frontier markets are real, though investors should probably assume that future correlations of frontier markets with global equities will be structurally higher than they were in the past. While the governance risks of frontier markets relative to emerging equity markets might be exaggerated slightly, investors should look with particular care at illiquidity, which is a very significant constraint for frontier markets investors and their fund managers (but perhaps could point to higher long-run expected returns).
Demographics and economic growth. Unlike the developed world and many emerging markets countries, many frontier markets countries are still experiencing fairly robust population growth. Theoretically, this could boost revenue and earnings growth, support economic development, and ease sovereign debt repayment. We believe that this will be beneficial to the real economies of these countries over the long term. That said, the benefit to the equity indexes of these countries may be limited. Frontier markets indexes do not have large exposures to consumer sectors (less than 10% for consumer staples and consumer discretionary combined). Financials are by far the largest sector (53%), followed by telecom (14%) and energy (9%).[4]In the frontier landscape, financials tend to have simpler business models and balance sheets than in developed markets, so they may have somewhat closer ties to the strength of the country’s … Continue reading In addition, investment managers that are value biased may well be underweight the consumer sectors, because the local affiliates of multinational brewers and other firms tend to be richly priced.
See, for example, “Decades of Data: Global Markets 1900–2014,” Cambridge Associates Chart Book, 2015.
Some long-term forecasts have penciled in strong long-run growth for frontier markets economies, particularly compared to developed markets economies. But our research has indicated that a country’s relative level of economic growth has little or no relationship to the relative returns of that country’s equity indexes. This is likely due in part to the forward-looking nature of markets: growth prospects get priced in to valuations in advance, limiting future upside for stock markets in rapidly growing countries, and moderating the pain for laggards.
Diversification. Diversification is perhaps a stronger argument for owning frontier markets equities. However, investors need to recognize that diversification benefits offered in prior periods are not guaranteed in future periods, and that in fact correlations of frontier markets with emerging and developed markets may be structurally higher in the future than they would have been in prior decades. Today, frontier markets can be traded with an exchange-traded fund, whereas a decade ago, remarkably few global investors owned frontier markets assets. Assets under management for frontier markets equity products have nearly tripled since 2011, soaring from just above $4 billion then to about $12 billion today, according to data from Citi. Over the past 19 years, the median 36-month correlation of monthly frontier markets returns to those of developed markets (MSCI World) has been about 50% (and about 62% to emerging markets returns), as seen in Figure 7.
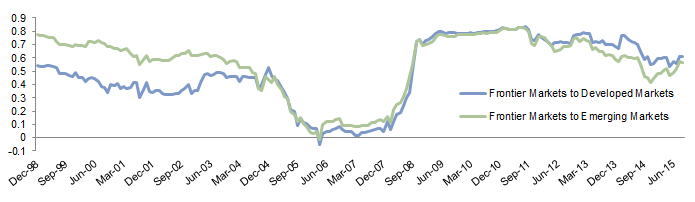
Figure 7. Rolling 36-Month Correlation of Total US$ Returns
December 31, 1998 – September 30, 2015
Sources: MSCI Inc. and Thomson Reuters Datastream. MSCI data provided “as is” without any express or implied warranties.
Notes: Developed and emerging markets are proxied by the MSCI World and MSCI Emerging Markets indexes, respectively. From June 2002 to the present, frontier markets are proxied by the MSCI Frontier Markets Index. Prior to June 2002, they are proxied by a basket weighted in accordance with 2015 MSCI Frontier Markets regional weights and incorporating the returns of the S&P Frontier Markets Africa Index together with MSCI country indexes for Argentina, Jordan, Morocco, Pakistan, and Sri Lanka.
The moderate level of diversification that frontier markets equities will likely still offer is argument for including them in a portfolio even if expected returns were no greater than those for developed markets. Figure 8 shows the efficient frontier for frontier markets and MSCI’s All Country World Index (ACWI includes both developed and emerging markets equities). During the full period, frontier markets outperformed, so including them would have been quite beneficial.[5]Performance shown is in US$ terms. Performance is endpoint sensitive, and investors should not take this one period as an indication of likely performance differentials for future periods. However, we also looked at the overlapping shorter sub-periods within the full period shown, and even though frontier markets sometimes underperformed ACWI and were always more volatile than ACWI, their inclusion tended to lower the volatility of the portfolio compared to ACWI alone.
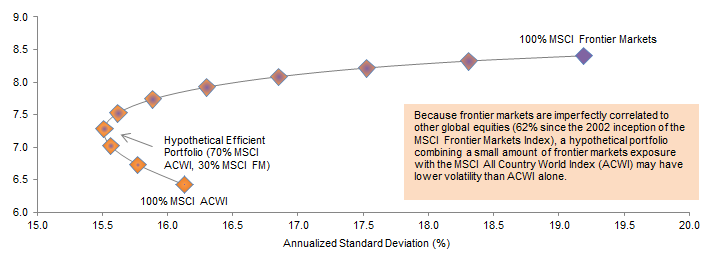
Figure 8. Efficient Frontier for Combinations of MSCI ACWI and Frontier Markets Indexes (Unhedged in US Dollars)
May 31, 2002 – September 30, 2015 • AACR (%)
Source: MSCI Inc. MSCI data provided “as is” without any express or implied warranties.
As a side note, individual frontier markets have low correlations with one another (at least for now). Because of this internal diversification, a substantial portion of the sometimes-formidable volatility of individual frontier markets simply does not translate through to the index level. While the median frontier markets country exhibited an annualized volatility of 19% over the past three years, the volatility of the full index was just 12% annualized, below the 14% annualized standard deviation of the MSCI Emerging Markets Index during the period. As frontier markets mature, and as indexed exposure to these markets becomes more widespread, internal correlations will likely rise, which could cause index volatility to increase somewhat relative to emerging and developed indexes.
Illiquidity. Could illiquidity be a potential reason to own frontier markets? Yes, as we will explain, though it remains a reason to be wary as well.
The companies in the MSCI Frontier Markets Index have a tiny fraction of the trading volume of other broad market segments. The frontier index’s components in total average just $154 million of trades per day; the emerging index has more than 100 times this level of cumulative liquidity (Figure 9). The most liquid company in the frontier index trades about $25 million per day (16% of the volume for the entire index), and the five most liquid stocks together account for 35% of overall trading volume. Liquidity trails off quickly: the median index component turns over only about $600,000 of shares per day. More than one-fifth of the stocks in the index trade less than $100,000 per day; for a frontier manager looking to round out a $300 million portfolio with a 0.5% toehold position in any one of these very thin stocks, six months of careful daily trading might not suffice.
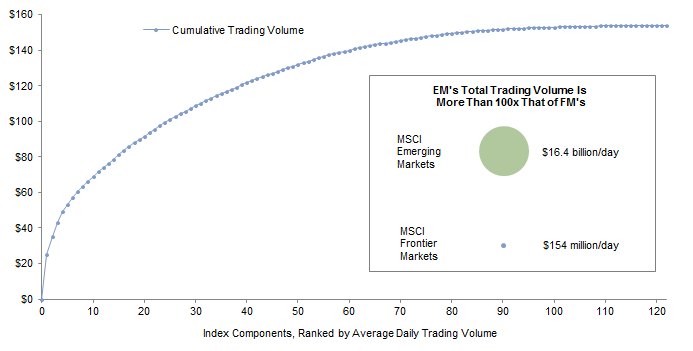
Figure 9. Average Daily US$ Trading Volume of the MSCI Frontier Markets Index
As of September 25, 2015 • US Dollar (Millions)
Sources: FactSet Research Systems and MSCI Inc. MSCI data provided “as is” without any express or implied warranties.
Note: US$ volume is calculated by using 90-day average daily trading volume of the companies.
So what about this formidable illiquidity could possibly get a long-term investor excited? Evidence suggests that illiquid stocks outperform liquid stocks. This is perhaps somewhat intuitive, because illiquidity is a risk, and it also limits the type and quantity of potential buyers. Yale professor Roger Ibbotson and others found that the least liquid quartile of US stocks delivered double the annualized performance of the most liquid quartile from 1972 to 2011: 14.5% versus 7.2%. Further, this research shows that illiquidity is not simply the value effect or small-cap effect in disguise: Ibbotson and his fellow researchers also found that value stocks with low liquidity outperformed those with high liquidity, and that illiquid small-cap stocks outperformed more-liquid peers.[6]Please see Ibbotson et al., “Liquidity as an Investment Style,” Financial Analysts Journal, May/June 2013. The Ibbotson study was limited to US stocks, but frontier markets equities also present investment managers with substantial hurdles, and thus there may be a case for a long-term return premium due to the illiquidity.
However, while illiquidity may be a blessing, we know it is also a curse. Investment managers participating in frontier markets face very real constraints on capacity, on the ability to trade around positions opportunistically, and potentially on the ability to differentiate their portfolios from the benchmark via meaningful overweights. Investors moving money into and out of managers’ funds will also generate trading costs (as managers invest inflows and then raise cash to meet redemptions). Additionally, illiquid stocks might tumble more than more-liquid stocks during some periods of market distress. Indeed, during the second half of 2008, the MSCI Frontier Markets Index returned -54%.[7]It should be noted that this appears to have been more the exception than the rule so far, looking over a relatively long time period. We looked at the performance of the MSCI Frontier Markets Index … Continue reading
Please see Sean McLaughlin et al., “New Frontiers: Qatar and UAE Graduate to Emerging Status, Leaving a Less Liquid Index Behind,” Cambridge Associates Research Brief, May 2014.
Another consideration with some relationship to liquidity is the changing nature of the benchmarks. As noted in the appendix, frontier markets indexes are in flux as countries are promoted into emerging status or downgraded out of the index. In 2014, when MSCI promoted two massive index components to emerging markets status, index funds were forced to churn their portfolios and buy up large amounts of illiquid stocks to replace the departing Qatari and UAE stocks (active managers are of course free to diverge from an index, but if they make no adjustments when index constituents change, then of course their tracking error to the index grows). The iShares MSCI Frontier 100 ETF has underperformed its benchmark by an annualized 285 bps over the past three years, with some of the underperformance likely due to transaction costs incurred to accommodate index shifts and investor flows.[8]The product, with $486 million in AUM, has a total expense ratio of 79 bps. By comparison, the iShares MSCI Emerging Markets ETF underperformed by just 54 bps during the same period, attributable … Continue reading
Finally, investors evaluating a particular manager (or index fund) should consider whether the fund’s liquidity terms are appropriate given the fund’s portfolio, asset size, and shareholder/limited partner base. Investors may wish to contemplate whether quarterly or even less frequent redemption windows might allow an active manager to incorporate more interesting but less liquid stocks than a fund offering daily liquidity.
Governance. Investors in frontier markets may wonder whether they, as owners of common stock, will be at the front of the queue, or at the back behind controlling shareholders, related parties, political figures, or other stakeholders. A cheap share price matters little if common shareholders are not treated fairly, if the company’s accounts are not accurate, or if the company’s revenues and assets benefit parties other than minority shareholders. Transparency International produces an annual Corruption Perceptions Index covering most countries. The five largest countries in the MSCI Frontier Markets Index average a score of 37 (a score of 0 means that a country’s public sector is perceived as very corrupt, while 100 is very clean). The five largest emerging markets countries average a score of 47; the five largest developed markets countries, a score of 79.[9]Please see the Transparency International website: https://www.transparency.org/country/ Of course, this index measures the perception of corruption, rather than measuring corruption directly, and a country’s perception score may have little relationship to the governance quality for listed companies within that country.
Investors have reasons to be skeptical of these investments, but we believe that while active managers will be unable to avoid every scam, they stand a fighting chance of avoiding the most egregious ones. Additionally, investors can perhaps gain some comfort from the 4.3% dividend yield of the frontier markets index today—dividends, after all, are much harder to fake than profits.
Conclusion
Equity investors have a large variety of markets to choose from, and most investors don’t treat frontier markets as a must-own asset class. Frontier markets need to compete with other investments to get into portfolios. As we’ve discussed, frontier markets offer some benefits to investors, including the potential for diversification in the equity portfolio (though not as much as has historically been the case) and potential long-term return benefits from the illiquid nature of the stocks. However, plenty of challenges give investors pause, including that illiquid nature and governance considerations. Valuations are quite low today, and fundamentals don’t look too bad, although generalizing across countries is difficult, and for some individual countries, the outlook is rather poor. Frontier markets are also heavily exposed to the oil price, and a “lower for longer” scenario in oil prices could flow through to disappointing returns for frontier markets equities.
On balance, for investors that take a long-term approach to managing their portfolio and that understand the risks and pitfalls of this constructed “asset class,” today may be an attractive time to begin building allocations to frontier. Given the nature of the market, we would lean toward active management. The index periodically undergoes radical surgery, as frontier countries get promoted to emerging markets status, or emerging countries are demoted to frontier. Products tied to the index are forced to buy or sell these markets, regardless of available liquidity or valuations. On the other hand, investors reviewing actively managed options will see that few of them constrain themselves to the MSCI Frontier Markets Index, in part because illiquidity would sharply limit their capacity and portfolio construction flexibility. Even managers benchmarked to a pure frontier index tend to own either stocks in the emerging index such as South African names, Saudi stocks (which are not yet included in global indexes, but which are somewhat liquid), or both. Active managers may also include some stocks domiciled in countries with markets too puny even for a frontier index, but these holdings would likely be quite small. Some managers may also benchmark to the MSCI Frontier Emerging Index, which incorporates both frontier markets countries and smaller emerging markets components such as the Philippines and Colombia.
Appendix: What Are Frontier Markets?
Index providers differ when determining which countries fall into frontier markets indexes versus into emerging markets indexes (or into neither index). MSCI’s index includes 24 countries, whereas Standard & Poor’s index includes 34. Across providers, index components regularly migrate from frontier to emerging or back.
Generally, the country’s level of economic development has much less to do with the inclusion decision than its level of integration with global capital markets. Bahrain, which MSCI classifies as a frontier market, has more than four times the GDP per capita of emerging markets stalwart Thailand. Characteristics that make a country more likely to be designated by index providers as a frontier market including heavy restrictions on foreign ownership of shares and a very low level of liquidity.
Membership in the MSCI index has shifted over time. Five years ago, the Gulf Cooperation Council (GCC) market dominated the index, but the 2014 promotion of the United Arab Emirates and Qatar shifted the index away from GCC dominance. At the same time, Sub-Saharan Africa (particularly Nigeria) has grown in its influence.
Frontier markets membership is continually in flux, with emerging markets indexes siphoning off frontier markets countries as their equity capital markets expand and become more developed. Because of this, frontier markets as defined by indexes are likely to remain tiny as a percentage of global equity markets. They have rarely surpassed 0.5% of the overall global equity market, while emerging markets equities have grown from about 2% of global equities 25 years ago to 15% today. This is not to say that frontier markets are not growing. Had Qatar and the United Arab Emirates remained in the frontier index, the market cap of the MSCI Frontier Markets Index would have shown roughly 8% annualized growth (with these two countries’ promotion to the MSCI Emerging Markets Index, the market cap is down slightly from 2008 levels).
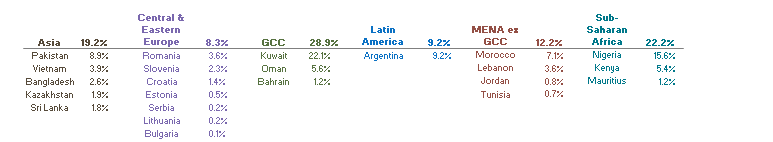
Regional Breakdown of MSCI Frontier Markets Index
As of September 30, 2015 • Index Allocations in Percentage
Source: MSCI Inc. MSCI data provided “as is” without any express or implied warranties.
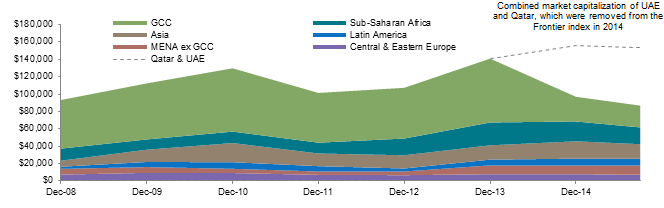
Market Capitalization of MSCI Frontier Markets Index and Underlying Regions
December 31, 2008 – September 30, 2015 • Market Cap (millions)
Sources: FactSet Research Systems and MSCI Inc. MSCI data provided “as is” without any express or implied warranties.
Sean McLaughlin, Managing Director
Nroop Bhavsar, Senior Investment Associate
Footnotes