- Today’s estimated global overhang is $909 billion net of fees, with US private equity, European private equity, and real estate the primary contributors.
- With capital appearing to be deployed at a slower pace than historically, the overhang is larger than expected. Too much overhang and the pressure to put capital to work before it expires could amplify competition and place upward pressure on transaction values, impacting returns.
- Investors may do well to stay alert, note current market conditions, review their commitment programs against those conditions, and set a course for steadily building their program while avoiding the market swells.
- A program prepared for market volatility may create openings for selectively establishing quality manager relationships for long-term portfolio benefit.
Following the global financial crisis, we were the first to measure the capital overhang in the US private equity industry and have continued to track its movements, noting that it has been primarily receding. The capital overhang represents unexpired, uncalled capital commitments and is essentially the industry’s dry powder. The size of the overhang at any given point in time is impacted by the overall fund-raising environment and the velocity at which the capital is put to work, which is dependent on transaction volume, equity contributions, and the availability of credit in certain strategies. We are now taking the measure of the global overhang and introducing a framework for assessing overhang progression, offering another perspective on the private investment industry’s immediate capital supply. Like Goldilocks, we want to know if private capital is being deployed slower than normal, faster than normal, or right on time.
Think Globally, Measure Locally
Globally, private capital and real assets funds raised a total of $1.9 trillion from 2008 to 2013, of which we estimate about 45% had been called as of December 31, 2013, [1]Please see Notes on the Data at the end of this article for further explanation. leaving a $909 billion global overhang net of fees. The size of this number in any one geography or strategy would most certainly be cause for alarm; however, this number is the aggregation of multiple underlying overhang estimates. As shown in Figure 1, simply splitting the $909 billion into two categories, private capital and real assets, results in a global overhang of $722 billion and $187 billion, respectively, and further dissection thins out the overhang for various geographies and strategies even more. These localized overhang amounts are much more relevant for investors and could be the cause of either more or less concern, depending on geography or strategy. For example, venture capital and energy funds often reserve material amounts of capital for deployment over the life of an investment, beyond the expiration of the investment period. Thus, a more sizable overhang in those categories may not necessarily be cause for alarm.
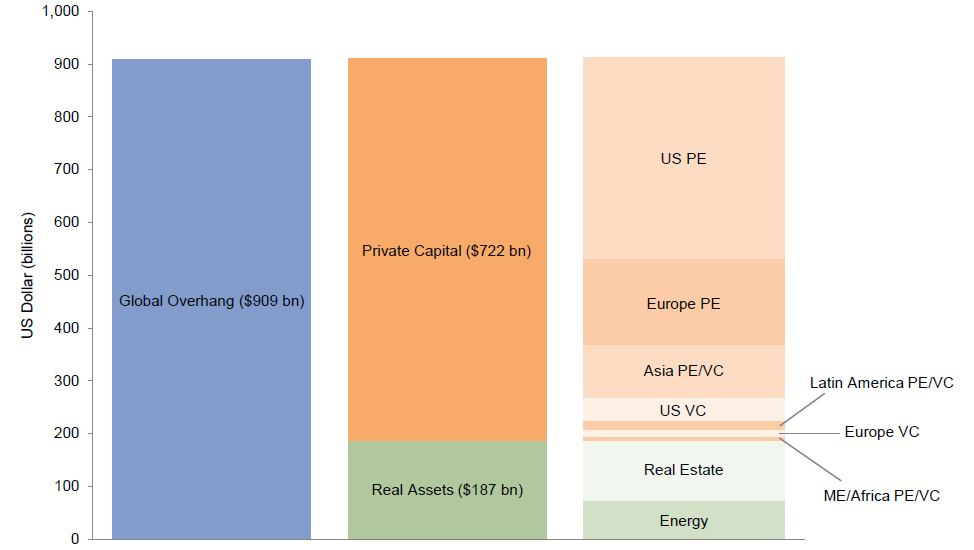
Figure 1. Estimated Global Overhang: 2008–13
As of December 31, 2013
The primary contributors to the global overhang, US private equity, European private equity, and global real estate, compose 72% of the current tally—more than 25% below their peak in 2009, when together they measured $893 billion (Figure 2). The peak overhang reflected the robust fund-raising environment just prior to the global financial crisis, and as the investment periods for those vintage years reached their expiration dates, that capital has been invested or extinguished. As the private investment industry continues to recover from the crisis, annual commitments are rising, although so far have yet to match the exuberance of the last zenith. In the United States, the largest single private capital market, the last five years of ever-increasing private equity commitments still only represent about 75% of the total capital raised from 2006 through 2008.

Figure 2. Estimated Annual Overhang: Top Three Private Markets
2005–13
Bye Bye “Golden Era”
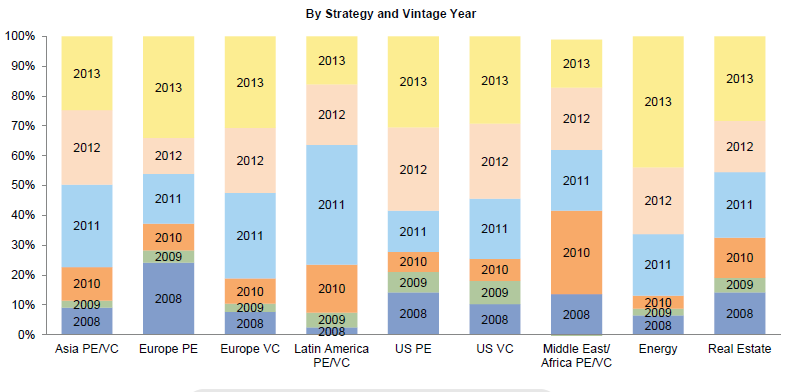
Measuring the global overhang by vintage year (Figure 3), the expiration of investment periods from the last fund-raising market peak (2006–08) results in the top vintage year contributor being 2013, followed by 2012 and 2011. The last remaining vestige of the so-called golden era is 2008, coming in at fourth place, but its contribution to the overhang is about to expire—we are well past last call for that vintage. Many fund-raising efforts stalled during the global financial crisis and investors may have agreed to extensions or other accommodations, but time is running out for this last remnant. Granted, much of the capital invested by 2006–08 vintage year funds has yet to be realized, so the final chapter is not yet written, but there is little left to invest at this point (see the Appendix for further analysis of overhang by strategy and vintage year.)
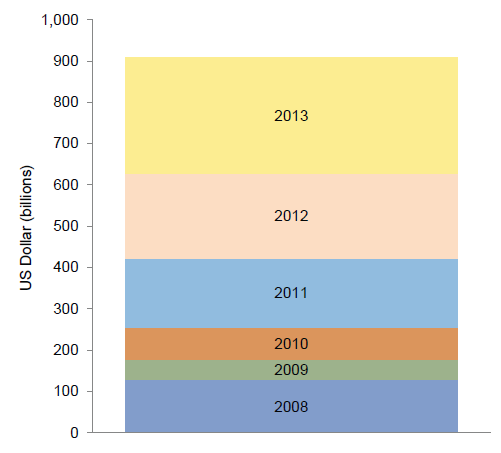
Figure 3. Estimated Global Overhang by Vintage Year
As of December 31, 2013
The Biggest Is Currently the Smallest, But Still Can Pack a Punch
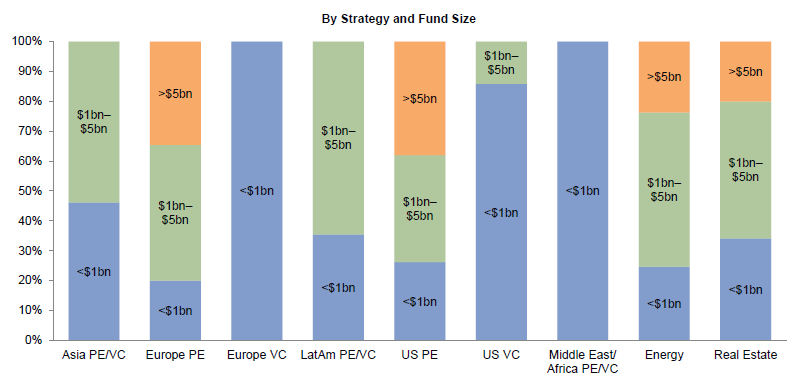
Evaluating the global overhang by fund size categories revealed some interesting accumulations, as shown in Figure 4: funds between $1 billion and $5 billion in size represented $370 billion (41% of the total), followed by funds of less than $1 billion at $299 billion (33%) and funds of greater than $5 billion at $240 billion (26%). Currently the largest category by volume is the middle category, which not only experiences competition from within but also from the size categories on either side. That said, these tallies by no means imply the largest funds can breathe a collective sigh of relief.
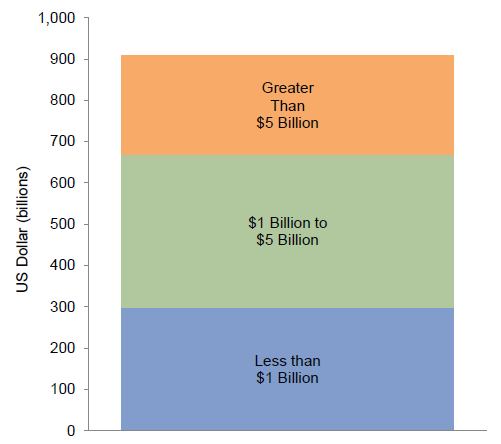
Figure 4. Estimated Global Overhang by Fund Size
As of December 31, 2013
The majority of funds in the greater than $5 billion category are global in scope and pursue investments in most (usually developed) corners of the globe. Most of the funds in this category are active in North America, Western Europe, and Asian markets—anywhere rule of law and leverage are available in familiar ways—likely resulting in most of the $240 billion looking at the same set of investment opportunities. And to the extent there are not enough large transactions for these managers to pursue (Figure 5), many may seek to deploy capital elsewhere, including smaller opportunities, adjacent strategies, or new geographies, impacting market conditions wherever they go (see the Appendix for further analysis of overhang by strategy and fund size).
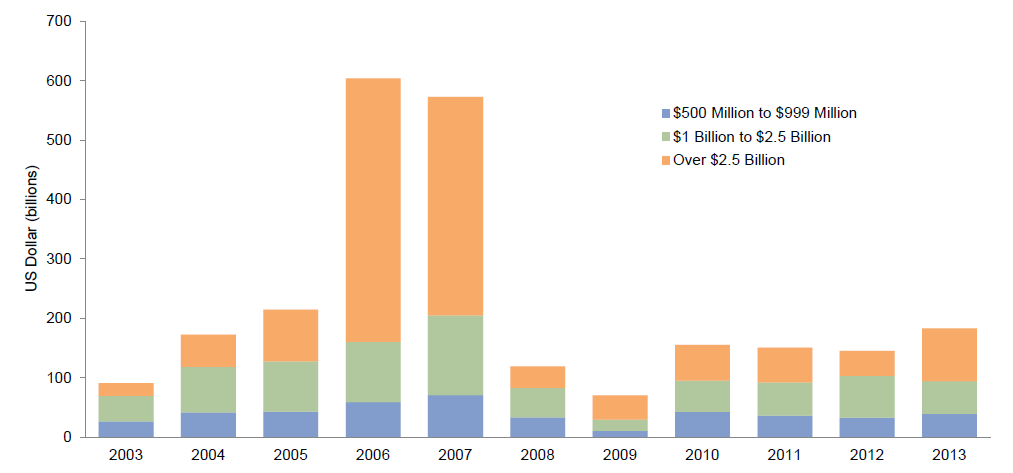
Figure 5. Global Financial Sponsor–Backed M&A Deal Activity
2003–13
Funds of less than $1 billion represent the entry level category where most new fund managers make their debut, succeed or fail, and move up or down in fund size accordingly. As managers increase in fund size, they “graduate” from this category to the next one and, in most cases, leave the lower-middle market behind. Those first-time funds that become last-time funds exit the overhang entirely, leaving no trace but possibly replaced by the next emerging manager. Thus, the lower-middle market overhang tends to fluctuate the least in terms of size.
Some Swelling May Occur. Given the primarily up or out dynamics of the lower-middle market fund raising, the upper registers of the overhang stand to be impacted the most by an exuberant fund-raising environment. Commitments to private capital and real assets have been rising over the last three years and so are worth monitoring. If just ten funds successfully double in size from $1.5 billion to $3 billion, an additional $15 billion would be added to the $1 billion to $5 billion overhang; if just ten funds successfully double from $7.5 billion to $15 billion, an additional $75 billion would be added to the greater than $5 billion category. Just ten funds. A sudden surge in fund raising at any level, but most especially in the largest funds, could dramatically increase the overhang practically overnight. If transaction volumes or sizes do not increase commensurately to accommodate the increase funds raised, the supply/demand dynamic will suppress return potential.
Is the Overhang Too Much, Too Little, or Just Right?
Too much overhang and the pressure to put capital to work before it expires could amplify competition and place upward pressure on transaction values, impacting returns. There is always competition for the vast majority of transactions, but is capital being deployed faster than normal, slower than normal, or right on time? To make that determination, we examined the capital call patterns of over 3,400 funds in our database, spanning vintage years from 1990 through 2013, noting the average percentage called in the fund’s first year, second year, and so on, with the resulting “call pattern” shown in Figure 6. By applying that call pattern to the current overhang, we then calculated a predicted overhang and compared it to the current overhang estimate.

Figure 6. Called Capital Analysis: Average Annual Pace
As of December 31, 2013
TOO MUCH!
On the whole, capital does not appear to be deploying along expected historical rates. Comparing the predicted overhang to the current overhang, the current global overhang number of $909 billion is 23% larger, or nearly $168 billion higher, than the predicted overhang of $741 billion. Investment strategies contributing the most to the buildup are US private equity and European private equity, which represent 63% of the difference. While US venture capital and European venture capital invested ahead of expectations in several of the years analyzed, winnowing down their respective capital supply, all strategies currently have more overhang than predicted by the model, although the degree of excess varies widely (Figure 7).
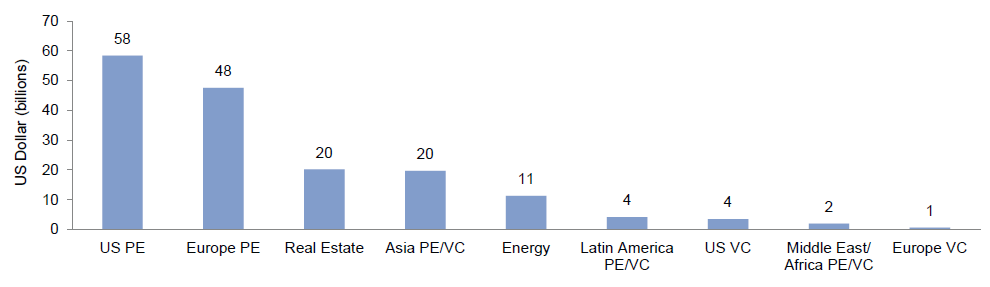
Figure 7. Predicted Overhang vs Current Estimated Overhang: Which Strategies Lag the Most?
As of December 31, 2013
On a vintage year basis, the global overhang towers over the predicted overhang primarily for the 2008 vintage, which accounts for over half of the approximate $168 billion overage (Figure 8). As we noted, this vintage is on its last legs, and its eventual absence will bring the two overhang calculations into closer alignment, all else held constant. Of note, 2013 appears to be investing ahead of schedule, but not by much, and being a recent vintage has time to meander.

Figure 8. Predicted Overhang vs Current Estimated Overhang: Which Vintage Years Lag the Most?
As of December 31, 2013
The Shadow Knows
Not to be underestimated is the amount of “shadow” overhang, which we define as intent to invest in private equity outside of a traditional fund structure. This encompasses institutions participating in co-investment opportunities or pursuing direct investments by their own teams or via teams that operate outside of a commingled pool, such as independent sponsors or corporate strategic investors. The shadow overhang can wax and wane according to investor capability, appetite, and supply, but could easily match the official overhang estimate due to the sizable institutions that often state this kind of intent. However, because there is often no expiration date on this additional capital, the shadow overhang may cause a fright, but not much else, to most corners of the market, except perhaps the larger private capital market due to the size of the institutions.
What’s a Goldilocks to Do?
As limited partners in private investments, key controllable decisions include whether to invest in private capital at all, manager selection, and amount. These decisions play out against the backdrop of an overall program, which itself could be at varying stages of development. Astute and observant investors in private capital know private equity and venture capital are long-term investment strategies that can take five to seven years to evince returns. Such investors also know these markets are cyclical. The overhang is but one indicator to use when deciding whether, when, and where to deploy capital in private investments.
Do NOT Take a Nap
Investors may do well to stay alert, note current market conditions, review their commitment programs against those conditions, and set a course for steadily building their program while avoiding the market swells. Though current market conditions are frothy—with record-breaking distributions to limited partners underpinning rising commitments, cresting acquisition multiples, easily available credit, and robust capital markets—they will change and the best thing to do just might be to wait it out. The overhang, which is impacted constantly by fund raising and investment pace, should take several years to invest and will most likely be deployed in variable market conditions. A program prepared for market volatility may create openings for selectively establishing quality manager relationships for long-term portfolio benefit.
Appendix
Appendix. Estimated Global Overhang Analysis
As of December 31, 2013
Notes on the Data
We begin with annual fund-raising numbers and then apply a percent paid-in by similar-themed funds tracked by Cambridge Associates LLC (CA) in the corresponding vintage year; the resulting fi gure is an estimated paid-in dollar amount for the total market. The difference between the annual fund-raising number and the estimated paid-in fi gure is then adjusted for remaining fees using a calculation that assumes a ten-year life span with a 1.5% fee decreasing linearly over the life of a fund, and no re-investment of capital. Fund size overhang by vintage year is also estimated by similar-themed funds tracked by CA. CA preliminary data as of December 31, 2013, were used at the time of this report.
Exhibit Notes
Estimated Global Overhang: 2008–13
Sources: Asia Private Equity Review, Cambridge Associates LLC, Dow Jones and Company, Inc., Emerging Markets Private Equity Association, European Venture Capital Association, National Venture Capital Association, and Thomson Reuters Datastream.
Estimated Annual Overhang: Top Three Private Markets
Sources: Cambridge Associates LLC, Dow Jones and Company, Inc., European Venture Capital Association, and Thomson Reuters Datastream.
Notes: Data shown for the three largest private markets by overhang: US private equity, European private equity, and real estate. Data show the six-year overhang value as of each year-end. For example, as of December 2005, there was $401 billion in overhang for the years 2000–05; as of December 2006, there was $595 billion for the years 2001–06.
Estimated Global Overhang by Vintage Year
Sources: Asia Private Equity Review, Cambridge Associates LLC, Dow Jones and Company, Inc., Emerging Markets Private Equity Association, European Venture Capital Association, National Venture Capital Association, and Thomson Reuters Datastream.
Estimated Global Overhang by Fund Size
Sources: Asia Private Equity Review, Cambridge Associates LLC, Dow Jones and Company, Inc., Emerging Markets Private Equity Association, European Venture Capital Association, National Venture Capital Association, and Thomson Reuters Datastream.
Global Financial Sponsor–Backed M&A Deal Activity
Source: Dealogic.
Notes: Dealogic updates its database on a regular basis, therefore historical data may change. Deal data based on disclosed values.
Called Capital Analysis: Average Annual Pace
Source: Cambridge Associates LLC.
Predicted Overhang vs Current Estimated Overhang: Which Strategies Lag the Most?
Sources: Asia Private Equity Review, Cambridge Associates LLC, Dow Jones and Company, Inc., Emerging Markets Private Equity Association, European Venture Capital Association, National Venture Capital Association, and Thomson Reuters Datastream.
Predicted Overhang vs Current Estimated Overhang: Which Vintage Years Lag the Most/
Sources: Asia Private Equity Review, Cambridge Associates LLC, Dow Jones and Company, Inc., Emerging Markets Private Equity Association, European Venture Capital Association, National Venture Capital Association, and Thomson Reuters Datastream.
Estimated Global Overhang Analysis
Sources: Asia Private Equity Review, Cambridge Associates LLC, Dow Jones and Company, Inc., Emerging Markets Private Equity Association, European Venture Capital Association, National Venture Capital Association, and Thomson Reuters Datastream.
Footnotes