Plans with active participants need a holistic, flexible risk budgeting approach—not a simple glide path
- While up to 70% of all single-employer pension plans have participants who are still accruing benefits, risk management solutions discussed in the pension community typically focus on the needs of the other 30% of plans—those that are hard frozen.
- The mechanistic “glide path” approach tailored to hard-frozen plans is likely suboptimal for accruing plans, as it would lock in the need for permanently higher contributions.
- We recommend a more flexible, holistic risk budgeting approach that seeks to maximize expected return subject to each sponsor’s unique risk tolerance.
- Pursuing excess returns through active, alpha-driven strategies is particularly valuable for accruing plans, which face many years of future benefit accruals that must be met through either asset returns or contributions.
How many US defined benefit pension plans have participants who are still accruing benefits? Media coverage of large, high-profile plan freezes or buyouts may bias your guess downward, and the answer may thus surprise you: up to 70%, according to data from the Pension Benefit Guarantee Corporation (PBGC).[1]PBGC study based on premium filings as of November 1, 2013, (2012 filing for calendar year plans with more than 100 participants). Despite this, many consultants and advisors have focused on risk management solutions that are tailored to the smaller percentage of hard-frozen plans, in which no participants are accruing benefits. The cornerstone of their advice is the now-ubiquitous (but overly simplistic) glide path that mechanically shifts assets from growth-oriented assets to liability-hedging fixed income as a way to reduce surplus risk. However, implementing such an approach for the “forgotten 70%” of accruing plans will likely be suboptimal and painful. In this paper, we consider how the unique needs of accruing plans are not met by a “one-size-fits-all” risk management strategy and suggest an alternative framework for improving funded status and minimizing future contributions at an appropriate level of risk.
Accruing Plans Have Different Needs
Defined benefit pension plans with participants who are still accruing benefits face different challenges than hard-frozen plans. Examining the typical liability cash flow pattern and its evolution over time for accruing and hard-frozen plans highlights some of the key differences. Figure 1 shows the nominal liability cash flow pattern for a single hypothetical plan under three different assumptions relating to the plan’s accrual status. The blue area represents the cash flows for the plan if it were hard frozen (i.e., no current participants are accruing benefits, and the plan is not open to new participants). The green and orange areas represent the same plan’s cash flows if it were similar to the “forgotten 70%” with existing participants who are accruing benefits. The green area represents the plan if it were soft frozen, in which current participants continue to accrue service benefits, but no new participants can enter. The higher nominal liability values for soft-frozen plans versus hard-frozen plans at the same time horizon are a result of the soft-frozen plan’s normal cost, which accounts for future compensation increases and additional years of service for current plan participants. The orange area represents a plan that is fully open to existing and future participants and includes the hypothetical liability accruals that will be earned by all future employees.
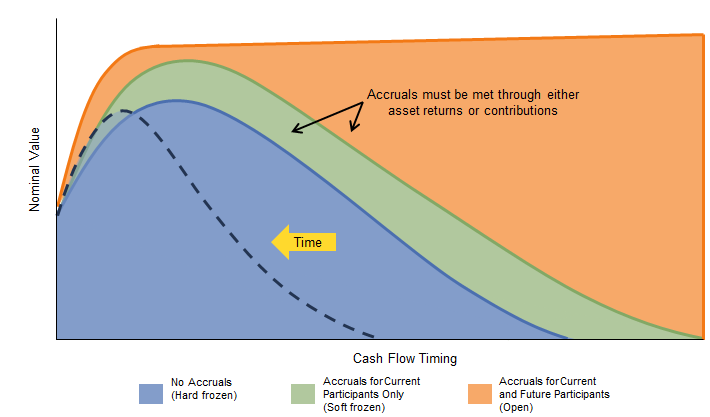
Figure 1. Cash Flows of a Hypothetical Plan With Different Accrual Assumptions
This comparison reveals two primary differences. First, the nominal (and present) value of the liability cash flows is higher for accruing plans than for hard-frozen plans. Importantly, the additional liability, represented by the green and orange areas, must be met through asset returns, sponsor contributions, or a combination of the two. Second, the evolution of these cash flows over time differs. As shown by the dotted line in the figure, the duration of the hard-frozen plan’s cash flows steadily declines over time as benefit payments are made and no new accruals are added. This “duration drift” occurs more slowly for a soft-frozen plan and may not occur at all for an open plan. This suggests that accruing plans can take a longer investment horizon than hard-frozen plans, as there is more time to adjust investment or funding policy in the event of a near-term reduction in funded status.
Given the need to meet a growing nominal liability and the ability to take a longer investment time horizon, accruing plans face different incentives than hard-frozen plans when determining an appropriate surplus risk tolerance. This difference is greatest if we assume that the plan has reached its “fully funded” target, usually 100%–110% of the liability. The sponsor of a “fully funded” hard-frozen plan has little incentive to take on a high level of surplus risk, given the limited upside of accumulating additional surplus. Any significant capital remaining after either terminating the plan or paying the final benefit is difficult for the sponsor to access for other purposes. However, an asset drawdown from assuming too much surplus risk may push the plan below 100% funded, resulting in a required contribution that could have been easily avoided. Worse, the plan has a relatively shorter time frame to make that contribution given the shrinking duration of its cash flows.
Accruing plans, on the other hand, have a liability whose nominal value grows over time as employees earn additional service benefits. Absent any sponsor contributions or asset growth above the rate of increase in the liability, funded status would naturally deteriorate over time. To offset the need for future required contributions, the sponsor of an accruing plan can assume an appropriate level of surplus risk with the goal of achieving excess returns. The question of course is then: once an appropriate level of surplus risk is determined, how do plans maximize return?
The Need for a Different Approach
Despite hard-frozen and accruing plans’ different long-term incentives to pursue excess returns (and even the different risk tolerances among sponsors within these two categories), many industry participants have embraced the risk management concept of what we’ll refer to as a simple glide path approach, illustrated in Figure 2. The premise of this approach is that as funded status increases, assets should be shifted on a straight-line, pro-rata basis from growth assets (typically equity-centric) to liability-hedging assets (typically long-duration fixed income). For example, in the glide path displayed in Figure 2, a funded status of 80% would imply that 60% of the portfolio should be invested in growth assets and 40% in liability-hedging assets. This approach gained traction in the industry primarily because of its appealing simplicity and was originally targeted at hard-frozen plans seeking an “end game.”
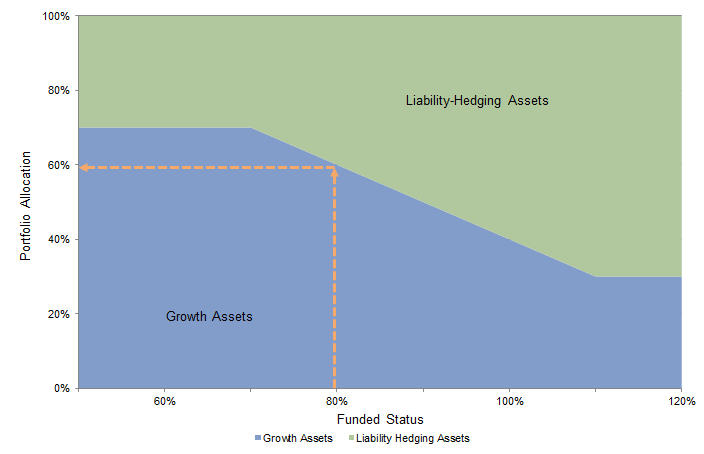
Figure 2. Illustration of a Simple Glide Path
Among the critical problems with this approach is that it results in a “one-size-fits-all” assumed level of surplus risk tolerance and expected return for all plans without consideration of each plan’s unique liability, institution-specific goals and constraints, or whether the plan is accruing benefits or hard frozen. It also implicitly assumes every sponsor has the same risk tolerance.
These assumptions are particularly harmful to accruing plans for two reasons. First, there is no recognition that the long-term value of excess returns is more meaningful for accruing plans than for hard-frozen plans and that accruing plans have a longer time horizon over which they will benefit from excess return generation. To reduce required future contributions from future accruals, the sponsor of an accruing plan will likely target a higher level of excess returns, subject to its unique risk tolerance. Second, as funded status increases, increasing the allocation to fixed income (which is currently unattractively valued) will lower the total portfolio’s expected returns on both an absolute and excess return basis, thereby increasing aggregate expected contributions. Therefore, if an accruing plan were to adopt the simple glide path approach, it would lock in higher contributions as it moves down the glide path. Locking in higher contributions in exchange for less volatile funded status and contributions may make sense for many hard-frozen plans with a short time horizon, but it is very unlikely to be an appropriate strategy for the most of the “forgotten 70%.”
We agree with the premise that as a plan’s funded status changes, adjusting the level of surplus risk via dynamic asset allocation decisions is appropriate. However, the pension community is pushing a “one-size-fits-all” glide path on all plans to achieve this when, in many cases, it will not be appropriate for members of the “forgotten 70%”—and even in cases where it is appropriate, it would be very surprising if the same glide path were suitable for all sponsors despite differences in plan status (hard frozen or accruing), need for return, and institutional risk tolerance. This is why, in our work with accruing plans, we take a different approach that focuses on two general strategies. First, we consider surplus risk and expected return as inputs to the asset allocation decision via a comprehensive risk-budgeting process. Second, as the plan becomes better funded over time and as risk tolerance changes, we employ a more flexible portfolio construction approach that focuses on maximizing expected return at the appropriate level of surplus risk.
Be Smarter With Your Risk Budget
The top half of Figure 3 shows the portfolio construction process implied by the simple glide path approach. As shown, the plan’s current funded status is typically the dominant (and in some cases the only) input into the portfolio construction process. The process itself is mechanical (as was shown in Figure 2), in that it adjusts the relative size of the growth and liability-hedging portfolios, resulting in a portfolio with a prescribed level of expected return and surplus risk. The critical problem with this approach is that at any given level of funded status, the level of surplus risk and expected return are outputs, rather than clearly defined inputs, into the portfolio construction process. In addition, focusing on the size rather than the composition of the growth and hedging portfolios typically results in a portfolio with a high level of directional equity beta exposure—leaving the plan vulnerable to the “perfect storm” of declining equity prices and lower interest rates, which has occurred several times in only the past few years.
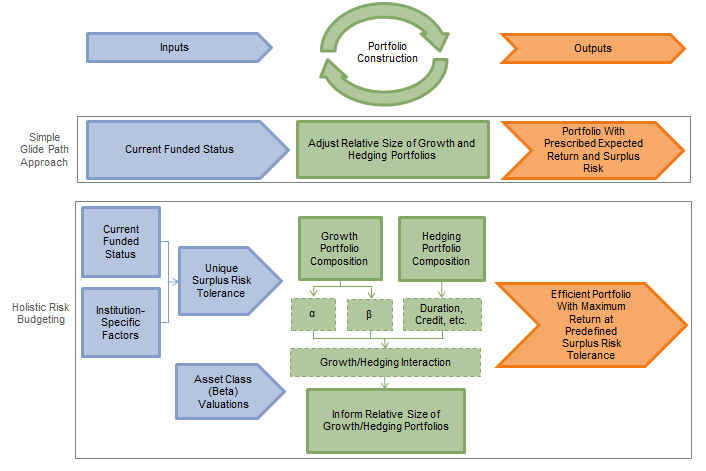
Figure 3. Comparison of the Simple Glide Path and Holistic Risk Budgeting Approaches
The bottom half of Figure 3 is an overview of a process we have long advocated, referred to as a holistic risk-budgeting process. This process remedies the problems with the simple glide path approach at each stage of portfolio construction and results in a portfolio that is better suited to address the unique needs of accruing plans. (The process is also suitable for hard-frozen plans, but that is not the focus of this paper.)
First, the current funded status and a number of institution-specific factors are used to define the sponsor’s unique risk tolerance. The size of the plan relative to the sponsor’s balance sheet, the size of potential contributions relative to the sponsor’s expected free cash flow, and the correlation of the sponsor’s operating risks with the pension plan’s assets are important factors to consider. For accruing plans in particular, institutional risk tolerance—or the willingness and ability to absorb funded-status drawdown risk in exchange for higher long-term returns and thus lower aggregate contributions—is critical. This willingness will vary by sponsor, falling somewhere between the desire to make regular contributions with little variety in value (low surplus risk tolerance) to the possibility of making lower contributions in aggregate, but in larger amounts when they are required (high surplus risk tolerance). Risk tolerance can be expressed in terms of the volatility of funded status, or in terms of downside risk, such as Surplus-at-Risk (similar to the asset-only concept of Value-at-Risk).
The process of linking the sponsor’s liabilities with assets begins with analyzing the sponsor’s unique risk tolerance and current asset valuations. Portfolio construction focuses on controlling risk both within and between the growth and liability-hedging portfolios. The simple glide path approach assumes a relatively uniform growth portfolio profile, typically with high directional equity beta exposure, and gives little consideration to current asset valuations. However, it is possible to build a smarter growth portfolio by allocating to diversified, attractively valued sources of beta and/or by allocating to strategies and managers with high alpha potential but lower beta exposure (for example, long/short, absolute return, arbitrage, and market-neutral hedge funds). Open and soft-frozen plans with a longer time horizon and lower liquidity needs can allocate to higher-alpha strategies like private equity or venture capital.
For our insights focused on the liability-hedging portfolio, please see “Constructing a Liability Hedging Portfolio: A Guide to Best Practices for US Pension Plans,” Cambridge Associates Research Report, May 2014.
Although the liability-hedging portfolio typically receives outsized attention in liability-driven investing (LDI) strategies, we emphasize that it is only one part of a more holistic portfolio construction process, as the interaction of the growth and liability-hedging portfolio must be considered. For example, the relative mix of credit and Treasury exposure within the liability-hedging portfolio should be informed by the size and equity beta of the growth portfolio (as equity tends to be correlated with credit, particularly in times of stress). Note that, in contrast to the simple glide path approach, the relative size of the growth and hedging portfolios is but an additional lever that can be used to control surplus risk, and should be informed by the portfolios’ composition and interaction.
A More Flexible Path Forward
The output of the holistic risk-budgeting process is a capital and risk-efficient portfolio designed to maximize return at a predefined, appropriate level of surplus risk. However, this appropriate level changes over time with alterations in the plan’s funded status, institution-specific factors, and asset class valuations. The focus is always on maximizing return at the targeted level of risk, and a change in any of these factors will result in changes to portfolio implementation. If a change is required it can be done, as discussed earlier, by altering the composition and/or size of the growth and hedging portfolios.
Figure 4 highlights the potential benefits of pursuing a more flexible and sophisticated approach that includes an allocation to nontraditional equity beta sources and high alpha potential investments. The blue line represents the surplus risk frontier for a hypothetical plan, plotting the expected return in excess of the liability versus the level of surplus risk for passively implemented portfolios. For a pension plan, the “risk-free” asset is a hypothetical portfolio that exactly hedges the liability—represented by Portfolio A in the figure. If the sponsor’s risk tolerance is, for example, 8%, then a purely passive portfolio (portfolio B1 in the figure) would result in an expected excess return of 2.5%. However, by capturing alpha and better diversifying across market betas, it is possible to reach a higher level of expected excess return—3.5%—for the same level of surplus risk, represented by portfolio B2. A sponsor that wished to achieve a similar level of expected excess return with a passive portfolio would choose portfolio C, and surplus risk would increase to a higher level, 9%. Taking on more surplus risk than is needed would leave the portfolio vulnerable to significantly larger funded status drawdown risk in a poor economic environment, requiring higher future contributions at a time when many sponsors’ operations may also be under stress. On the other hand, lower beta exposure combined with portfolio alpha can better preserve portfolio value in equity market downturns while maintaining returns in strongly positive markets.
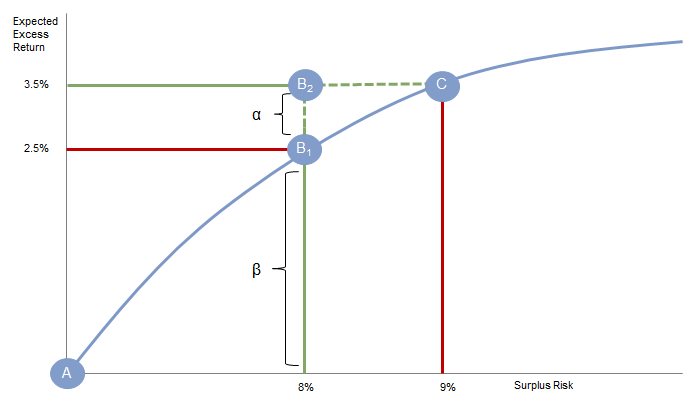
Figure 4. Surplus Risk Frontier
This is particularly important in the current low-rate environment where future expected returns from beta sources appear muted, and it demonstrates why we often state that alpha is not optional unless a sponsor wants to accept lower returns and higher contributions or is willing to increase risk. Implementation of this more flexible approach is not without its challenges, of course. It requires that the sponsor access significant resources and expertise for manager selection, implementation, and risk management. However, the difference between portfolios B1 and B2 represents real money that would otherwise need to be made up with contributions. This will be very significant for the “forgotten 70%” that have a long horizon and many future years of benefit accruals.
Conclusion
Two key objectives for accruing plans that support their need to keep up with nominal liability growth are generating excess returns and carefully controlling risk. A simple pension investment and risk management strategy, including the simple “one-size-fits-all” glide path approach, achieves neither of these. Every plan faces unique circumstances and therefore has a different risk tolerance and return goal that need to be clearly defined before constructing the portfolio. Building a smarter, more diversified growth portfolio with high alpha potential opens the possibility of shifting fewer assets to the currently low-yielding liability-hedging portfolio as a way to control surplus risk. If implemented effectively, the plan can either reduce risk without lowering expected return or increase expected return at the targeted level of risk. Experience has shown us that this holistic approach reduces future contributions and, importantly, the volatility of future contributions.
We see little effort in the pension community, or at most pension conferences, to address the needs of the “forgotten 70%.” We hope this note starts a much needed dialogue on how the “forgotten 70%” should approach pension oversight and strategy. We are confident that many of these forgotten plans will be well served by charting their own path, rather than gliding along a static one.
David Druley, Managing Director
Greg Meila, Investment Director
Footnotes