Most endowed institutions seek to provide continued (or growing) financial support for their operations while at the same time preserving the endowment’s value for the future. At its core, a spending policy is designed to balance the needs of both current and future generations, though getting the right balance can be a challenge. The precipitous decline of markets in 2008 and continued economic uncertainty have pushed institutions to reconsider how to properly maintain intergenerational equity. Our 2010 report, The Sober Future of Endowment Spending, explored the challenge of supporting a typical 5% spending rate given asset returns and urged institutions to develop spending contingency plans.
In 2012, we surveyed institutions on a variety of spending topics including spending rule types, target spending rates, floors, caps, collars, treatment of gifts, and recent policy changes under consideration. This report is a follow up to that study, incorporating spending policy practices in 2013, as well as information on endowment reliance and support of operations. We received survey responses from 190 institutions including 134 colleges and universities; 28 cultural and environmental institutions; 19 independent schools; and nine other nonprofit institution types (Exhibit 1). Foundations were excluded from the survey group as their spending policies are influenced by government regulations.
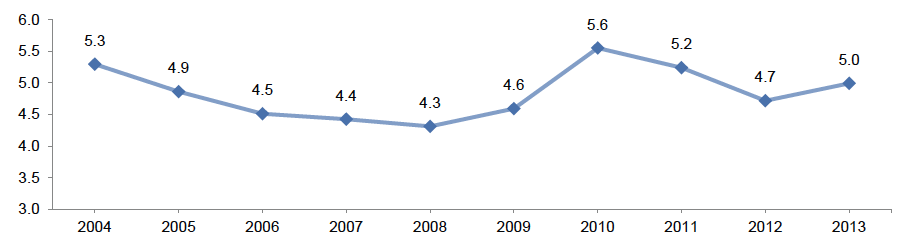
Mean Annual Effective Spending Rate
2004–13
Source: Spending policy data as reported to Cambridge Associates LLC.
Note: Data represent the average of 115 institutions that provided effective spending rates for each year from 2004 to 2013.

Exhibit 1: Profile of Participating Institutions
2013
Source: Spending policy data as reported to Cambridge Associates LLC.
Spending Policy Types
Exhibits 2–5 show summary responses to our questions on spending policy types. The three most common spending policies can be broadly characterized as market value–based policies, constant growth policies, and hybrid policies.
Market Value–Based Policies
The majority (72%) of responding institutions use a market value–based policy, which dictates spending a percentage of a moving average of endowment market values (Exhibit 2). The majority of institutions (87%) citing this rule type use a prespecified target rate while the remaining institutions allow some discretion by setting a prespecified percentage range within which the target spending rate may fall. For the purposes of analyzing target spending rates, the midpoint is used for institutions that specified a discretionary range. A target spending rate of 5% was used by 43% of institutions with a market value–based policy. A nearly equal proportion of institutions (40%) use a target rate below 5% while the remaining institutions use a rate above 5% (Exhibit 3).

Exhibit 2: Spending Policy Types
2013
Source: Spending policy data as reported to Cambridge Associates LLC.
Notes: Market value–based spending policies base spending on a prespecified percentage of a moving average of market values. Constant growth policies increase prior year’s spending by a prespecified percentage. Hybrid policies are those that incorporate a weighted average of a constant growth rule and a percentage of market value rule. “Other” policies are those that cannot be classified as market value–based, constant growth, or hybrid policies.

Exhibit 3: Characteristics of Market Value–Based Spending Policies
2013
Source: Spending policy data as reported to Cambridge Associates LLC.
Notes: Market value–based spending policies base spending on a prespecified percentage of a moving average of market values. Graph reflects data for the 134 institutions that provided detailed data on their target spending rate. If a range was provided, the target spending rate was calculated using the midpoint of the range.

Exhibit 3 (continued). Characteristics of Market Value–Based Spending Policies
2013
Source: Spending policy data as reported to Cambridge Associates LLC.
Notes: Market value–based spending policies base spending on a prespecified percentage of a moving average of market values. Unit of time measurement indicates whether spending is calculated using monthly, quarterly, or yearly market values. Graph reflects data for the 130 institutions using a market value–based spending policy that provided the unit of time measurement in their spending calculation.
Institutions employ a variety of smoothing periods to determine the average endowment market value used in the spending calculation. Smoothing periods range from one to seven years and the time interval (i.e., monthly, quarterly, or annual market values) can vary (Exhibit 3). The most common unit of time measurement is 12 quarters (45% of those with a market value–based policy).
Despite the smoothed average market value component, there is a risk that the policy calculation would dictate a spending cut during prolonged periods of endowment value declines. Cutting endowment spending can be difficult during market downturns, as they often coincide with an economic environment where other revenue sources of the institution are at risk of weakening. This may be particularly problematic for institutions with high fixed costs. A floor that prevents spending from falling below the prior year’s dollar amount would ease budgetary concerns during these periods, but at the cost of reducing the likelihood that purchasing power will be preserved over the long term. Using a cap along with a floor, however, can better balance the impact on future generations by limiting spending increases when endowment growth is particularly strong. Only nine of the 136 institutions that spend a prespecified target rate use a floor and/or a cap to further contain spending during volatile periods (Exhibit 3).
An additional 17 institutions are allowed to set a rate within a discretionary range of percentages and have more flexibility to maintain the level of spending in down markets and contain spending increases when endowment growth rates are high.
Constant Growth Policies
Constant growth spending policies increase the prior year’s spending amount by a measure of inflation and/or a prespecified percentage. Twenty-two respondents (12%) have a constant growth spending policy (Exhibit 2). Of these 22 institutions, 11 use a prespecified percentage growth rate; eight, an inflation-index growth rate; and three, an inflation-index growth rate plus a prespecified percentage (Exhibit 4).

Exhibit 4: Characteristics of Constant Growth Spending Policies
2013
Source: Spending policy data as reported to Cambridge Associates LLC.
Note: Constant growth policies increase prior year’s spending by a prespecified percentage.
The great advantage of a constant growth policy is the predictable spending stream from the endowment to the institution; however, constant growth policies have notable shortcomings. Increasing spending during prolonged periods of asset declines risks permanent impairment of the endowment. Conversely, some endowment constituencies might protest if they perceive the fund as grossly underspending in periods when it earns exceptional returns. In practice, institutions with constant growth spending policies mitigate these concerns and moderate spending by imposing a spending cap and floor based on a percentage of market value, or a moving average of market values (Exhibit 4).
Hybrid Policies
Hybrid spending policies are used by 25 responding institutions, or 13% (Exhibit 2). This policy type blends the predictable spending element of a constant growth policy with the asset preservation principle of a market value–based policy and allows an institution to set the appropriate mix that best meets its needs. Hybrid spending policies essentially have the effect of spending a prespecified percentage of an exponentially weighted average market value. The rule is expressed as a weighted average of a constant growth rule and a percentage-of-market-value (or average market value over a period of time) rule, with the greater weighting usually applied to the constant growth component. A plurality of respondents (48%) assign a 70% weighting to the constant growth portion and a 30% weighting to the market value–based portion. Inputs to the calculation of both the constant growth and market value–based components are shown in Exhibit 5.

Exhibit 5: Characteristics of Hybrid Spending Policies
2013
Source: Spending policy data as reported to Cambridge Associates LLC.
Notes: Hybrid policies essentially have the effect of spending a prespecified percentage of an exponentially weighted average market value (MV). The rule is expressed as a weighted average of a constant growth policy and a percentage of market value policy. Of the 25 institutions that use a hybrid spending policy, 19 do not use a collar, cap, or floor to contain year-to-year spending.

Exhibit 5 (continued): Characteristics of Hybrid Spending Policies
2013
Recent and Contemplated Spending Policy Changes
A total of 31 institutions are considering future changes to their spending policy. Most respondents indicated that changes would be made to spending rule mechanics (e.g., change the prespecified spending rate, institute a cap, etc.), with a smaller percentage (19%) considering changing their spending rule type (Exhibit 6).

Exhibit 6: Future Changes to Spending Policies
2014 and Beyond
Source: Spending policy data as reported to Cambridge Associates LLC.
For institutions that provided data, the most common changes being made or under consideration are changes to the target spending rates or discretionary target spending ranges of market value–based policies. Of the 11 institutions that have approved changes to their target rate or discretionary range, seven decreased the target spending rate, one is lowering the ceiling of its discretionary range, and one is transitioning from a discretionary range to a lower target spending rate. Two institutions did not indicate whether the changes under consideration would increase or decrease the rate. In all cases where lower target rates have been implemented or are under consideration, the new target rate would be at 5% or below.
Additional changes that have been made or are being considered include changes to market value smoothing periods, spending caps and floors, and other components of policy.
Effective Spending Rates and Support of Operations
Annual spending distributions are withdrawn from endowment assets to fund a variety of expenses including supplementing student financial aid, covering operating expenses, or funding capital projects. Spending distributions are also used to cover administrative costs, investment oversight costs, and to service outstanding debt. The effective spending rate in this study is calculated as the annual spending distribution as a percentage of the beginning market value of the long-term investment portfolio.
For the 115 institutions that provided effective spending rates over the trailing ten-year period, rates averaged 5.0% in 2013. As the graph below shows, the average effective spending rate was 27 bps above 2012, but below the rates reported in 2010 and 2011.
Support of Operations. The range of long-term investment portfolio support varies considerably among the institutions in this study. Public college and university institutions, which generally receive substantial financial support from state appropriations, generally rely less on endowment payout to fund the operating budget compared to private college and university institutions and other nonprofits. For the 30 public college and university institutions that provided data, support from the long-term investment portfolio as a percentage of operating expenses averaged 2.8% in 2013. Average support for private colleges and university institutions was 15.2% (Exhibit 7).

Exhibit 7: Long-Term Investment Portfolio (LTIP) Support of Operations
2013
Source: Spending policy data as reported to Cambridge Associates LLC.
Note: LTIP support of operations is the proportion of the operating budget that is funded from LTIP payout. For the four other nonprofit institutions that provided data, the LTIP support of operations averaged 17.1%.
Among cultural and environmental institutions and independent schools, reliance on the long-term investment portfolio is higher, as support of the operating budget averaged 33.5% and 26.3%, respectively. Although some institutions’ reliance on long-term investment portfolio support is low, for others, it is the single largest source of revenue.
Participating Institutions
Colleges and Universities
Allegheny College
American University
Amherst College
Baylor University
Bentley University
Berkeley Endowment Management Company
Boston College
Bowdoin College
Brandeis University
Brown University
Bryant University
Bryn Mawr College
University of California
California Institute of Technology
Carleton College
Carnegie Mellon University
Case Western Reserve University
Chapman University
The University of Chicago
The City University of New York
Claremont McKenna College
Clemson University Foundation
Colby College
Colgate University
Columbia University
Connecticut College
Cornell University
Dartmouth College
Davidson College
University of Delaware
Duke University
Emory & Henry College
Emory University
Florida State University Foundation Inc.
University of Florida Investment Corporation
Georgetown University
The George Washington University
Georgia Tech Foundation Inc.
Gettysburg College
Goucher College
Grand Valley State University
Hampton University
Harvard Management Company, Inc.
Harvey Mudd College
Haverford College
University of Hawaii Foundation
College of the Holy Cross
Hope College
Houston Baptist University
University of Illinois Foundation
Indiana University Foundation
Johns Hopkins University
Kalamazoo College
Kansas State University Foundation
KU Endowment
Lafayette College
Lebanese American University
Lehigh University
Lewis and Clark College
University of Louisville
Lycoming College
Macalester College
University of Maine Foundation
Maryland Institute College of Art
University of Miami
University of Michigan
Michigan State University
MIT Investment Management Company
Mount Holyoke College
Nevada System of Higher Education
New York University
Northeastern University
Northwestern University
Norwich University
University of Notre Dame
Oberlin College
Occidental College
Ohio State University
University of Oklahoma Foundation
Oklahoma State University Foundation
University of Oregon Foundation
Oregon Health and Science University Foundation
University of Pennsylvania
Pennsylvania State University
Pepperdine University
University of Pittsburgh
Princeton University
The Principia Corporation
Providence College
Purdue University
Randolph-Macon College
Rensselaer Polytechnic Institute
University of Rhode Island Foundation
Rice University
University of Rochester
The Rockefeller University
Roger Williams University
College of Saint Benedict
University of San Diego
Santa Clara University
Scripps College
Siena College
Simmons College
University of Southern California
Spelman College
Stanford University
University of St. Thomas
Swarthmore College
Temple University
University of Tennessee
Texas A&M Foundation
The University of Texas Investment Management Company
University of Toronto Asset Management Corporation
Trinity University
The UCLA Foundation
UNCG Endowment Partners, LP
UNC Management Company, Inc.
Vanderbilt University
The University of Vermont
Villanova University
University of Virginia
Virginia Tech Foundation
University of Washington
Washington College
Washington and Jefferson College
Washington University in St. Louis
Wellesley College
Wesleyan University
Western New England University
Wheelock College
College of William & Mary Foundation
Williams College
Yale University
Yeshiva University
Cultural and Environmental
Atlanta Historical Society
The Vivian Beaumont Theater, Inc.
Boston Symphony Orchestra Inc.
The Brookings Institution
California Academy of Sciences
Chemical Heritage Foundation
Cypress Lawn Endowment Care Trust
The Edison Institute
Isabella Stewart Gardner Museum
Hagley Museum and Library
Linda Hall Library Trusts
Honolulu Museum of Art
Indianapolis Museum of Art Inc.
Kennedy Center for the Performing Arts
Longwood Gardens, Inc.
Minnesota Orchestral Association
Museum of Fine Arts, Boston
Museum of Fine Arts, Houston
National Geographic Society
The New York Public Library
Philadelphia Museum of Art
Santa Fe Opera Foundation
Scenic Hudson Land Trust Inc.
The School of American Ballet
Seattle Art Museum
George Washington’s Mount Vernon
White House Historical Association – Endowment Trust
The Henry Francis duPont Winterthur Museum, Inc.
Independent Schools
Auditory Learning Foundation
Brunswick School
Buckingham Browne & Nichols School
Hockaday School
The Hotchkiss School
Kamehameha Schools
Lakeside School
The Lawrenceville School
The Loomis Institute
The Madeira School
Park Tudor Trust
Phillips Exeter Academy
Pingry School
The Roxbury Latin School
Salisbury School
Shady Hill School
The Webb Schools
Western Reserve Academy
The Winsor School
Other Nonprofits
American College of Surgeons
American Red Cross
Armenian Church Endowment Fund
Catholic Church Extension Society
The First Church of Christ Scientist
Billy Graham Evangelistic Association
Mission Diocese Fund
Old South Church
Xaverian Brothers USA
Contributors
Jeremy Parsels, Manager
Grant Steele, Director