What a glorious time to be a US equity investor! Markets have charged ahead nearly uninterrupted for several years—the S&P 500 and Nasdaq are hitting new highs; the momentum looks like it will go on forever; and who needs active managers that can’t keep up with passive indexes, where everyone is piling in? It will be exciting to see what the new millennium brings as we sit here in 1999! Oh, you thought we were discussing 2015? In fact, the parallels between the conversations today on the futility of active management in US equities and those in the great bull market of the late 1990s are striking.
It’s hard to argue with the benefits of index investing when a rising market tide is lifting all boats, and the clear movement over time toward index investing makes sense for many investors. We are not unconditional advocates for or against active management; investors have different circumstances. However, while there are many logical rationales for favoring index over active investing, the recent performance struggle of the average active manager is not among them. The investment industry and the press love to make absolute claims in the active versus passive debate, and the volume of rhetoric from either side seems to grow loudest near cyclical peaks and troughs. The result is yet another behavioral force tempting investors to abandon their long-term plan to chase what has worked recently. Our aim is to provide a longer-term perspective to remind investors that neither side of this debate succeeds or fails in a straight line. The lesson that everything has its time and place is important to periodically (re)learn.
A Look at the Data on Active US Large-Cap Manager Trends
“US Mid- to Large-Cap Equity Manager Performance,” Cambridge Associates Chart Book, 2015.
Earlier this year we published our annual analysis of active US equity managers, which showed the median manager in our US equity ex small cap universe has underperformed for four of the last five years and five out of the last ten. To some the takeaway is clear: the odds are 50:50 and active managers aren’t worth it. However, keen observers will notice that while passive won in four of the last five years, active won in four of the prior five. A longer-term look at market history indicates that this kind of trend regularly (and cyclically) occurs. When viewed from the perspective of rolling period returns, periods of tailwinds and periods of headwinds are both apparent. These cyclical trends in performance are not just a symptom of movement in cyclical favoritism between investing styles. Both growth and value managers see headwinds and tailwinds.
Many cite bear markets as periods that favor active approaches. Our analysis suggests this is a fair statement, and the US equity market hasn’t had one of those in a while. How managers do in a bear market depends on the type that occurs. Narrow-based corrections, such as the 2000–02 bear market that was driven primarily by the technology and telecommunications sectors, provide more room for active managers to position against the retreating tide, whereas broad-based downturns, such as the 2008 downturn, provide few areas for safety.
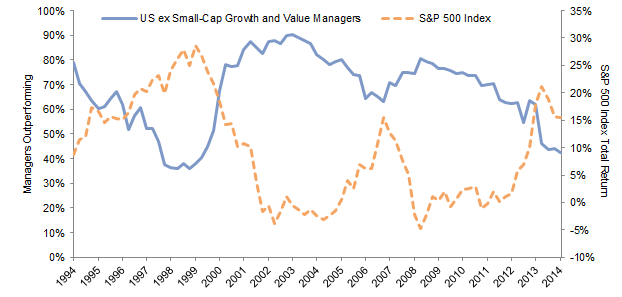
US Equity ex Small-Cap Growth and Value Manager Outperformance Compared to S&P 500
Performance—Rolling Five-Year Returns
First Quarter 1990 – Fourth Quarter 2014
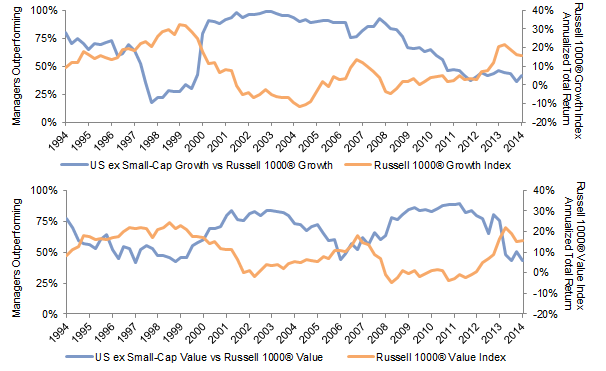
US Equity ex Small-Cap Growth and Value Manager Outperformance Compared to Benchmark Performance—Rolling Five-Year Returns
First Quarter 1990 – Fourth Quarter 2014
Investor sentiment and flows tend to follow performance. Some of the current favor toward index investing is likely driven by active managers’ aggregate recent underperformance. Based on data from the Investment Company Institute, index equity mutual funds’ share of total equity mutual funds’ net assets was 20.2% at the end of 2014, nearly double the 11.6% market share from a decade ago. At the same time, active US equity managers have seen fairly persistent negative asset flows since 2005, though it’s challenging to determine where this outflow is moving. Is it swapping for passive or going into strategies outside the United States, fixed income, or other asset classes? Regardless, the data suggest interest in US index strategies[1]Of note, the most significant growth on the index investing side has come in ETFs, though it is challenging to parse how much of this asset flow is long-term investing versus short-term trading. ETFs … Continue reading is growing at the expense of active strategies, and investor sentiment can be an interesting contrarian indicator, as shown in the following chart, which uses net flows to passive mutual funds and exchange traded funds (ETFs) as a proxy for investor enthusiasm for index strategies (or market beta). Flows to index strategies swell as a bull market gains steam, and active managers tend to outperform during market corrections.
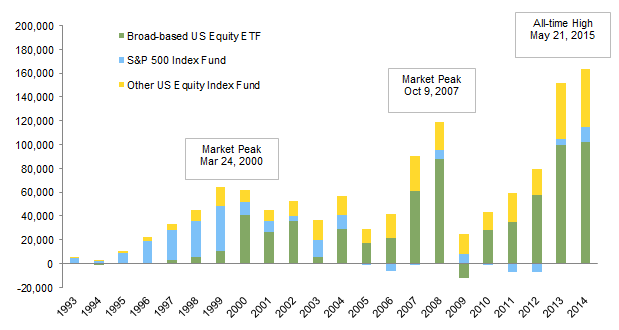
Total Net New Cash Flow Index Mutual Funds and Net Issuance ETFs
1993–2014 • US Dollar (millions)
Structural Biases Can Be Catalysts for Cyclical Shifts in the Debate
Both active and index portfolios come with embedded structural biases that can help explain past results and also frame future expectations. On the active manager side, US large-cap managers have historically exhibited a persistent smaller-cap bias and some tendency to hold stocks outside their index (for example, allocations to non-US stocks). In addition, managers’ cash positions will impact performance relative to cashless indexes. Of note, while these biases are persistent at the average or aggregate level, they are under the control of individual managers, so their degree of impact on any given manager will vary.[2]A manager can choose to accentuate or minimize biases. As such, investors should be hesitant to give managers too much credit for skill when the wind is at their back and too much penalty for a lack … Continue reading Perhaps bear markets favor active managers as a result of active managers’ opportunity to overcome the structural biases inherent in market-cap-weighted indexes—namely, their embedded momentum skew, which can be exacerbated by investor flows. This skew comes about as stronger-performing stocks, industries, and/or sectors necessarily become a larger proportion of an index over time. As their respective prices move up, their marginal weight increases, as does their influence on the overall index’s performance. As Grant’s Interest Rate Observer recently quipped, “long bull markets tilt the investment debate in favor of the autopilot approach.”[3]“Read the Footnotes,” Grant’s Interest Rate Observer, November 14, 2014.
Momentum can lead to bubbles and ultimately to opportunities for active managers to exploit. The outsized influence of technology stocks in the late 1990s is one of the most obvious examples. An investor that purchased the Russell 1000® in 1999 inherited an outsized technology exposure that imparted a large absolute return hit to the portfolio when the bubble finally burst. Active managers that strayed from technology were punished severely for a few years but later rewarded handsomely. Another example is the experience of investors in the financial sector since the October 2007 peak. From that peak to the March 9, 2009, bottom, financials declined 82%. Since that time financials have generated a staggering return of 330% through March 31, 2015, yet have remained underwater by 21% for the full period. Index investors experienced every bit of those two intra-index corrections, while many active managers rapidly gained back their longer-term performance advantage simply by protecting from the structural bias that can cause index bubbles.
Today the pressure on active managers is high. But however dire it may seem, the fundamental principles of economics dictate that the fuel for any market imbalance eventually runs out, and what seems to be a free lunch for index investors—at the expense of stubborn active management believers—subsides for a time. This has played out many times in market history, including the late 1990s, when the burst of the technology stock bubble turned the tide, and 2007, when the severe 2008 correction briefly reversed the trend. Similar examples can be found in the 1980s, 1970s, and beyond.[4]As a longer-dated example, Fred Schwed Jr. bemoans the challenges of active management in Where Are the Customer’s Yachts?, published in 1940.
Could It Be Different This Time?
Correlations (the degree to which stocks move in the same direction) for US stocks have been above normal, and dispersion (the degree to which stocks move by different magnitudes) below normal in recent years. Could this trend be permanent given the increase in market share of investment products that systematically buy groups of stocks in fixed quantities? A recent Goldman Sachs report[5]Robert Boroujerdi and Katherine Fogertey, “ETFs: The Rise of the Machines,” Goldman Sachs Equity Research, April 10, 2015. noted that US equity ETFs now represent a quarter of trading volume. While this is a significant number, the evidence to date seems to indicate that ETF activity is potentially more impactful in niche sectors or during periods of market stress.[6]Most ETF trading occurs in the secondary market and does not affect the underlying stock market. The potential for price influence occurs when unmatched trades force the creation/redemption of ETF … Continue reading For example, the Goldman Sachs report noted that among the 35 stocks in the S&P 500 where ETF-creation activity could represent greater than 10% of total trading volume, 33 were in the real estate and energy sectors—the two largest sector ETF categories. ETFs’ influence in real estate and energy is not nearly enough to account for changes in the broad stock market’s dynamics.
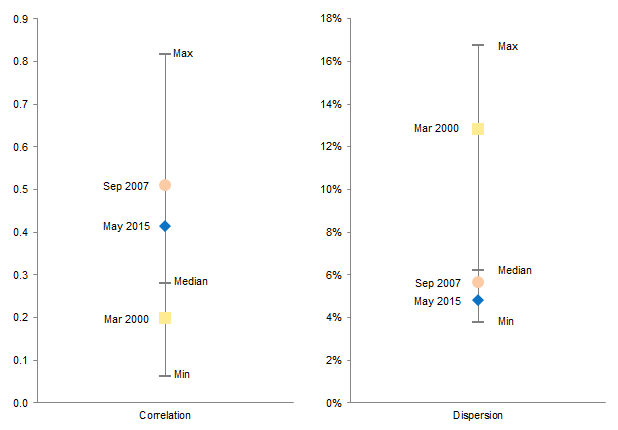
S&P 500 Index Monthly Correlation and Dispersion
January 31, 1990 – May 31, 2015
If ETF and index-investing activity cannot fully explain the rise in co-movement of stocks in recent years, what might? Other possible culprits for stronger correlation include increased macroeconomic uncertainty, struggling global growth, valuation concerns, and unprecedented central bank activity. Broadly speaking, while the current level of correlation among stocks is higher than typically observed in recent decades, it is not above all-time highs. Those were set in the 1920s and 1930s, a similar period of global uncertainty and well before the advent of index strategies. Though active managers may need to be more attuned to the influence of index investing in certain sectors and at certain times, they have always needed to remain mindful of non-fundamental and market dynamic factors, particularly during times of stress. ETF and indexing influences are perhaps just one more line item to add to the list. It’s not clear that the game has changed; active managers just have a smaller piece of the pie.
The Bottom Line
The merits of index investing are clear and well aligned with some investors’ needs. Others have objectives that are better suited to active management or some combination of both approaches. We recognize the long-term, zero-sum-game nature of active management and are not apologists for the current performance of the average active manager. Each side of this debate has its time and place, and we have seen the same trends play out over multiple decades. In fact, a 1986 Cambridge Associates report titled “Investment Indexing Revisited” touched on this very subject.
If you’ve determined the appropriate long-term mix of active and passive allocations, then this reminder of the cyclical nature of this ongoing debate may help you avoid the sirens’ call to reassess your position based on the near-term state of the affairs in your rearview mirror. For those investors more attuned to absolute risks and nervous about valuations within the US market, record flows into index strategies and current popular sentiment against the practice of active management perhaps suggest that the market (and the trade to passive) is getting crowded. This may serve as a contrarian signal that now is not an ideal time to sign up for all the exposure that the market basket currently has to offer.
Kevin Ely, Managing Director
Michael Kellett, Investment Associate
TJ Scavone, Investment Associate
Exhibit Notes
US Equity ex Small-Cap Growth and Value Manager Outperformance Compared to S&P 500 Performance—Rolling Five-Year Returns
Sources: Cambridge Associates LLC and Standard & Poor’s.
Notes: CA’s manager universe statistics are derived from CA’s proprietary Investment Manager Database. Performance is generally reported gross of investment management fees. Managers that do not report in U.S. dollars, exclude cash reserves from reported total returns, and have less than $50 million in product assets (for 1998 to the present) are excluded. Returns for inactive (discontinued) managers are included if performance is available for the entire period measured. Excess return for US Equity ex Small-Cap Growth and Value managers is measured versus the S&P 500 Index.
US Equity ex Small-Cap Growth and Value Manager Outperformance Compared to Benchmark Performance—Rolling Five-Year Returns
Sources: Cambridge Associates LLC and Frank Russell Company.
Notes: CA’s manager universe statistics are derived from CA’s proprietary Investment Manager Database. Performance is generally reported gross of investment management fees. Managers that do not report in U.S. dollars, exclude cash reserves from reported total returns, and have less than $50 million in product assets (for 1998 to the present) are excluded. Returns for inactive (discontinued) managers are included if performance is available for the entire period measured. Excess return for US Equity ex Small-Cap Growth and Value managers is measured versus the Russell 1000® Growth Index and Russell 1000® Value Index, respectively.
Total Net New Cash Flow Index Mutual Funds and Net Issuance ETFs
Source: Investment Company Institute.
Note: As of December 31, 2014, broad-based domestic equity ETFs could be segmented as approximately 60% large cap, 11% mid cap, 10% small cap, and 20% other.
S&P 500 Index Monthly Correlation and Dispersion
Source: Standard & Poors.
Notes: Correlation is calculated as the weighted average pair-wise correlation across the stocks in the index over one month. Dispersion is calculated as the weighted cross-sectional standard deviation of the performance of stocks within the index during one month.
Footnotes