In this edition of Real Asset Dynamics, we analyze the returns of Cambridge Associates’ indexes of private real estate funds over various time horizons and offer our views on what investors can expect in private real estate going forward.
Global private equity real estate continues to generate decent returns, earning 1.5% in second quarter 2016 and 3.6% year to date, as indicated by the returns for the Cambridge Associates LLC Real Estate Index. Second quarter 2016 marked the 19th consecutive quarter of positive returns for the benchmark, dating back to the summer of 2011.
Global private equity real estate has posted respectable returns in the aftermath of the global financial crisis, as reflected in a trailing five-year return of 10.7% (through June 30, 2016). In fact, private real estate outperformed the returns generated by the CA Global Private Equity and Distressed Securities indexes, but trailed the CA Venture Capital Index over the same time period (Figure 1). Real estate meaningfully underperformed these asset classes in years immediately preceding this five-year period, and the subsequent rebound in valuations was more pronounced.
Value-Added Real Estate Funds Outperform Opportunistic Real Estate Funds. The Cambridge Associates LLC Real Estate Index, which included 884 funds as of second quarter 2016, encompasses a mix of value-added and opportunistic real estate funds. In general, value-added real estate funds take on less risk than opportunistic funds but more risk than core strategies. Value-added funds typically lever their acquisitions with a debt component equal to 50%–60% on a loan-to-value (LTV) basis; focus on the major property types such as apartments, offices, and industrial buildings; and target properties with some in-place cash flow but requiring a value-added business plan to enhance that cash flow. Conversely, opportunistic real estate funds will often use debt at a level greater than a 60% LTV; will invest in a wider range of assets, including hotels, condominium development, and land; and are normally willing to take on greater risk at the property level, including leasing risk and ground-up development. Opportunistic funds also tend to invest in distressed assets and those with more complicated, sometimes impaired, capital structures. Given the greater risks taken by opportunistic fund managers, investors tend to expect opportunistic funds will outperform value-added funds.
As detailed in Figure 1, value-added funds have somewhat surprisingly outperformed opportunistic funds over the trailing one-, three-, and five-year periods, while opportunistic funds have slightly outperformed over the longer time horizons. Why have the lower-risk value-added funds outperformed in recent years? One explanation could be that the difference in use of leverage between the two strategies has narrowed following the financial crisis, such that the opportunistic managers have not disproportionately benefitted from cheap debt. Opportunistic funds were not able to secure higher LTV debt in the initial post–financial crisis years, given the more restrictive lending environment.
But even if the use of leverage across value-added and opportunistic funds is no longer as significant a point of differentiation between the two categories, opportunistic funds should still outperform, given the greater level of risk they take at the property level. Another explanation we considered is the greater exposure in the opportunistic benchmark to non-US funds, or more specifically exposure to currencies not linked to the US dollar, in the indexes. Given US dollar strength since 2011, this could help explain the difference in performance over the five-year horizon as any fund with unhedged non-USD exposure would have been hit. And this exposure may explain some of the return difference—the exposure to non-USD currencies in the value-added and opportunistic benchmarks is about 12% and 15%, respectively. Given the performance differential over the five-year horizon is 60 basis points (bps), and the US dollar strengthened about 30% on a trade-weighted basis over this period, the value-added index’s lower exposure to non-USD funds could have helped it outperform.
Another reason for the outperformance of value-add funds is likely investors’ appetite for cash-flowing assets in a low return environment, which we discuss next in examining the performance of these private funds versus public real estate and lower-risk core real estate assets.
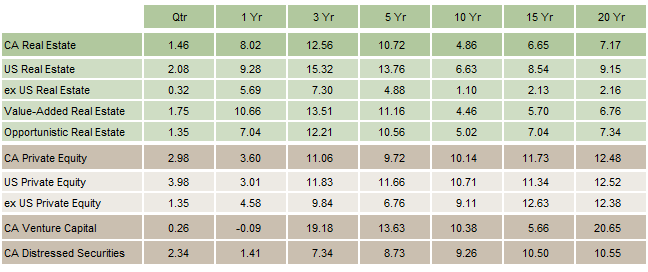
Figure 1. Pooled Horizon IRRs for Select Private Investment Benchmarks
Periods Ended June 30, 2016 • USD Terms • Percent (%) • Net to Limited Partners
Source: Cambridge Associates LLC.
Notes: Private indexes are pooled horizon internal rate of return (IRR) calculations, net of fees, expenses, and carried interest. The timing and magnitude of fund cash flows are integral to the IRR performance calculation. The CA Real Estate benchmark horizon calculation is based on data compiled from 884 real estate funds (including opportunistic and value-added real estate funds), including fully liquidated partnerships, formed between 1986 and 2015. In terms of total limited partners’ fund commitment, the CA Real Estate benchmark is 73% opportunistic and 27% value-added. In terms of limited partners’ total paid-in capital, the CA Real Estate benchmark is 72% opportunistic and 28% value-added.
Relative Returns Less Compelling. While value-added and opportunistic real estate funds have generated solid returns and healthy levels of distributions since the financial crisis, these returns continue to lag lower-risk public and private indexes on a relative basis. The Cambridge Associates LLC Real Estate Index has lagged the NCREIF Property Index, an unlevered index of lower-risk core real estate assets, over all time periods in Figure 2 with the exception of the trailing three years. In addition, both indexes have underperformed across all times periods relative to public real estate stocks, as measured by the FTSE® NAREIT All Equity Index. While these results seem to suggest investors should de-emphasize value-added and opportunistic funds in favor of more liquid, lower-risk options, we do not necessarily take that stance. Both the NCREIF and FTSE® NAREIT Indexes emphasize fully occupied, core assets located in the largest, most liquid gateway cities in the United States, which have benefitted the most from investors’ unquenchable demand for current yield. Value-added and opportunistic funds usually acquire properties with more modest yield attributes (and in some cases, no current yield) and have not benefitted nearly as much from buyers’ current penchant for higher yielding assets. Going forward, in a rising interest rate environment, we would expect core assets to underperform value-added and opportunistic strategies. The higher expected income growth within value-added and opportunistic funds should offset some of the likely diminution in valuations caused by rising interest rates and expanding cap rates.
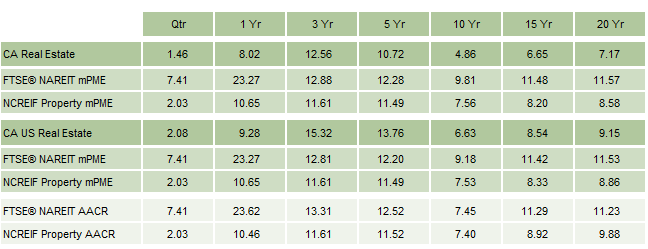
Figure 2. Comparing Public and Private Real Estate Index Returns
Periods Ended June 30, 2016 • USD Terms • Percent (%) • Net to Limited Partners
Sources: Cambridge Associates LLC, FTSE International Limited, National Association of Real Estate Investment Trusts, National Council of Real Estate Investment Fiduciaries, and Thomson Reuters Datastream.
Notes: Private indexes are pooled horizon internal rates of return, net of fees, expenses, and carried interest. NCREIF Property is an unlevered index of lower-risk core real estate assets. Returns for the FTSE® NAREIT All Equity REITs Index and NCREIF Property Index are shown as both time-weighted returns (average annual compound returns) and dollar-weighted returns (mPME). The CA Modified Public Market Equivalent (mPME) replicates private investment performance under public market conditions. The public index’s shares are purchased and sold according to the private fund cash flow schedule, with distributions calculated in the same proportion as the private fund, and mPME net asset value is a function of mPME cash flows and public index returns. Average annual compounded return (AACR) calculations, which are time weighted measures over the specified time horizon, are shown for reference and directional purposes only. Due to the fundamental differences between the two calculations, direct comparison of IRRs to AACRs is not recommended.
Non-US Funds Lag. The underperformance of European and Asian real estate funds has also contributed to the poor relative returns of the Cambridge Associates LLC Real Estate Index versus NCREIF and FTSE® NAREIT. Both of the latter are 100% US-focused, whereas the Cambridge Associates LLC Real Estate Index is approximately one-third non-US on a market cap basis. A comparison of US-only value-added and opportunistic funds with the NCREIF and FTSE® NAREIT Indexes (Figure 2) indeed shows modest outperformance over the trailing three- and five-year periods as expected, given the CA benchmark’s higher risk profile.
Non-US funds have underperformed US-focused funds by over 800 bps over the trailing three- and five-year periods and by over 500 bps over the trailing ten-year period. Reviewing the performance of the underlying non-US funds in the benchmark, a handful of European real estate funds lost more than 60% of their capital during this period, but this was also the case among US funds. Rather, the weakening of various currencies relative to the US dollar likely explains more of this underperformance. For example, over the trailing five-year period, the euro and pound have weakened relative to the US dollar by approximately 30% and 20%, respectively. To the extent these currencies were held flat over this time period, a back-of-the-envelope calculation indicates that the non-US funds would have still underperformed, but closed the gap by about 200 bps. Asia-focused funds did not have the same impact, as the absolute number of funds active in Asia in the benchmark is smaller, and many of the funds are either USD-denominated or active in countries that link their currencies to the US dollar.
Lower Returns Going Forward? The 1.5% return generated in the second quarter represents the lowest quarterly return for the benchmark since second quarter 2012, while the trailing one-year return of 8.0% is the lowest in four years and about 550 bps lower than the trailing one-year returns achieved over the past three years. This deceleration in real estate returns is not surprising, and investors should probably expect lower returns going forward. The current up-cycle for global real estate is now seven years old; far fewer opportunities exist to purchase distressed assets at favorable prices, particularly in the United States. Europe is a different story and will likely yield continued distressed opportunities for a few more years.
Real estate fundamentals remain strong, as evidenced by continued net operating income (NOI) growth above longer-term averages. However, NOI growth is also beginning to decelerate across most property types. Finally, cap rate compression (analogous to an expansion in price-earnings multiples for equities and EBITDA multiples in the private equity space), which has been a significant component of real estate returns since the market bottomed in 2009, is unlikely to continue. Cap rates for the major property types are at historic lows, and are susceptible to additional moves by the Federal Reserve and other central banks to raise interest rates.
While investors should expect lower returns from real estate going forward, that doesn’t necessarily mean they should expect a repeat of their experience in 2008–09. As discussed, a major difference in the current cycle compared to the years leading up to the global financial crisis is a much more restrained use of debt. Anecdotal evidence suggests many real estate managers in the benchmark are currently financing acquisitions with debt averaging around 60% LTV, whereas opportunistic real estate funds commonly used 75% LTV debt prior to the financial crisis. Lower LTVs should allow the real estate asset class to weather the next inevitable downturn better than it did the global financial crisis.
Greater restraint in the behavior of developers is also a differentiating characteristic of the current environment. Real estate cycles typically end once overly enthusiastic developers create too much new supply, causing vacancy rates to rise, and property-level income to decline. The current environment, aided by a more restrictive lending environment, has seen less new supply than previous cycles and positions the asset class to weather a future correction in demand better than past cycles.
Marc Cardillo, Managing Director
Meagan Nichols, Managing Director