Agribusiness private equity can be easy to overlook, but institutional investors would be remiss to disregard the sector. In this edition of Real Asset Dynamics, we examine the sector’s defining characteristics, recent industry trends, and their implications.
Investors are cautious about agriculture investments. Farmland managers, which dominate the global private equity agriculture landscape, tend to have high commodity price exposure and low expected return targets, neither of which is attractive. Yet few investors focus on the remaining agricultural supply chain between farm and consumer, broadly known as agribusiness. The global agribusiness industry is extensive and includes companies focused on the processing, transportation, packaging, and distribution of agricultural products, as well as those that manufacture farming equipment, fertilizers, genetics, seed technology, and logistics and software solutions. Relative to farmland, agribusiness investments have lower commodity price exposure, higher expected return targets, and are more diverse.
The agribusiness industry benefits from global population growth, increasing emerging markets consumer wealth, and a corresponding change in consumer diets. Because the industry is fragmented, primarily comprising a few large companies atop a huge arena of smaller family-owned businesses, it has many opportunities for consolidation. These factors, coupled with the fact that the industry receives little investor attention, create a compelling investment opportunity in select private equity agribusiness managers.
Strong Macroeconomic Tailwinds
How we grow, distribute, and market food globally is changing, and meeting those changes means improvements in agricultural output, transportation, storage, processes, and logistics. According to the United Nations, the world’s population is expected to grow nearly 30% from 7.6 billion today to 9.7 billion by 2050, with most of the growth taking place in the developing world. At the same time, global wealth is expanding. According to a 2018 World Bank report,[1]Kevin Carey et al., “The Changing Wealth of Nations 2018: Building a Sustainable Future,” World Bank, 2018. global wealth increased 66% from 1995 to 2014, marked by a sharp rise in the share held by non-OECD middle-income countries. This change largely reflects the extraordinary buildup of Asia, which has moved from mostly low-income to middle-income status in just one generation. These trends are likely to persist, providing a strong foundation for agribusiness companies to expand.
Attractive and Differentiated Returns
The macroeconomic dynamics mentioned above have translated into strong performance for agribusiness equities relative to broader global equities, bonds, and commodity futures. Using a public index as a proxy for private sector returns, agribusiness equities have outperformed broader global equities, bonds, and commodities since 2001 (Figure 1). The industry’s outperformance occurred despite agriculture commodity prices essentially remaining unchanged across the same time period.
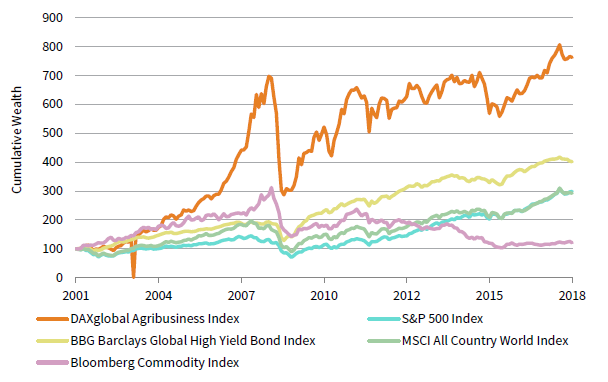
FIGURE 1 PERFORMANCE OF AGRIBUSINESS EQUITIES VS BROADER MARKET
December 31, 2001 – June 30, 2018 • December 31, 2001 = 100 • US Dollar (billion)
Sources: Bloomberg Index Services Limited, Bloomberg L.P., Deutsche Bank, MSCI Inc., and Standard & Poor’s. MSCI data provided “as is” without any express or implied warranties.
Note: The DAXglobal Agribusiness Index launched in December 2001.
Ripe for Consolidation
Today, the industry is characterized by a swath of small and typically family-run businesses and a few large companies that are referred to as “majors.” These majors have recently gone through a wave of consolidations as the industry has matured, partially in an attempt to streamline their supply chains and logistics. Over the last three years, the “big six” ag-chem companies, which control roughly 60% of the market in aggregate, have merged into the “big three” (Bayer & Monsanto, ChemChina & Syngnta, and Dow & DuPont).
This new backdrop provides a fertile environment for specialist private equity funds to purchase small operations and develop or acquire add-on companies to grow the platform. Although the three majors are the natural buyers of growing companies, generalist private equity funds are beginning to acquire these companies as well. Furthermore, the current market environment has created opportunities for mid-size companies to outsource non-core functions to dedicated service providers. Like many sectors today, the agribusiness industry is adapting to a new environment and is beginning to consolidate as a response to fundamental changes in its customer base.
The numbers reflect this dynamic. As seen in Figure 2, M&A activity has exploded in recent years. Moreover, 2018 is shaping up to be the strongest year for M&A in the industry’s history, with 78 transactions through mid-September, representing $66.8 billion of invested capital. Deals completed over the past several years show a disproportionate amount of the value-add deriving from multiple expansions, as buyers are willing to pay a meaningful premium for well-run companies. The potential for further consolidation and professionalization in the sector provides an opportunity for small, nimble companies to perform well, especially with the support of talented private equity firms.
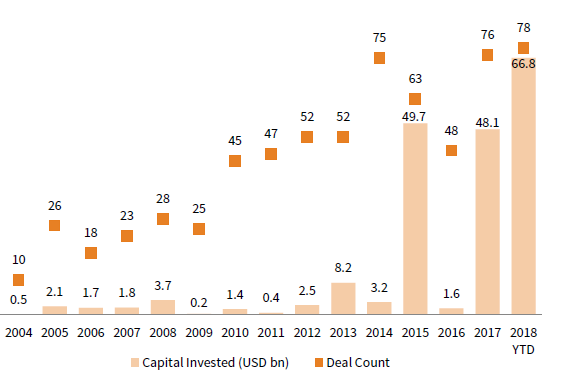
FIGURE 2 AGRICULTURE TRANSACTION ACTIVITY
2004–2018
Source: PitchBook Data, Inc.
Note: Data for 2018 are through September 25, 2018.
Small and Emerging Manager Universe, but Institutional-Quality Managers Exist
Until recently, investors had few options to gain exposure to agribusiness. The fragmented market means that the industry is not well covered by investment banks, which makes it difficult for generalist private equity firms to participate in the sector. Despite comprising slightly over 8% of total global GDP, food and agribusiness made up only 1% to 2% of investment activity in aggregate (Figure 3). Furthermore, agriculture transactions were a small portion of private equity transactions relative to other sectors such as business products & services and IT (Figure 4).
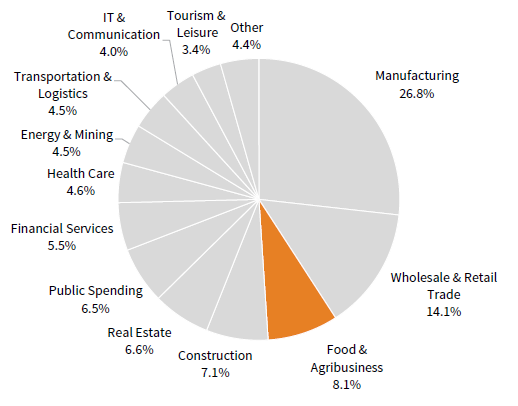
FIGURE 3 TOTAL GLOBAL OUPUT
2017
Source: Preqin.

FIGURE 4 2017 PRIVATE EQUITY TRANSACTION ACTIVITY BY SECTOR
As of December 31, 2017 • Capital Invested (USD billion)
Source: PitchBook Data, Inc.
Several new dedicated agribusiness managers have cropped up to address the opportunity and financing gap. Even though the lack of established managers means performance history is limited, recent deals have outperformed public indexes, suggesting that private equity–like returns are possible. Given the fragmented nature of the space, successful managers tend to have close industry relationships and benefit from proprietary, on the ground deal flow. They also understand sector trends and have the capability to make meaningful operational improvements. A few institutional managers in the sector do exist, and with a high quality manager, investors should expect strong returns that are differentiated from the broader market.
In summary, investors should not overlook the sector. Agribusiness companies benefit from strong macroeconomic tailwinds and the industry is ripe for consolidation. Attractive investment opportunities in the sector exist today, and investors should consider selectively committing capital to an institutional-quality manager.
Mike Brand, Senior Investment Director
Ammar James, Associate Investment Director
Mandy Rohrer, Senior Investment Associate
Index Disclosures
Bloomberg Barclays Global High Yield Bond Index
The Bloomberg Barclays Global High Yield Bond Index is a combination of the US High Yield Index, the Pan-European High Yield Index, the CMBS High Yield Index, and the non-investment-grade constituents of the Global Emerging Markets Index and the Pan-European Emerging Markets Index. The index covers both developed and emerging markets. As a rules-based index, countries are added and removed based on their fulfillment of index requirements. Thus, the Global High Yield Index does not cover a fixed set of countries.
Bloomberg Commodity Index
The Bloomberg Commodity Index is calculated on an excess return basis and reflects commodity futures price movements. The index rebalances annually weighted two-thirds by trading volume and one-third by world production and weight caps are applied at the commodity, sector and group level for diversification.
DAXglobal Agribusiness Index
The DAXglobal Agribusiness Index tracks the performance of equity securities of selected companies engaged in the agriculture business that are traded on leading global exchanges. It is calculated using a modified market capitalization weighting methodology. The index is weighted based on the market capitalization of each of the component securities, modified to conform to various asset diversification requirements, which are applied in conjunction with the scheduled quarterly adjustments to the index.
MSCI All Country World Index
The MSCI ACWI Index is a free float–adjusted market capitalization–weighted index designed to measure the equity market performance of developed and emerging markets. The MSCI ACWI consists of 46 country indexes comprising 23 developed and 23 emerging markets country indexes. The developed markets country indexes included are: Australia, Austria, Belgium, Canada, Denmark, Finland, France, Germany, Hong Kong, Ireland, Israel, Italy, Japan, Netherlands, New Zealand, Norway, Portugal, Singapore, Spain, Sweden, Switzerland, the United Kingdom, and the United States. The emerging markets country indexes included are: Brazil, Chile, China, Colombia, Czech Republic, Egypt, Greece, Hungary, India, Indonesia, Korea, Malaysia, Mexico, Peru, Philippines, Poland, Qatar, Russia, South Africa, Taiwan, Thailand, Turkey, and United Arab Emirates.
S&P 500 Index
The most widely used index of the US stock market, the S&P 500 represents about two-thirds of the aggregate market value of all US common stocks. In selecting stocks for inclusion in the index, Standard & Poor’s aims to replicate the industry weightings of the market; therefore, it is not the 500 largest stocks.
Footnotes