This inaugural private investment (PI) fund terms publication highlights terms such as management fee, transaction fee offset, distribution waterfall, and GP clawback based on activity from 2018–22, with a special focus on 2022. As a part of the underwriting process, Cambridge Associates (CA) collects and monitors data on certain key PI terms found in the limited partnership (LP) agreement of a fund’s formation documents. The proprietary data found in this publication will help to keep clients well-informed about marketplace commonalities regarding these terms.[1]The graphs and tables are intended to be illustrative guides for what is industry standard. The methodology section includes details such as asset classes and the makeup of our sample.
Key Takeaways
There are a few key takeaways from the terms data collected. In summary, management fees generally ranged from 1.0% to 2.5% of commitments. Many funds employed a “step-down” feature with respect to management fees. It is exceedingly common for advisory and transactions fees to have a dollar-for-dollar offset against the management fee.
Whether the fund chose to use a whole fund or deal-by-deal distribution waterfall has some correlation to its asset class; for example, no funds-of-funds in 2022 used a deal-by-deal structure. An 8% preferred return is most common, with private credit funds tending to have preferred returns at 7%. Growth equity and venture capital (VC) fund distribution waterfalls are somewhat complex. Carried interest in these strategies can either have a preferred return or a hurdle level that the fund manager must meet before being paid. There is often more than one hurdle within VC and growth equity structures; each hurdle level has a corresponding increase in carried interest. Carried interest was typically 20%, and an overwhelming majority of VC funds receive carried interest net of fees and expenses. Finally, most funds have a clawback provision.
Management Fees
During the Investment Period
In 2022, the investment period management fee ranged around 1.0% to above 2.5% across all asset classes (Figure 1).

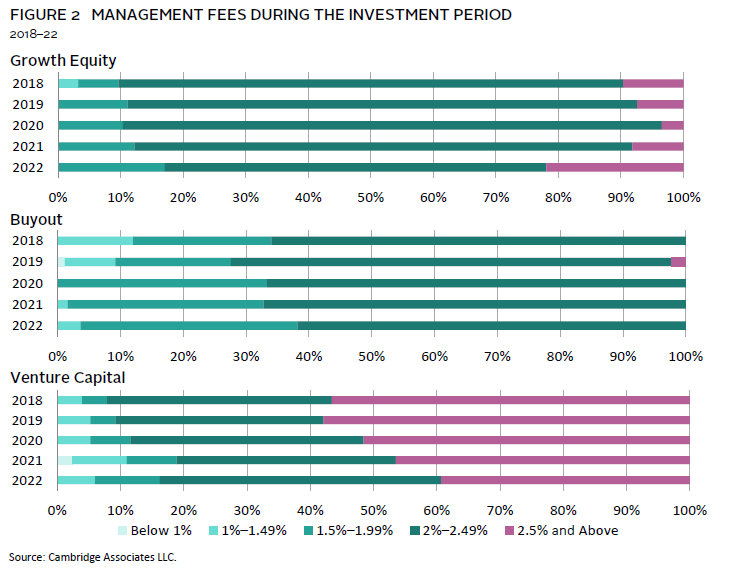
Growth Equity, Buyout, and Venture Capital Management Fees During the Investment Period
From 2018 to 2022, investment period management fees for growth equity, buyout, and VC funds remained relatively consistent. Throughout the period, 2% fees were predominant among growth equity and buyout funds; 2.5% was most common among VC funds.
Figure 2 breaks down the prevalence of each management fee percentage by year and asset class. There have been few material changes between 2018 and 2022. In 2022, there was an increase in the number of growth equity funds with a management fee of 2.5%. Since 2020, a management fee of 1% for buyout funds has become less common.
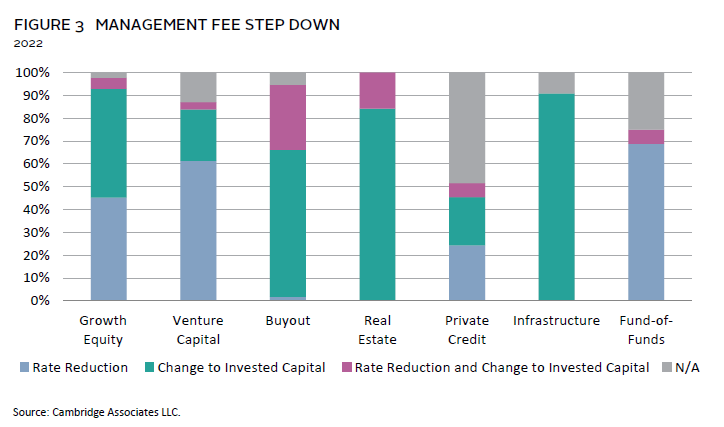
Management Fee Step Down after the Investment Period
In most cases, the management fee is reduced after the investment period. This is commonly referred to as the “step down.” There are three common approaches to this adjustment: 1) reduce the rate charged on committed capital; 2) maintain the same rate but apply it to invested capital instead of committed capital; and 3) combine elements of both the first and second approaches. Figure 3 indicates how common each step-down method is for each asset class. Growth equity funds most commonly changed their calculation basis to invested capital in 2022, although rate reduction came in a close second. Most VC funds and funds-of-funds used a rate reduction. Buyout, infrastructure, and real estate funds mostly made changes to invested capital.
Transaction Fee Offset
Transaction fees paid to an investment manager and its affiliates are typically offset by the management fee to prevent a misalignment of interest between the general partner (GP) and the LPs. This practice safeguards LPs from incurring both transaction and management fees and deters GPs from conducting excessive transactions. Within the industry, there is ongoing discussion about whether all such fees should be reduced by the management fee. However, it is clear where the market stands based on the data collected. In 2022, 93% of all the funds reviewed had a 100% offset of transaction fees; 4% of funds had no transaction fee offset provision in the limited partnership agreement (LPA). Only 3% of funds had an offset that was lower than 100%. However, among buyout funds 100% of funds had a transaction offset in 2022. In fact, 9% of all buyout funds in 2022 had a transaction fee offset percentage lower than 100%.
Distribution Waterfall
Deal Structure
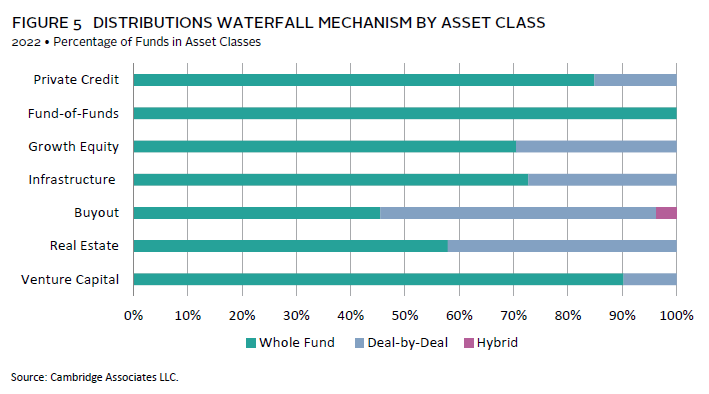
PI funds typically use either a whole fund (European style) or deal-by-deal (American style) structure (Figure 4). A whole fund might be more suitable for investors seeking a more conservative approach that aligns GP incentives with the overall fund performance, while a deal-by-deal model might be preferred for funds with a high degree of confidence in generating quick, high returns on individual deals. The whole-fund model has historically been most popular. In 2022, only 22% of funds contained a deal-by-deal structure.

The popularity of each distribution structure varies by asset class (Figure 5). In 2022, all funds-of-funds had a whole-fund distribution waterfall. Deal-by-deal was most prevalent in buyout and real estate funds.
Preferred Return
The preferred return is the minimum annual return that must be achieved before the GP can receive any performance-based compensation, such as carried interest. Figure 6 contains the 2022 preferred return data for select asset classes. The first quartile represents the lowest preferred returns in an asset class, while the third quartile represents the highest preferred returns for such asset class. In line with historical trends, most funds provided LPs with an 8% preferred return. The 8% preferred return in private equity balances risk and reward, aligning LP and GP incentives and establishing a clear industry benchmark. It compensates LPs for higher risks compared to traditional investments, ensuring they are rewarded before GPs claim profits. Its adaptability to various market conditions and straightforward figure makes it a practical and widely accepted standard in private equity fund structures.
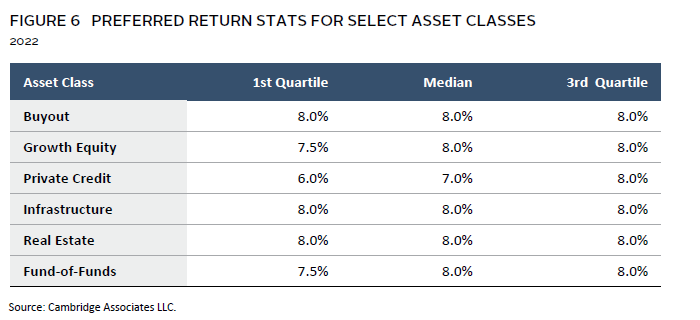
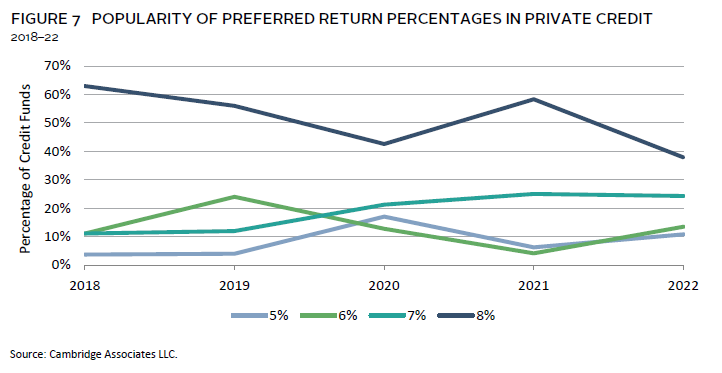
Due to its different return profile, private credit provided some of the lowest preferred returns of any asset class in 2022. Figure 7 shows the percentage of private credit funds with different preferred return levels between 2018 and 2022.
VC funds and funds-of-funds often contain more complex preferred return structures. Only 12% of the VC funds reviewed in 2022 had distribution waterfalls similar to those discussed above. Of those funds, about half provided 8% returns and the other half had preferred returns of 6% or 7%.
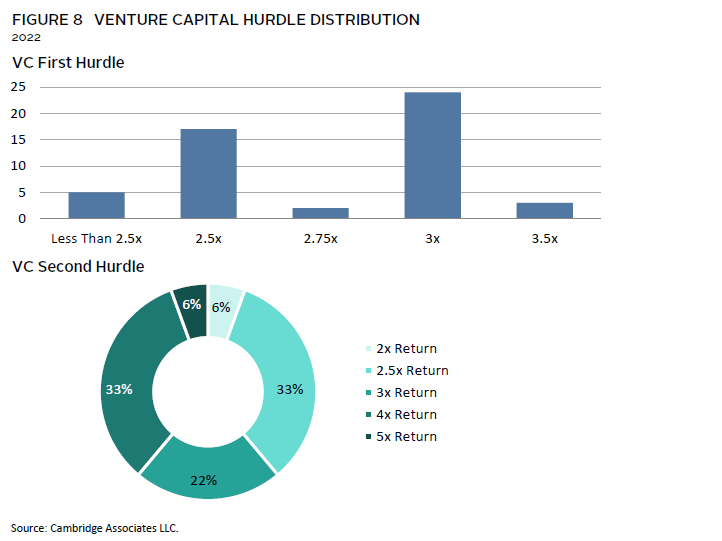
Many VC funds have a tiered distribution waterfall in which the GP’s carried interest is increased to a higher percentage after one or more hurdles are met. Figure 8 shows the popularity of the various VC hurdles in 2022. Hurdles of 200%, 250%, or 300% (i.e., 2x, 2.5x, or 3x of either LP commitments or contributions) were most popular. It is less common, but not rare, for the fund to have a second hurdle level; around one-fourth of the VC funds that had this type of hurdle also contained a second hurdle tier. The next level is usually higher than the first hurdle; 61% of these funds had a second level hurdle of 300% or more.
Because some funds-of-funds contain VC funds, they can have preferred return structures that emulate those found in VC funds (Figure 9). In 2022, nearly one-fifth of the funds-of-funds reviewed contained this type of structure, and the hurdles observed were on the lower end of what is seen for venture capital.
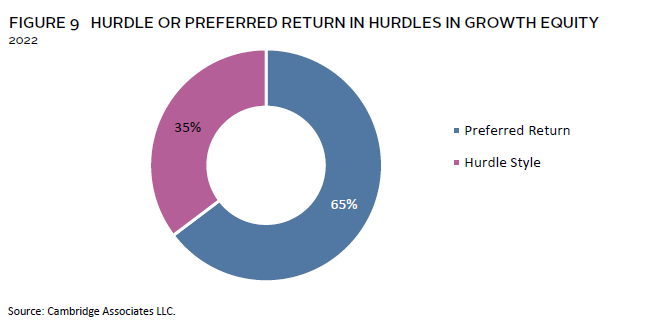
Not all growth equity funds contained typical preferred return percentages; many instead contained hurdle-style distribution structures like those seen in VC funds. In 2022, 35% of the growth equity funds reviewed had at least one hurdle. The first hurdle was typically either 200% or 250%. It was rare for a growth equity fund to have a multi-tier hurdle structure; only around 5% of the funds reviewed in this asset class had a second hurdle. Those hurdle percentages mimicked those seen in funds-of-funds, ranging from 200% to 250%.
Carried Interest
A distribution waterfall outlines the order in which profits are distributed to investors and fund managers. Carried interest is a portion of the returns that fund managers receive as compensation. Typically, this compensation is awarded after the fund achieves its preferred return. In 2022, almost three-fourths of funds reviewed had a 20% carried interest whereas, 28% of funds had smaller or larger carried-interest distributions. However, Figure 10 shows that there were some significant differences between asset classes. Most GPs received 20% carry, but some received as much as 30% in buyout, venture capital, and growth equity. The lowest carried-interest distributions of the year were found in fund-of-funds, and private credit; 15% carried interest appeared relatively common in these asset classes, and a significant number of fund managers received as low as 10%.
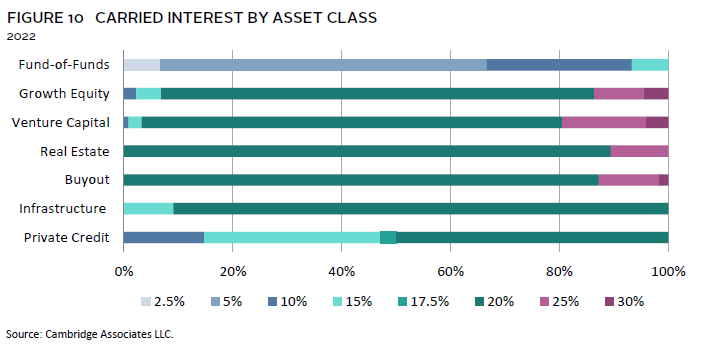
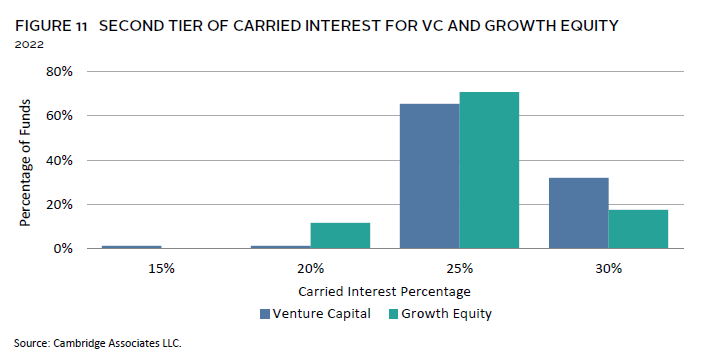
Figure 10 shows first-tier carried-interest percentages for both funds with preferred return structures and with hurdle structures. Slightly less than half of the VC funds observed did not contain a hurdle structure with multiple levels of carried interest. On the other hand, 59% of VC funds had a tiered carried-interest structure—with second and sometimes third levels of carried interest—and 38% of growth equity funds had a tiered structure. Regarding those funds that did increase carried interest after meeting a performance hurdle, the carry was increased within the parameters of Figure 9. As seen in Figure 11, for most growth equity and VC funds, carried interest increased to either 25% or 30% in the second tier. Second-tier carried interest was lower for funds-of-funds, generally either 10% or 15%.
Within all asset classes, carried interest is typically allocated net of taxes, fund expenses, and fees (including the management fee). Aside from VC funds, it is virtually unseen in other asset classes for funds to charge carried interest without regard to net profits, or “gross.” In 2022, even in venture capital, only 6% of funds charged gross carry.
Catch-Ups
Depending on the distribution waterfall, a fund may have a catch-up provision that allows GPs to receive a higher portion of profits after LPs have reached their preferred return threshold until the GPs are “caught up”. This mechanism ensures that GPs are compensated, aligning their incentives with those of the LPs. Most catch-up provisions allocate 100% of the profits to the GP until the GP has received an amount equal to its carried-interest percentage multiplied by aggregate profits (Figure 12). However, the catch-up allocation percentage varies and may be as low as 50%, meaning 50% of the profits get allocated to the GP until the GP’s allocated profits is in line with its carried-interest percentage. At that point, profits are split according to the carried-interest level.
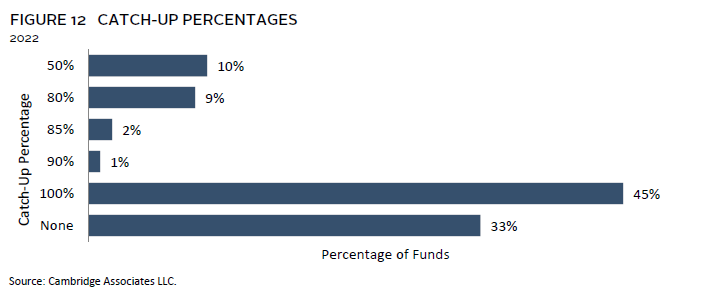
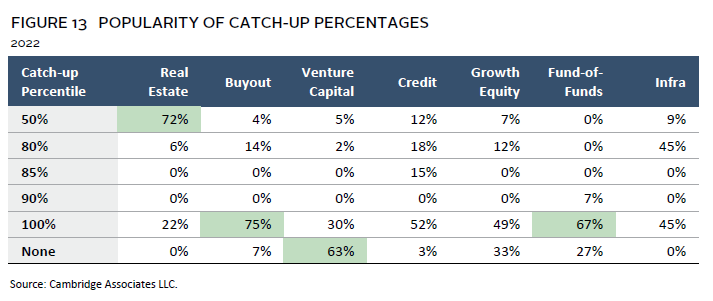
Figure 13 breaks down the popularity of each catch-up percentage by asset class. Whenever a certain catch-up percentage occurred in more than 60% of funds in an asset class, it has been marked below in bold to highlight a clear majority. Note, VC funds were less likely to have a catch-up clause. Fund-of-funds and buyout funds were more likely than others to have a 100% catch-up clause. Among VC funds that did have a catch-up clause, 100% was most common. Others, like private credit and infrastructure, show great variety in this regard. VC funds are much more likely than other funds to have no catch-up provision. The overwhelming majority of real estate funds have waterfalls with 50/50 catch-up clauses.
GP Clawback
Clawback provisions protect LPs by requiring that the GP restore carried-interest distributions if it has received more than what was agreed to in the LPA (Figure 14). It is extremely rare for a fund not to include such a provision in its formation documents. From 2018 to 2022, only 2% of the funds reviewed throughout all asset classes contained no clawback provision in their formation documents.
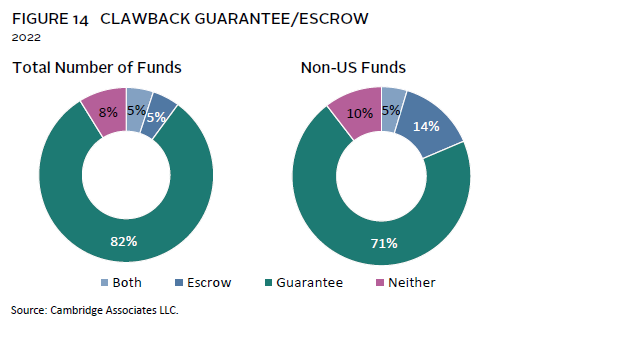
This obligation is typically secured by a legal guaranty signed by each carried-interest beneficiary. However, some funds organized in France, Luxembourg, the United Kingdom, and other parts of Europe will instead establish an escrow account, which temporarily holds carried-interest allocations before distributing the amounts to GP members.
While funds with clawback escrow accounts tend to originate outside the United States, they make up a small portion of non-US funds. As seen in Figure 14, excluding US funds only slightly alters the proportions illustrated. In 2022, 19% of non-US funds used an escrow account to secure clawback obligations.
Sheena Dovitz, Senior Investment Director, Investment Terms Research
Khai Pham, Associate Investment Director, Investment Terms Research
Annie Laird, Senior Investment Associate, Investment Terms Research
Erika Nickerson, Christian Roulleau, and Caryn Slotsky also contributed to this publication.
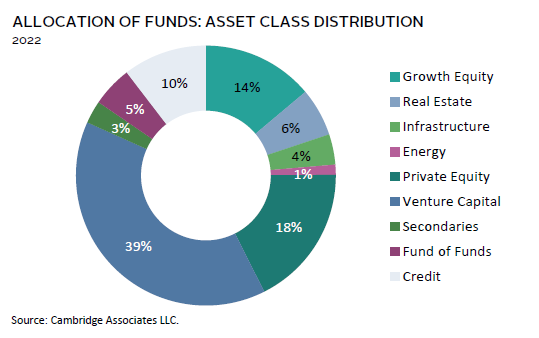
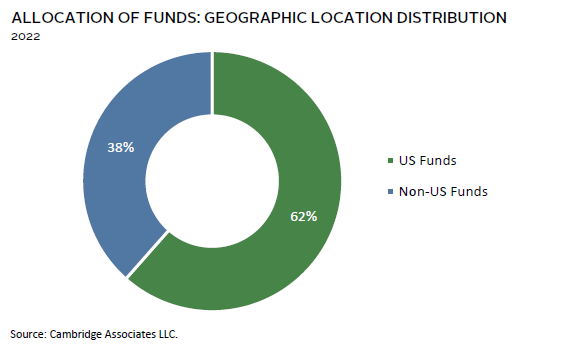
Methodology
The conclusions drawn in this report stem from proprietary reviews conducted by CA from 2018 to 2022. The data reflects the transposition of terms reviews written during this time frame as part of CA’s underwriting of fund managers. The asset class distribution of funds includes those whose legal documents were reviewed by CA in 2022. The funds’ geographic locations were both in and outside the United States.
Footnotes