Executive Summary
- Although many investors use mutual funds and ETFs interchangeably, the structures of these vehicles are quite different. Mutual funds aggregate assets from a broad range of (typically small) investors and use these assets to purchase a portfolio in which all shareholders own a proportionate stake; investors buy shares that are priced equal to the net asset value (NAV) of the underlying assets as of the market’s afternoon close. By contrast, ETFs are fund portfolios that can be traded throughout the day at market prices that may differ from the reported NAV of the underlying securities.
- Both ETFs and mutual funds will have tracking error versus the index they were designed to track. Some sources of tracking error are common to both ETFs and mutual funds, and produce only small performance deviations. Other causes of tracking error—bid/ask spreads and premiums/discounts to the NAV of the underlying index—are specific to ETFs. Most instances of ETFs trading at premiums or discounts to their underlying assets are short-lived, and most result from stale valuations for the underlying assets. Stale valuations can occur when an ETF is trading, yet its underlying assets are not.
- Low fees are often cited as one of the top advantages ETFs have over mutual funds. However, investors that trade ETFs can incur additional transaction costs—trading commissions and creation/redemption costs, bid/ask spreads, and market impact—that are not typically imposed when trading a mutual fund.
- Because ETFs are securities that trade on market exchanges, large transactions might subject the investor to adverse pricing, if the transactions are not well planned or the ETF’s underlying portfolio is illiquid. Paying a higher price than necessary at purchase, or receiving a lower price at sale, will reduce return and increase tracking error.
- Unlike most sales or purchases of individual stocks, the average daily trading volume of an ETF is generally not a determinant of its liquidity, and therefore is not particularly important in determining whether a transaction is viable. The best ways to assess the potential for adverse market impact are to evaluate the trading volume of an ETF’s underlying securities (not the trading volume of that ETF) and to contact the ETF’s sponsor for guidance.
- ETF use has become widespread in recent years, and ETFs offer convenient and, in many cases, economical exposure to a variety of asset classes and investment strategies. When choosing between an ETF and a mutual fund, investors should ensure that the potential advantages of ETFs are not outweighed by their potential drawbacks. Some key factors to consider include: anticipated holding length; fees and transaction costs; the investor’s tracking error sensitivity, demand for intraday liquidity, and desire for daily transparency; and the investor’s need for the potentially greater tax efficiency offered by the ETF.
Over the past two decades, exchange-traded funds (ETFs) have moved from relative obscurity and objects of curiosity in the investment community to astonishing popularity. With $3 trillion in assets globally—including more than $2 trillion in the United States, and projections to reach $5 trillion by 2020—this trend shows no sign of fading.
Many investors have come to see ETFs as a convenient way to express tactical views or temporarily park the proceeds from a fund redemption. ETFs are also replacing traditional mutual funds as the “core” in a core-satellite approach to the equity portfolio. ETFs are often seen as more liquid, tax-efficient, and transparent alternatives to mutual funds, at a perceived lower cost. While these advantages do not hold in all conditions for all ETFs, they have been true often enough to have prompted an enormous shift in the industry.
However, some investors that have incorporated ETFs into their portfolios have been surprised by the high tracking error of some ETFs and higher than expected total costs of ownership (including both fees and transaction costs to buy and sell ETF shares). Additionally, some investors have misconceptions about how to estimate the market impact of ETF purchases and sales they are considering. In this report, we seek to help investors understand some of the key differences between ETFs and traditional mutual funds by reviewing their mechanics, highlighting sources of tracking error, outlining fee considerations, clarifying market impact, offering a set of key decision points for choosing between an ETF and a mutual fund, and discussing best practices for trading ETFs.
Reviewing ETF Mechanics
Many investors use mutual funds and ETFs interchangeably. After all, both can offer exposure to the same benchmarks. However, the structures of these vehicles are quite different, and short-term results can vary.
Mutual funds aggregate assets from a broad range of (typically small) investors and use these assets to purchase a portfolio in which all shareholders own a proportionate stake.[1]Throughout this paper, “mutual fund” refers only to open-ended mutual funds. Mutual funds issue and redeem new shares daily on demand, accepting cash inflows or outflows. Investors buy shares that are priced equal to the net asset value (NAV) of the underlying assets as of the market’s afternoon close.
By contrast, ETFs are fund portfolios that can be traded throughout the day at market prices that may differ from the reported NAV of the underlying securities. While the number of ETF shares can expand and contract to accommodate large inflows or outflows, investors can also buy and sell ETF shares from each other on the secondary market throughout the trading day. Because ETFs can be traded intraday, regardless of whether their underlying securities are transacting (for reasons that we will explore later), ETFs can trade at a premium or a discount to the quoted NAV of their underlying security basket.
Figure 1 depicts the subscription/purchase process for traditional mutual funds and for ETFs. The redemption/sales process is essentially the reverse of this.
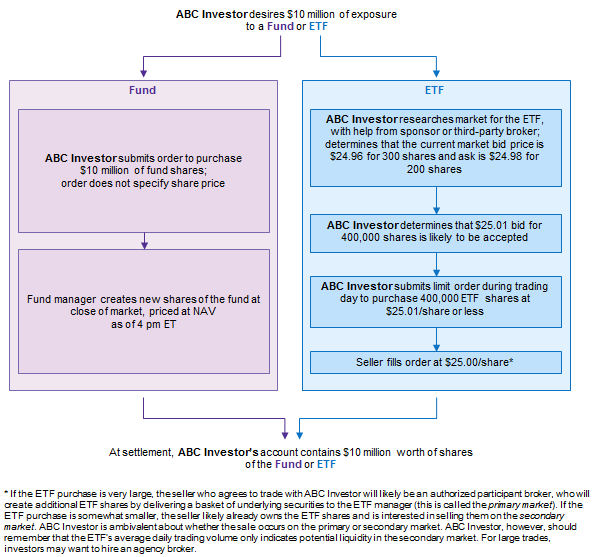
Figure 1. The Subscription/Purchase Process for Mutual Funds and ETFs
Don’t Be Fooled by the Name
Leveraged and inverse-leveraged ETFs have gained some traction in recent years. These ETFs are designed to deliver a multiple of the long or short return of a given index, and often have names like “UltraShort” or “3x Shares.” Certainly investors understand the obvious risks of introducing leverage into an investment (counterparty risk, etc.), but many are still duped by the names of these ETFs. They assume that a 3x vehicle on an index should earn three times the return of that index and are surprised when this is not the case. For calendar year 2011, the S&P 500 Index posted a modest return of 2.1%. A three-times-levered ETF based on this index returned -14.9%, rather than the +6.3% return the name would imply.
The reason for the massive dislocation between perception and reality is that these vehicles are designed for short-term investors, and thus most settle daily. This means that the daily compound return of a double-levered ETF over one year may be dramatically different from simply doubling the target index’s return over the same period. In volatile markets, a double-levered ETF can post a loss even if the underlying index posts a modest gain. Investors considering these vehicles must understand how they actually work, as opposed to trusting their names. Only investors that plan to rebalance their portfolio daily (mechanically adjusting the exposure to the leveraged ETF) should even consider using these ETFs for weeks or months.
Sources of Tracking Error
Both ETFs and mutual funds will have tracking error versus the index they were designed to track. The common factors among both ETFs and mutual funds that can create tracking error include: fees, dividend tax withholding, securities lending, use of sampling or derivatives rather than full replication to track the index, the treatment of corporate actions, transaction costs within the portfolio, the treatment of index changes, the availability of underlying index components for purchase (an issue for some fixed income ETFs), and cash holdings. Most of these factors will only produce small amounts of tracking error (the first three are most likely to generate larger amounts) and most managers are experts at minimizing them. Analyzing historical tracking error over time can give investors a sense of a manager’s ability to manage these sources.
However, the ETF structure creates some additional potential for tracking error beyond that seen in mutual funds, even if the portfolio of underlying securities is identical. This can surprise investors, enhancing or reducing the returns of any ETF, domestic or global. Sources of tracking error found in ETFs but not in mutual funds include bid/ask spreads and premiums/discounts to NAV, described on the next page. The effect of these sources of tracking error in ETFs can be quite substantial. Figure 2 breaks down the sources of tracking error for a popular ETF that tracks non-US stocks.

Figure 2. An Example of the Sources of Difference in Total Return between ETF and Index
Source: The Vanguard Group, Inc.
Note: Represents the return of the Vanguard Total International Stock ETF (VXUS) versus the FTSE® Global All Cap ex US Index over calendar year 2015.
Bid/Ask Spreads
ETF bid/ask spreads can create additional costs and tracking error for investors. For very liquid, popular ETFs, the bid/ask spread can be very small—an S&P 500 ETF can trade with spreads as low as 1 basis point (bp). For ETFs with underlying securities that are illiquid or that do not trade within the same time window as the ETF, spreads can sometimes be much wider.
As of October 2016, bid/ask spreads averaged 5 bps or less for almost 80% of the emerging markets ETFs with greater than $1 billion in assets under management. Spreads for niche emerging markets products (including factor ETFs, single-country ETFs, and emerging small-cap ETFs) were substantially higher, with bid/ask spreads greater than 20 bps for more than two-thirds of such products. For large trades in such ETFs, an investor is likely to need to buy shares at a price slightly above the prevailing ask price, or to sell shares at a price slightly below the prevailing bid price, because bids and asks often only reflect supply and demand for a few hundred shares of the ETF; accessing deeper levels of liquidity entails extra cost.
A meaningful bid/ask spread can also impact an ETF’s end-of-period valuation used in performance reporting, another source of tracking error (custodians will often use an ETF’s closing bid as the valuation for that period).
Premiums/Discounts to NAV of Underlying Index
Generally, an ETF’s creation/redemption arbitrage mechanism prevents meaningful premiums or discounts from persisting; however, true premiums/discounts can exist when demand for the asset class is particularly strong/poor. Most of the reported premiums/discounts that ETF investors experience are actually more about optics than about economics. Most are short-lived, and most result from stale valuations for the underlying assets, due to illiquidity or time-zone differences. That said, the differences can result in substantial deviations between the reported performance of the ETF and of its parent index, even if both the ETF and the index have the same security allocations. Optics, yes, but distracting nevertheless.
Typically, premiums and discounts occur when an ETF is trading, yet its underlying assets are not. A disconnect between the trading hours of an ETF and its underlying securities is the most common source of premiums and discounts to reported NAV. This is because the price of an ETF is set by market participants and can reflect the most up-to-date economic and corporate news; if the market for an ETF’s securities is not currently trading, the reported intraday NAV will instead reflect what the underlying portfolio’s value was several hours earlier.
Imagine a US-based investor considering the purchase of a Japanese equity ETF on Monday, April 18, 2016. An earthquake in Japan over the weekend sent the Nikkei Index down 3.4% that day. But by the time US markets opened, investors appeared to be less concerned about the impact of the quake, and the lowest trade of the day was just 0.4% below the closing level of the prior Friday. The ETF’s performance from that starting point would show several percentage points of tracking error because the investor’s Japan exposure would have been initiated at a price at least 3% above that day’s closing index value. This tracking error is not the “fault” of the ETF or of its portfolio manager; rather, it is the result of a stale index value and stale NAV. While not economically meaningful, that does not mean the reported tracking error will not be a distraction to stakeholders who see it in a performance report![2]Some ETF sponsors provide attribution analysis similar to Figure 2, and this can help explain the reasons for the tracking error, but the methodology is not standardized. For example, Vanguard’s … Continue reading
The problem of stale NAVs is most common in markets that do not trade in sync with the market where the ETF is listed. For US-listed ETFs, holdings of Asian securities are particularly problematic, while holdings of European securities become problematic when the ETF is traded in the afternoon, Eastern Time. Broad developed markets ETFs like those tracking the MSCI EAFE Index have substantial overlap with US markets during the initial hours of the trading day, because European markets are well represented in those indexes. Emerging markets indexes such as the MSCI Emerging Markets Index, on the other hand, are dominated by Asian markets, which now make up over 70% of market cap. These markets do not have a minute of overlap with the US trading day, making ETFs (together with American depositary receipts—ADRs) effectively a price discovery source, rather than trackers of a stale index value. US investors buying an MSCI Emerging Markets ETF this afternoon will have the ETF’s performance measured against the MSCI Emerging Markets Index, but that index’s value has largely been determined hours before they buy the security, and the price they pay is determined largely by events that occurred after the index values for Asian and European markets were already struck (Figure 3).

Figure 3. Overlap of US Trading Day with Local Market Trading for Selected Emerging Markets
Typical Business Day
Sources: Bloomberg L.P., FactSet Research Systems, and MSCI Inc. MSCI data provided “as is” without any express or implied warranties.
Notes: All times are Eastern Daylight Time. Opening and closing times are calculated to 15-minute intervals for the largest public stock exchange in each country as of October 26, 2016. Not all stock markets are open Monday through Friday, and some stocks trade on multiple exchanges. The selected countries are the eight largest components of the MSCI Emerging Makets Index by market cap and represented 84.2% of that index as of September 30, 2016.
ETFs can, in rare cases, also trade at sharp discounts to their true underlying value. One recent example was August 24, 2015, when trading in hundreds of individual US stocks was halted due to the application of “circuit breakers” designed to limit market volatility. This made the calculation of real-time index values unreliable (because some of their components were not trading), yet ETFs continued to trade (likely dominated by market sell orders or stop orders). Some market participants that typically are a source of liquidity stepped away from the market amid the confusion and volatility, and bid/ask spreads became chasms. A handful of ETFs plunged in value, before recovering within about an hour (see Figure 4 for one example of what happened that day, and the sidebar for an additional example of the impact of a discount to NAV). Investors using limit orders would not have sold their ETFs at 70 cents on the dollar, but an investor that entered a market order to sell might have had that result, as might an investor that had a stop in place requiring the broker to sell if the ETF price fell below a particular trigger level.[3]As a reminder, orders provide a broker direction on how to fulfill trades. A market order commands the broker to execute the trade at whatever price is available in the market, which is particularly … Continue reading Both stops and market orders are generally inadvisable for ETFs. With a limit order, investors control the price at which they buy or sell an ETF.[4]Of course, if the market price is different from the limit order price, the trade may not be fulfilled—investors can have certainty of price or certainty of execution, but not both.
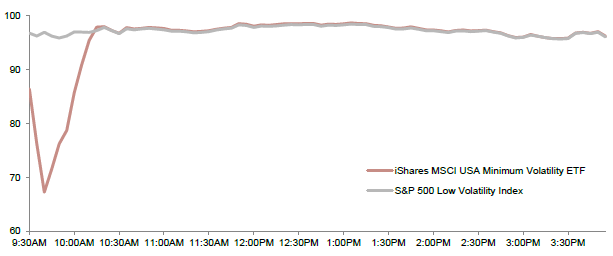
Figure 4. ETF Price vs Parent Index During One Market Disruption
August 24, 2015 9:30AM – 4:00PM
Sources: BlackRock, Inc., Bloomberg L.P., and Standard & Poor’s.
Notes: Data is intraday during normal NYSE trading hours at 5-minute intervals where available, and rebased to 100 at close of business on the prior trading day.
Exchange-Traded Notes
As ETFs have proliferated over the past two decades, interest has increased in securities that trade on secondary markets similar to ETFs, but that have structures, investment objectives, and risks that may differ in reality. These other exchange-traded products include exchange-traded notes (ETNs), which are debt securities, often issued by a bank, with underlying values that are tied to an index or investment strategy. Like other debt securities, ETNs often have a maturity date, but unlike most debt securities, they do not provide a fixed coupon yield (some provide no yield). ETNs typically offer indirect exposure to sectors or assets that would otherwise be impractical for some types of investors to access, typically for scale or tax reasons, including master limited partnerships (MLPs), commodities, and VIX futures. Because ETNs represent a bank’s promise to pay an index-associated value at maturity, they do not have underlying portfolios of securities; banks that issue ETNs can hedge their resulting exposures however they choose. ETN vehicles are different from ETFs and, while they have seen increased interest over the years, their universe is considerably smaller than the ETF universe.
Like ETFs, ETNs can also trade at a premium or discount to NAV. An ETN that tracks the Alerian MLP Index (an index of a variety of energy MLPs) provided a concrete example of this in mid-2012. J.P. Morgan, the product’s sponsor, announced that it was suspending issuance of new shares, creating a supply/demand imbalance. The price of the ETN began to trade at a premium to the MLP index, and continued to do so for several days. Investors that purchased the ETN during the period would go on to experience returns well below those of the underlying MLP index.
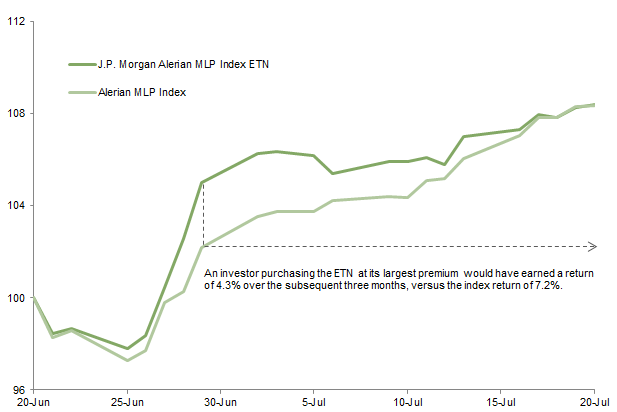
Comparing Prices for an ETN and the Index It Tracks
June 20, 2012 – July 20, 2012 • Rebased to 100 on June 20, 2012
Sources: Alerian, Bloomberg L.P., and J.P. Morgan Securities, Inc.
Notes: Data are daily. Largest premium was on June 29, 2012. Returns shown are price only and do not incorporate distributions.
The problem of stale NAVs also happens occasionally with corporate or municipal bond ETFs when volatility springs up. Because most corporate or municipal bonds do not trade at all in a given day, pricing services have some leeway in estimating values of the individual bonds that make up an ETF portfolio. In addition, during periods of volatility, the bid/ask spread of a bond ETF might remain fairly narrow, while it will widen for cash bonds. The price of the ETF will decrease as it continues to trade, while cash bond trading dries up. As a result, NAV movements are sometimes less violent than the price changes of bond ETFs, and the ETF can move to a reported discount to NAV. However, the ETF price likely presents a more realistic picture of true value than its NAV during those times.
Investors choosing to use ETFs should be aware that the products often trade at premiums or discounts that primarily stem from time differences between the ETF’s trading and the trading of its underlying security, but can also reflect market structure anomalies or supply/demand imbalances. Investors should take care to avoid buying ETFs that are truly trading at a significant premium to their underlying assets, and must realize that even “false” premiums/discounts that stem from time differences can be a distraction when evaluating performance, even over relatively long time periods.
Fee Considerations
Low fees are often cited as one of the top advantages ETFs have over mutual funds and, for many investors, ETF fees are often lower than fees for a comparable index mutual fund, particularly a fund’s retail share class (which may have front-end loads or other transaction fees). However, ETFs have additional costs that can make them more expensive than index mutual funds. The most explicit cost is trading commissions, which are usually quite small relative to the size of the transaction. Another cost is the bid/ask spread, previously discussed. Finally, for large transactions (often in excess of 50 million shares), investors may pay the ETF sponsor as much as a few thousand dollars in fees (less for domestic ETFs) to create or redeem ETF shares.
In fact, the size of the investment typically impacts the cost differential between an ETF and a mutual fund due to two primary factors. First, very large ETF trades are likely to be somewhat more costly than smaller trades because the investor may need to use a limit order that is less favorable than the current bid/ask to entice market participants to take the other side of the trade (such as in the example in Figure 1). Second, many mutual funds offer lower fees for institutional share classes, often with higher minimum investments or required investor qualifications; ETFs, on the other hand, are one size fits all. Many index fund providers have been aggressively cutting fees on both ETFs and mutual funds in recent years, and creating newer institutional share classes with even higher minimum investments and even lower fees. For large investors, there is no reliable rule of thumb as to which vehicle is cheaper for a given exposure at, for example, BlackRock or Vanguard, two of the largest index fund and ETF managers in the industry (see Figure 5). The total expense ratio shown in Figure 5 includes ongoing fees paid from the product to the manager, transfer agent, and other firms; it does not include the transaction costs of the ETFs, which vary over time and by the size of investment.
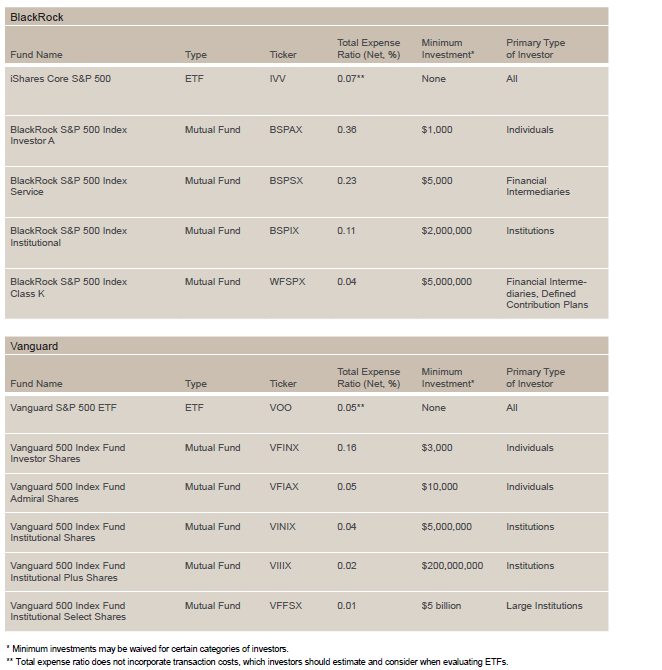
Figure 5. Selected S&P 500 ETFs and Index Mutual Funds Offered by BlackRock and Vanguard
Sources: BlackRock and Vanguard websites as of August 11, 2016.
Transaction costs (bid/ask spread, applicable creation/redemption fees, and a modest brokerage commission) can also add up if investors are trading in and out of ETFs frequently. For example, if an investor is choosing between an ETF that charges 12 bps in expenses annually and a mutual fund that charges 18 bps annually, and a round-trip transaction in the ETF is estimated to cost 5 bps, the ETF would be meaningfully cheaper for a three-year holding period but much more expensive than the mutual fund for a three-month holding period.[5]Some fund managers (particularly Vanguard) aggressively enforce policies to prevent use of their index mutual funds for short time horizons, and investors that sell such funds a few months after … Continue reading Rather than assume that ETF fees are lower, investors would be well served to investigate the fees (and estimated round-trip transaction costs, in the case of ETFs) of the various vehicles offering similar investment exposure, evaluating each on a case-by-case basis.
Clarifying Misconceptions About Market Impact
Because ETFs are securities that trade on market exchanges, large transactions might subject the investor to adverse pricing, if the transactions are not well planned or the ETF’s underlying portfolio is illiquid. Paying a higher price than necessary at purchase, or receiving a lower price at sale, will reduce return and increase tracking error.
When buying a mutual fund, investors simply place an order to buy or sell the amount or value of mutual fund shares and trust that the trade will take place at a fair portfolio valuation.[6]For mutual funds that own liquid equity securities traded during the hours when the US market is open, this is typically a simple matter. For funds owning securities, such as municipal bonds, that do … Continue reading With ETFs, the onus is instead on the investor to ensure that the transaction takes place at a reasonable price. Defining “reasonable” can be somewhat difficult when the ETF’s underlying securities have stale valuations (whether because they are somewhat illiquid, such as high-yield bonds, or because the ETF is trading at a time of day when the underlying assets are not). However, it can be done, as investors can research pricing with the help of the ETF’s sponsor, a third party, and market data such as competing ETFs, futures, and ADRs.
How do investors know which ETFs will cause costly liquidity-related problems when the investor trades them? The answer may be surprising. Unlike most sales or purchases of individual stocks, the average daily trading volume of the ETF is generally not a determinant of its liquidity, and therefore is not particularly important in determining whether a transaction is viable.
If an investor wanted to buy $5 million of an individual stock, and the stock traded an average of only $1 million shares per day, the investor would likely need to spread the purchase out over several weeks to avoid pushing up the share price. On the other hand, some ETFs with very low trading volumes can absorb trades that are large multiples of average volume, provided (a) the underlying securities are highly liquid, and (b) the trade is executed carefully. This is because when institutional investors purchase ETF shares, the purchase can occur in the secondary market (generating the aforementioned daily trading volume), or the purchase can result in the creation of additional ETF shares (see Figure 1 for a description of this process). Thus, the liquidity of an ETF’s underlying securities is much more important than the trading volume of that ETF.
Figure 6 depicts the relationship between average daily trading volume for several ETFs and the estimated price impact of a $50 million trade in each.[7]The ETFs shown in Figure 6 are all sponsored by BlackRock, which provided the cost-impact estimates. We believe ETFs sponsored by other firms would also show little or no relationship between an … Continue reading If an ETF’s average daily trading volume determined the market impact of a large trade, then heavily traded ETFs would universally have low market impact, and lightly traded ETFs would always have a high market impact. The dots in the scatterplot would form a straight diagonal line from the upper left to the lower right, and the R-squared, or the degree to which a change in average daily trading volume is associated with a change in price from a $50 million trade, would be close to 100%. Yet, that is not the case as the R-squared is just 5%. In fact, a short-term Treasury ETF could accommodate an individual trade nearly equal to its average daily trading volume, with resulting market impact of just 1 bp. And on the flip side, a high-yield bond ETF trades more than $1.4 billion per day, yet a $50 million trade (just 4% of average daily trading volume) would result in an estimated 7 bps of market impact. The market impact differences in these cases come primarily from the underlying securities. In the former case, market participants could easily use Treasury futures or other instruments to hedge their exposure until a creation or redemption trade settled, and the Treasury market is extremely liquid, resulting in a small market impact for a large trade in the ETF. In the latter case, individual high-yield bonds tend to have low liquidity, resulting in greater market impact for the ETF.
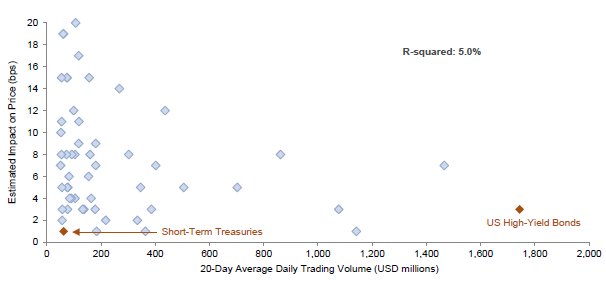
Figure 6. Estimated Impact of a $50 Million ETF Trade
For iShares ETFs with Trading Volume Greater than $50 Million
Sources: BlackRock, Inc. and Bloomberg L.P.
Notes: Average daily volume calculated as a 20-day average through December 31, 2015. Estimated impact on price data are as of February 5, 2016. Six iShares ETFs are not shown: two have an average daily volume greater than $2 billion, and four have an estimated impact on price greater than 20 basis points.
The best ways to assess the potential for adverse market impact are to evaluate the trading volume of an ETF’s underlying securities (not the trading volume of that ETF) and to contact the ETF’s sponsor for guidance. Some ETF sponsors staff capital markets desks that can offer guidance on market impact and on the most effective execution strategy for a given ETF. The sponsor can recommend a trading strategy based on the liquidity of the ETF in the secondary market, and the liquidity of the underlying securities. For example, if the best offer quoted is only for 500 shares of the ETF and the investor wishes to purchase 400,000 shares, the ETF sponsor might advise the investor to place a limit buy order that is slightly above the existing bid (which will incent market participants to create new ETF shares if necessary). As previously noted, market orders are generally inadvisable.
Decision Points and Best Practices
ETFs and mutual funds share many similarities, but their differences are critical to understand when choosing one over the other. Some key factors to consider include:
- Anticipated Holding Period. Some mutual funds discourage investors from trading frequently. They may have restrictions or charge redemption fees if an investment is redeemed within a short time frame. ETFs are tradable securities and thus do not have strict restrictions on buying and selling; investors only have to be aware that they will pay transaction costs. However, the shorter the time horizon, the shorter the period over which the transaction costs are amortized.
- Fees and Transaction Costs. Highly fee-sensitive investors may lean toward ETFs because of generally lower advertised fees. However, if the investment is large enough, it may qualify for the institutional share classes of index mutual funds,[8]For particularly large investments in index-tracking products, separately managed accounts or collective investment trusts may also be more cost effective than an ETF. which often have lower fees than retail share classes or ETFs and no transaction costs. As discussed, investors should carefully examine fees together with estimated transaction costs over their projected holding period to determine which investment vehicle provides the best access to the exposure they’re seeking.
- Tracking Error Sensitivity. Though both index mutual funds and ETFs will have some tracking error versus the indexes they are meant to track, ETFs can see higher deviations, due to fluctuation of the premium/discount relative to the underlying securities, as well as bid/ask spreads. As a result, investors very sensitive to tracking error may be happier with index mutual funds.
- Need for Intraday Liquidity. The flexibility to transact an ETF at any point during the trading day, rather than at the market close only, is highly touted, but it can be more curse than blessing. Investors choosing to use an ETF will need to take more care with implementation than they would with a mutual fund purchase or redemption, because careless execution can result in overpaying for the underlying assets at the time of purchase and/or receiving a haircut on the underlying assets at the time of sale. Investors should assess whether this “benefit” of ETFs is one they will actually use.
- Desire for Daily Transparency. As a condition of getting regulatory approval, ETFs are required to provide daily holdings on their website to ensure that shares will consistently trade at or near the value of the underlying securities.[9]A new breed of ETFs called exchange-traded mutual funds, or active ETFs, trade intraday but are not fully transparent daily, preventing front-running. Mutual funds are not required to disclose their composition daily, but they typically disclose holdings monthly or quarterly. Additionally, the portfolios of index funds will almost always hew closely to their benchmarks. Investors that need a more real-time understanding of what they are holding may prefer ETFs over mutual funds.
- Tax Efficiency. ETFs can be more tax efficient than a mutual fund investing in the same securities. Mutual funds generate short-term and long-term capital gains each year throughout an investor’s holding period. These taxable capital gains cannot be controlled by the investor, making tax planning more difficult. ETFs are less likely to incur taxable events during a given year, unless the investor sells the ETF shares. The reason for the difference is that when large investors redeem from an ETF, the ETF sponsor is able to pay out the redemption in-kind using securities with a low cost basis.[10]The securities are not distributed directly to the redeeming shareholder; rather, they go to the authorized participant that then settles the transaction in cash with the redeeming shareholder. ETFs … Continue reading By systematically culling the portfolio of low-basis shares, the ETF’s sponsor often will not need to distribute meaningful capital gains to investors at year-end, and will not build up a large overhang of low-basis shares. While ETFs are generally more tax-friendly than an index mutual fund (and certainly more than most actively managed mutual funds), investors desiring additional control over realized gains, including the ability to gift appreciated securities to charity, should consider tax-managed separate accounts, with a manager that is specifically tasked with harvesting losses and deferring gains.
In summary, investors that desire passive exposure to an asset class should compare index mutual funds to ETFs, focusing on the total cost of ownership, including both fees and anticipated transaction costs over the holding period; the willingness to accept elevated tracking error; and any particular needs for enhanced liquidity or transparency. If an ETF is the best vehicle for the situation, investors must also be careful about when and how they implement, since ETFs are tradable securities. A few best practices in trading ETFs will help investors minimize the surprises that can be associated with these investments.
- Keep an eye on the liquidity of underlying securities, not just the ETF’s trading volume.
- Trade when underlying markets are open to reduce tracking error, if possible.
- Consult the ETF’s sponsor or a third party for guidance in trading the product.
- Be aware that market opening and closing times have the most volume, but they can be chaotic.
- Use appropriate order types—limit orders are typically safer than market orders.
- Watch volatility—spikes can widen bid/ask spreads.
- Consider hiring an agency broker to compare secondary market and authorized participant (primary) quotations for large transactions. This comes with a cost: typically 1 cent per share in the United States, and as high as 12–15 bps in other countries.
Sean McLaughlin, Managing Director
Deborah Christie, Managing Director
Michael Kellett, Senior Investment Associate
David Kautter, Senior Investment Associate
Footnotes