Executive Summary
- The market for diversified growth funds (DGFs), multi-asset investment strategies that often aim for the ambitious goal of generating long-term, equity-like returns with lower volatility, has grown rapidly over the past five years, driven largely by UK defined benefit pension schemes seeking risk-controlled, long-term growth solutions.
- While DGFs share a common fundamental goal, the DGF label is frequently applied to a confusingly varied range of funds with different underlying strategies. Based on their risk characteristics, we identify the emergence of two distinct categories of DGFs, which can help clarify the landscape for trustees. The first, traditional DGFs, rely largely on directional market exposures to generate returns. The second, absolute return DGFs, predominantly emphasise a relative value approach. Both approaches imply distinct risk/return expectations, differing attractiveness across market environments, and varying roles in the broader scheme portfolio.
- Evaluation of historical performance is difficult as benchmarking outcome-oriented solutions such as DGFs can be challenging, and the number of DGF managers has only reached significant size recently, limiting the number of years that can be analysed. Since 31 October 2007, when our universe of DGFs first reached ten funds, the median DGF has lagged a simple 60/40 stock/bond portfolio, although DGFs have generally achieved their volatility-reduction objective and outperformed LIBOR and inflation.
- Rigorous DGF manager selection is essential, especially where the allocation to DGFs is large. Annual performance dispersion across DGFs has been significant, with top and bottom performers often separated by 15 ppts or more. Dispersion shrinks over longer time periods; over the past five years, the spread between the return of DGFs in the 75th and 25th percentile was 110 bps per annum. In the current low absolute return environment, trustees need to maximise their chances of being in the top quartile by adopting a rigorous evaluation approach that leaves no stone unturned.
- DGFs can play a variety of roles in pension portfolios. Schemes can use DGFs as a growth portfolio replacement, dynamic growth core, or liquid diversifier within the growth portfolio. The attractiveness of each role depends on each scheme’s size, governance structure, constraints, and objectives. Trustees must match the desired portfolio role with the DGF strategy and manager selected.
- In our view, DGFs’ aim to generate long-term growth with lower volatility than equities is intuitively appealing for pension schemes, but inherently difficult to achieve. The DGF market is large and diverse, and has delivered mixed results thus far. Trustees need to look carefully to appreciate the variety of DGF strategies, set appropriate risk/return expectations, and evaluate DGFs’ role in the context of the total portfolio. While the DGF market growth story has been alluring, all that glitters is not gold.
Diversified growth funds (DGFs) have been a fast growing segment of the investment product landscape over the past five years, particularly amongst UK defined benefit pension schemes seeking long-term growth solutions without equity volatility. DGF assets under management (AUM) have grown from approximately £100 billion in December 2013 to over £150 billion as of March 2015 by our analysis, and a recent Spence Johnson study suggested that the DGF market could break £200 billion by 2018 (Figure 1).
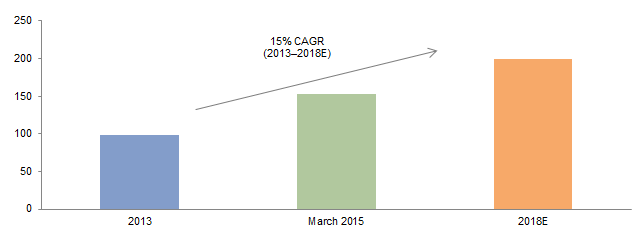
Figure 1. DGF Market Growth
AUM (£ billion)
Sources: Cambridge Associates LLC estimates and Spence Johnson.
Note: The 2013 data and 2018 estimates are based on analysis from research firm Spence Johnson, while the March 2015 DGF assets under management are calculated by Cambridge Associates LLC.
In the context of this significant growth, the number and range of funds tagged as DGFs have proliferated. As a result, the DGF universe is now extremely heterogeneous and increasingly difficult to navigate. Some DGFs resemble enhanced balanced funds, while others are more akin to hedge funds in a liquid format. Performance and risks vary across strategies, forcing trustees to dig deeper to find the funds suited to their investment objectives.
In this report, we review the DGF landscape and performance track record, categorise DGFs by underlying strategy, discuss risk/return expectations, and explore the roles DGFs can serve within a pension portfolio.
Diversified Growth Funds Defined
While individual DGFs have different investment strategies and portfolios, their overarching stated objective is relatively consistent and straightforward: DGFs aim to deliver long-term, equity-like returns with lower volatility. Figure 2 presents an illustrative example of a typical DGF’s risk/return objectives relative to our long-term assumptions for global equities and UK gilts.
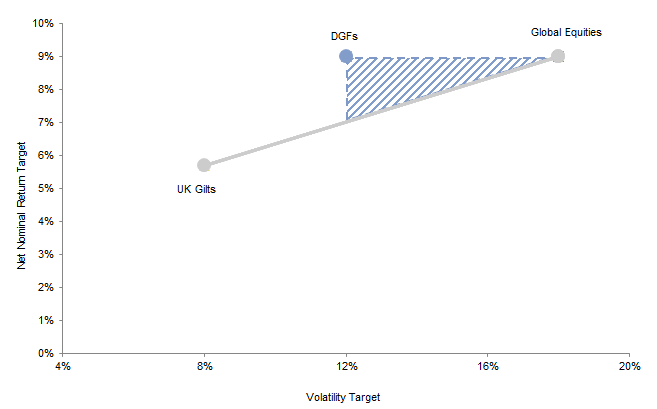
Figure 2. Illustrative DGF Target Risk/Return Compared to Equities and Gilts
Net Nominal Return Target
Sources: Cambridge Associates LLC and investment manager data as provided to Cambridge Associates LLC.
Notes: Global equity and UK gilt risk and return are based on Cambridge Associates’ long-term equilibrium asset class assumptions, which are not reflective of a particular market environment. The DGF risk/return target reflects many DGFs’ stated goal of achieving equity-like returns over the long term with approximately two-thirds the volatility of global equities.
As their name implies, DGFs employ a diversified multi-asset investment approach. They allocate across traditional and alternative asset classes, including equities, bonds, credits, property, infrastructure, commodities, hedge funds, private equity, and currencies. Therefore, DGFs can provide pension schemes with exposure to a wide range of growth assets within a single fund.
By diversifying across growth assets, DGFs aim to source returns from different markets and add value through dynamic asset allocation, as well as through security selection and other means. In theory, DGFs’ enhanced flexibility and diversification should increase portfolio efficiency relative to investing in equities alone.
About Our Methodology
For the analysis shown in this report, we identified a total of 38 institutional-quality DGFs to include. We defined DGFs as multi-asset funds pursuing a global tactical asset allocation (GTAA) or relative value strategy in a liquid format (primarily daily dealing), and we excluded balanced funds and risk parity products. To be included in our universe, a fund must have an active GBP-denominated vehicle with realised performance that could be investable for UK pension schemes. In most cases, the performance we evaluated is for this vehicle; where available, we used composite performance provided by the manager, also denominated in GBP. We excluded DGF managers based in the United States or Europe that have yet to enter the UK market and do not have a realised performance track record in GBP.
Given the rapid recent growth in the DGF space, only 19 funds have performance dating back more than five years, and nine funds have performance available for less than three years. The total AUM of the 38 funds in our universe is an estimated £153 billion, with over half of that concentrated in three funds. The smallest fund in the identified universe has an AUM of £11 million, although our performance analysis only includes the 35 DGFs with at least £30 million in assets (this is how Cambridge Associates defines “institutional quality,” in part—AUM of at least £30 million/$50 million). All DGF returns used in our performance analysis are in GBP and net of manager fees. DGF manager fees typically range from 50 bps to 100 bps on assets and generally do not include a performance fee component. In calculating performance, we have taken the median fund performance of available manager returns in each period. This methodology, combined with the fact that no funds in our sample have been discontinued, likely creates an additional level of survivorship and add-in biases beyond those present in any manager universe.
Making Sense of the DGF Market
DGFs may share a common fundamental goal, but the underlying strategies they pursue and the resulting composition of their portfolios are highly diverse. DGFs’ wide range of portfolio construction options makes it increasingly challenging for trustees to compare fund offerings and know what they are buying. Despite DGFs’ heterogeneity, we find that most funds can be classified into one of two types: traditional and absolute return. The strategy and portfolio construction approach used by each group are different and result in distinct risk/expected return profiles.
Traditional DGFs
Traditional DGFs have more straightforward strategies that rely largely on directional market exposures. These strategies tend to have long-term strategic asset allocation targets with moderate ranges around those targets to facilitate tactical positioning. Strategic adjustments and tactical positioning provide some flexibility, but the majority of risk and return in traditional DGFs is driven by market betas (i.e., sensitivity to broad-based market movements). Leverage is typically limited or prohibited, as are short positions.
In many ways, traditional DGFs resemble a mix of the original balanced fund concept and GTAA strategies. Traditional DGFs have more scope for dynamic asset allocation than static balanced funds, but are generally less dynamic than GTAA funds. As such, traditional DGFs are simply an evolution of well-established investment strategies used by pension schemes for many years. We have classified the vast majority (74%) of the funds in our analysis as traditional DGFs, with over £40 billion in AUM.
Absolute Return DGFs
Unlike traditional DGFs, absolute return strategies focus primarily on relative value to generate returns. For example, an absolute return fund might go long German equity and short Swiss equity to capture the relative performance of these positions irrespective of broader equity market movements. Often, such funds will allocate capital to tens of such positions in the portfolio with the hope of generating positive returns. Leverage and shorting are integral to these strategies, which are often implemented using derivatives. By diversifying risk across a range of active bets with limited embedded sensitivity to overall market direction, absolute return DGFs seek to generate returns that are less sensitive to overall stock and bond markets.
While absolute return funds are less straightforward than their traditional peers, the strategies they pursue are not new. Similar strategies are often associated with global macro hedge funds, although these hedge funds are typically less diversified and less liquid than absolute return DGFs. Our analysis includes ten funds identified as absolute return. This is only about a quarter of the funds in our universe, but an outsized portion of the AUM (£112 billion, or about 74% of the total AUM).
Portfolio Construction and Risk/Return Implications
Identifying DGFs as primarily traditional or absolute return strategies can help trustees analyse each fund’s portfolio construction and set appropriate risk/return expectations across different market environments.
Figure 3 shows a number of elements of strategy design that may differ across traditional and absolute return funds. Some elements, such as the use of a broad set of asset classes, are a universal feature of DGFs regardless of type. However, clear differences exist between traditional and absolute return DGFs with regard to other elements such as directionality (sensitivity to market betas), leverage, and potential alpha sources, all of which have important implications for trustees. For example, absolute return DGFs’ emphasis on relative value and limited reliance on directional market exposures typically result in low equity beta. In the three years ending 31 March 2015, absolute return DGFs realised an average equity beta of approximately 0.3 (based on six funds with a range of equity beta between 0.04 and 0.47), whereas traditional funds on average experienced a beta closer to 0.5 (based on 20 funds with a range of equity beta between 0.30 and 0.72). Understanding this distinction can guide trustees’ decisions by clarifying the pattern of performance they should expect from a particular DGF product.
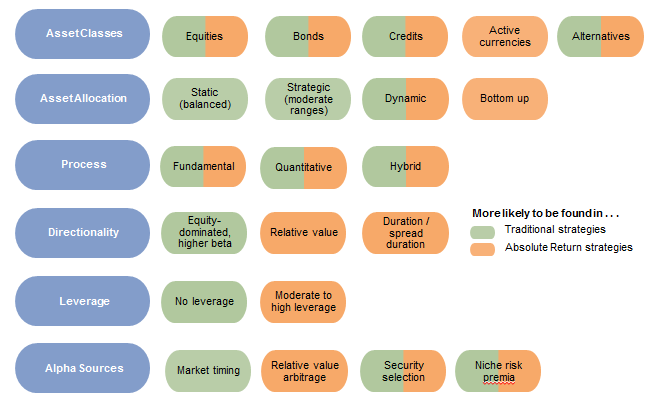
Figure 3. Traditional versus Absolute Return DGFs
Source: Cambridge Associates LLC.
Notes: The list of portfolio construction factors is meant to be illustrative and is not an exhaustive list of all DGF portfolio construction tools. The factors coloured both green and orange are common to both traditional and absolute return strategies.
Performance Analysis
DGF Performance Has Been Mixed
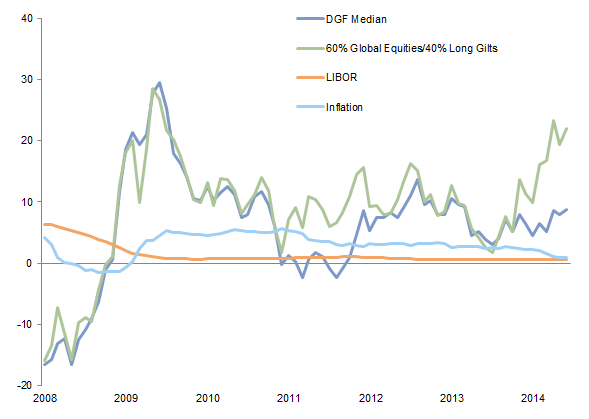
The goal of delivering equity-like returns with less volatility is conceptually appealing, but have DGFs achieved their investment objectives? Figure 4 presents the performance of the median DGF manager in our universe relative to LIBOR and UK inflation (two common reference points for managers, as explained in the sidebar below) as well as a simple 60/40 stock/bond portfolio, which represents an investable benchmark for performance evaluation and has tracked DGFs’ performance relatively well.[1] Performance begins 31 October 2007, when our universe had ten managers with returns. Median manager performance is calculated based on the median of available fund returns in each month. DGF returns are comfortably ahead of LIBOR and inflation from 31 October 2007 to 31 March 2015, but then so are the returns on most assets in an environment of ever-supportive central banks. More instructive is the fact that the median DGF manager lagged a simple 60/40 portfolio by nearly 330 bps per annum over this period, and lagged a 60/40 portfolio on a risk-adjusted basis as well (Sharpe ratio of 0.72 for a 60/40 portfolio versus 0.57 for the median DGF). DGFs’ underperformance was primarily due to capturing less upside during the market rally since 2012. While simple passive portfolios have topped many diversified strategies in the recent bull market, DGFs did not meaningfully outperform a 60/40 portfolio during the 2008 financial crisis either. Significant performance dispersion exists among individual DGFs, but their returns as a group have not been impressive.
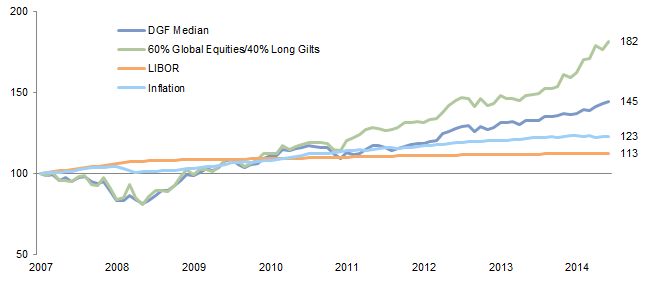
Figure 4. DGF Cumulative Performance
31 October 2007 – 31 March 2015 • GBP
Sources: Cambridge Associates LLC, FTSE International Limited, MSCI Inc., and Thomson Reuters Datastream. MSCI data provided “as is” without any express or implied warranties.
Notes: All returns are based on monthly data in GBP. DGF returns are net of fees. Data are rebased to £100 as of 31 October 2007, when our DGF manager universe first reached ten funds. DGF manager returns are added to the universe as they become available; at 31 March 2015 the return includes 35 funds. The 60/40 portfolio is rebalanced monthly. Global equities are represented by MSCI ACWI (Net), long gilts by the FTSE® British Government Over 15 Years Index, LIBOR by three-month GBP LIBOR, and inflation by UK RPI.
LIBOR+ and Inflation+ Targets Are Goals, Not Benchmarks
Most DGF managers use absolute return objectives (e.g., LIBOR+5%), typically targeting 3%–6% excess return over LIBOR or inflation. While these targets may reflect DGFs’ long-term goals and help with marketing, they are clearly not representative of DGFs’ economic exposures. As the figure below shows, DGF returns exhibit considerable variability around the relatively smooth LIBOR and inflation targets. On the other hand, a simple 60/40 stock/bond portfolio has tracked DGF performance relatively well and offers an investable benchmark for on-going performance evaluation.
Annual DGF Performance versus Benchmarks
31 October 2007–31 March 2015 • Rolling 1-Yr Return (%)
Sources: Cambridge Associates LLC, FTSE International Limited, MSCI Inc., and Thomson Reuters Datastream. MSCI data provided “as is” and without any express or implied warranties.
Notes: All returns are based on monthly data in GBP. DGF returns are net of fees. Data begin 31 October 2007, when our DGF manager universe first reached ten funds. DGF manager returns are added to the universe as they become available; at 31 March 2015 the performance universe includes 35 funds. Global equities are represented by MSCI ACWI (Net), long gilts by the FTSE® British Government Over 15 Years Index, LIBOR by three-month GBP LIBOR, and inflation by UK RPI.
Use of absolute return targets introduces other issues worth highlighting. First, the theoretically close relationship between LIBOR and inflation merits scrutiny in the current low interest rate environment. While most investors expect LIBOR to earn a small but positive real return over the long term, inflation has exceeded LIBOR for the past five years. The current negative real rate scenario makes it more difficult for DGFs with inflation-based targets to meet their goals and easier for funds with LIBOR-based targets.
In addition to setting a LIBOR+ or inflation+ return objective, many DGFs set a fixed volatility target or range, or aim for a certain percentage of equity volatility. When viewed in absolute terms, the implied risk-adjusted return objectives set by DGFs are quite ambitious and show little coherence, further underscoring the heterogeneity of these funds, as shown in the figure below. For example, four DGFs in our sample target their volatility at two-thirds that of equities, but all four have different return goals. Trustees must gain comfort with each fund’s risk/return goals, both on a standalone basis and relative to peers.
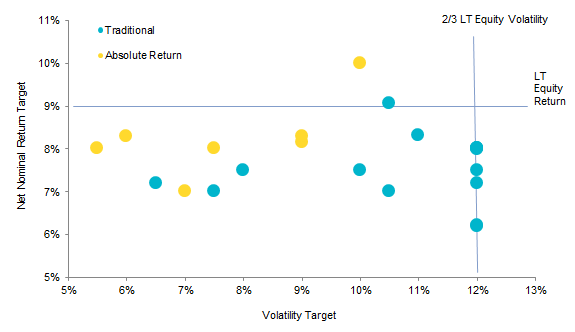
DGF Long-Term Risk/Return Targets
Net Nominal Return Target
Source: Cambridge Associates LLC.
Notes: Based on data provided by 23 DGF managers with fixed return targets and explicit volatility expectations. Some DGFs have overlapping risk/return objectives, so not all data points are visible on the graph. The net nominal return target assumes a normalised environment with a 4% nominal cash return and 3% inflation. The volatility target assumes a long-term global equity volatility of 18%, based on Cambridge Associates’ long-term equilibrium asset class assumptions. The LT Equity Return of 9% is also based on Cambridge Associates’ long-term equilibrium asset class assumptions.
Given these issues with absolute return targets based on LIBOR or inflation, trustees may want to benchmark medium-term DGF performance against a simple 60/40 portfolio (or similar risk-equivalent, investable benchmark). Comparisons with LIBOR+ and inflation+ targets should be reserved for long-term strategic reviews based on at least five years of data across a full market cycle.
Historical performance analysis on the DGF market is constrained by the limited sample set. As discussed, the DGF market is growing rapidly but remains relatively young. Of the 35 funds with assets over £30 million in our DGF universe, only 19 existed five years ago, and only four existed ten years ago. Performance over periods longer than the past five years is therefore driven by a small cadre of funds in a less competitive market than fund managers have faced in recent years.
We also compared the performance of traditional and absolute return DGFs over the past five years (the longest period with a sufficient sample set for both sub-groups, though we would caution that the number of funds in the absolute return grouping remains low, including fewer than five funds for the first 18 months of this analysis). As Figure 5 shows, traditional and absolute return funds have delivered similar total returns over this period, but absolute return strategies have captured less equity upside and downside than traditional funds. For schemes seeking to diversify away from equities, evaluating DGFs’ performance during positive and negative periods for equity markets is crucial, and difficult to do given most funds’ recent inception dates. Acknowledging the limited sample set, our analysis suggests that absolute return DGFs are more likely to diversify equity-biased portfolios and zig when equity markets zag.
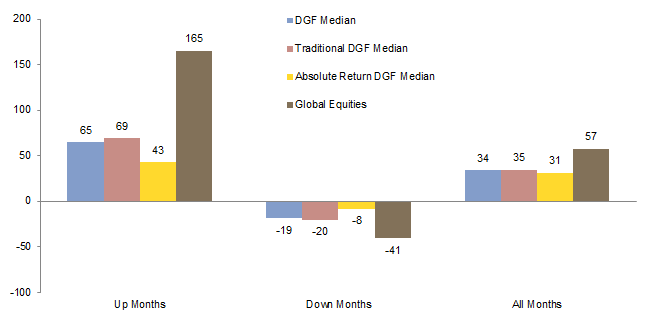
Figure 5. Performance in Up/Down Equity Markets
31 March 2010 – 31 March 2015 • Cumulative Performance (%)
Sources: Cambridge Associates LLC and MSCI Inc. MSCI data provided “as is” without any express or implied warranties.
Notes: All returns are based on monthly data in GBP. DGF returns are net of fees. Global equities are represented by MSCI ACWI (Net). Up/down market performance reflects cumulative performance during up and down months for the MSCI ACWI (Net). Traditional DGF and Absolute Return DGF are subsets of our DGF universe. DGF manager returns are added to the universe as they become available; at 31 March 2010 the universe included 19 funds, with 16 traditional and three absolute return. As at 31 March 2015, the performance universe included 35 funds, with 26 traditional and nine absolute return.
The market environment and level of expected return across asset classes can also impact whether traditional or absolute return DGFs are more likely to outperform. In the current market environment where many asset classes are overvalued, traditional DGFs with a focus on directional market returns will likely find it more difficult to achieve their performance objectives than absolute return funds. Figure 6 shows that the current “return-to-normal” expectations—which account for current market valuations—are lower than our long-term equilibrium expected returns.[2]In our return-to-normal scenario, we incorporate current valuations and assume equity valuations revert to fair value over ten years. This scenario makes assumptions about the market environment … Continue reading However, absolute return DGFs do have opportunities to implement relative value strategies, as the dispersion between asset class forecasts (i.e., the slope of the capital market line) is relatively high today. Trustees should consider whether the capital market environment favours one type of DGF when implementing an allocation.
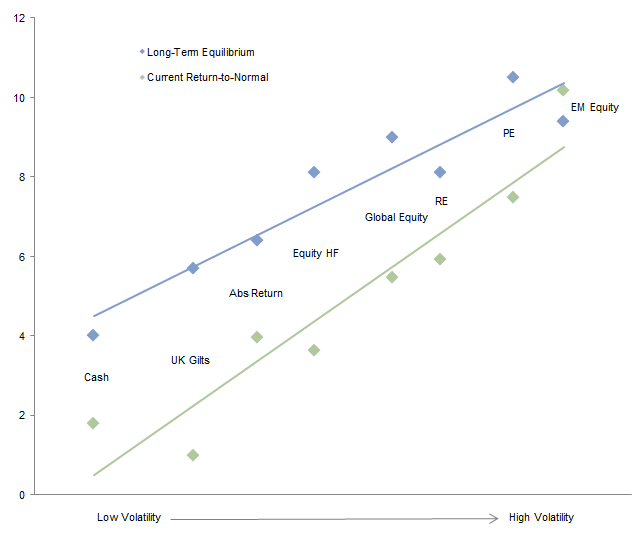
Figure 6. Capital Market Line—Equilibrium and Return-to-Normal
Nominal Compound Return (%)
Source: Cambridge Associates LLC.
Notes: Long-term equilibrium asset class assumptions are based on analysis across multiple market cycles and are not reflective of any particular market environment. The current return-to-normal asset class assumptions are based on market valuations as at 31 March 2015 and assume that each asset class reverts to long-term fair value over ten years.
Manager Selection Is Key
Mixed DGF performance makes selecting the right DGF manager essential. Figure 7 shows that the performance dispersion across DGFs has been significant, especially over shorter time periods. For example, over the one-year period ending 31 March 2015, the top performing DGF returned over 26 ppts more than the worst performer. Dispersion naturally shrinks over longer time periods, as evidenced by the 110 bps per annum spread between the returns of DGFs in the 75th and 25th percentile over the past five years. Nonetheless, even a moderate return differential between DGF managers can be impactful in the low absolute return environment trustees face today. Moreover, as DGF product proliferation continues, identifying the DGFs best suited for the intended role in the portfolio will be a critical task for trustees.

Figure 7. DGF Manager Performance Dispersion
As at 31 March 2015 • Net Annualised Return (%)
Source: Cambridge Associates LLC Investment Manager Database.
Notes: For the three time periods examined, DGF managers’ annualised returns are divided into quartiles. All returns are in GBP and net of fees.
Role in the Portfolio
Pension schemes can incorporate DGFs in their portfolios in a variety of ways, but three have proven most popular: growth portfolio replacement, dynamic growth core, and liquid diversifier. For schemes with sufficient scale to maintain a robust portfolio of growth strategies, the liquid diversifier role may be the most appropriate use of DGFs, as it diversifies equity exposures and facilitates rebalancing within alternative asset allocations. We discuss the pros and cons of each potential DGF role below.
Growth Portfolio Replacement
As a growth portfolio replacement, DGFs serve as the scheme’s entire growth portfolio. In this substantial role, DGFs often represent a large percentage of the scheme’s total assets, and trustees frequently diversify the allocation across two or three DGFs to reduce manager-specific risk.
The primary benefits of replacing the entire growth portfolio with one or more DGFs are to reduce the governance burden on trustees and simplify the portfolio. By providing diversified multi-asset exposure in one packaged fund, DGFs can ease trustees’ governance burden relative to overseeing a multi-manager growth portfolio of asset class specialists. This simplification is most beneficial to very small schemes with limited resources that choose not to outsource portfolio management responsibilities to a fiduciary manager.
While the growth portfolio replacement role offers a simple solution for small schemes, there are some drawbacks. First, replacing the entire growth portfolio with DGFs constrains the investment opportunity set, particularly with regard to illiquid assets. DGFs’ ability to allocate to illiquid private equity or property strategies is severely limited because most DGFs offer daily liquidity to investors. By using DGFs as a growth portfolio replacement, schemes forego the opportunity to capture the illiquidity premium through private investments and enhance returns. Second, the growth portfolio replacement role also constrains schemes’ potential alpha sources to the DGF managers selected. A DGF manager may be strong in one or two areas but is unlikely to generate as much alpha across the entire growth portfolio as a bespoke combination of asset class specialists. We recommend trustees carefully weigh the trade-off between simplicity and alpha potential before using DGFs as a growth portfolio replacement.
Dynamic Growth Core
Rather than replacing the whole growth portfolio with DGFs, a scheme can retain strategic allocations to equities and other growth assets, and then use one or more DGFs as a dynamic growth core. In this role, DGFs represent a meaningful percentage of the growth portfolio and complement static allocations to other growth assets (typically equities, credits, and alternatives). The overall growth portfolio’s exposures are determined by how the DGF is tactically positioned.
Figure 8 presents an example of how a dynamic growth core allocation works. In this example, strategic allocations to equities and alternatives are held constant, and the DGF manager’s dynamic positioning determines the total growth portfolio’s exposures. For instance, the overall growth portfolio favours equities when the DGF is positioned aggressively but tilts toward bonds and alternatives when the DGF manager is more defensive.
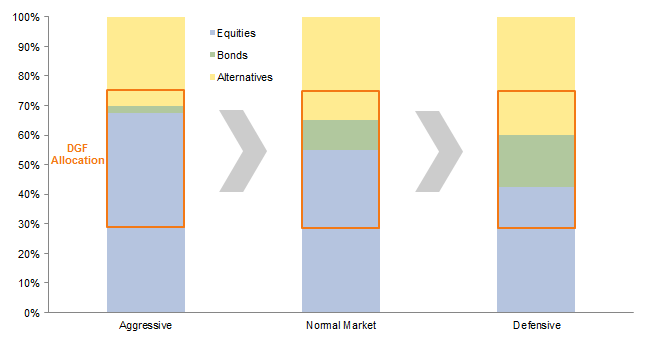
Figure 8. Dynamic Growth Core Example
Growth Portfolio Composition
Source: Cambridge Associates LLC.
Note: This example is for illustrative purposes only.
The dynamic growth core approach offers a compromise between simplicity and the pursuit of alpha. Trustees retain the ability to hire high conviction active managers within the static equity and alternatives allocations, but “outsource” the complexity of dynamic asset allocation decisions to the DGF manager. The main drawback of this approach is that the implied asset allocation resulting from the actions of the DGF manager will not acknowledge the particular circumstances of the scheme. It is a non-customised and imperfect solution to the challenge of outsourcing asset allocation to specialised asset managers. Moreover, such a role for a DGF often necessitates the use of a single manager, which increases specific manager risk.
Liquid Diversifier
As liquid diversifiers, DGFs provide an alternative risk/return profile that can complement a scheme’s existing growth portfolio. In this role, DGFs typically represent a smaller percentage of total assets and are often used alongside or instead of other alternative investments.
DGFs can be attractive liquid diversifiers for multiple reasons. First, DGFs’ liquidity enables trustees to rebalance the growth portfolio quickly. This liquidity is particularly valuable when DGFs are used alongside less liquid alternative assets such as hedge funds, whose allocations take more time to adjust. In addition, DGFs can be effective liquid diversifiers for schemes that have a significant equity allocation but are too small to build a robust portfolio of alternative assets. For these schemes, DGFs can provide much needed equity diversification without requiring trustees to allocate more to bonds and sacrifice excess return potential.
The liquid diversifier role relies heavily on DGFs’ ability to diversify equity-biased growth portfolios. Absolute return DGFs’ lower equity beta makes these strategies particularly attractive for trustees seeking such diversification. However, absolute return DGFs are more complex than their traditional counterparts and incorporate leverage in their strategies (primarily for hedging), which may not be appealing to all schemes. For trustees that are comfortable with this approach, carefully selected absolute return DGFs can feature nicely alongside a portfolio of high conviction asset class specialists.
Implementation Considerations
DGF managers can implement their fund in a number of ways, and trustees should be aware of how a manager plans to position itself when selecting and monitoring funds. Dimensions of fund decision-making to evaluate include whether the DGF will invest in active or passive strategies, gain exposure through physical or synthetic instruments, and allocate to internally or externally managed funds.
Active versus Passive
DGFs can implement positions with passive vehicles that simply provide market exposure or with active strategies that aim to outperform market indices. Passive vehicles are typically preferred in highly efficient markets such as large-cap UK equities. DGFs often invest passively to gain exposure to a market’s beta, which is the main driver of returns in highly efficient markets.
DGFs can also allocate to active strategies that seek to generate excess returns through skilled security selection, as well as through sector and geographical positioning. Active investments are often favoured in less efficient markets, such as emerging markets equities. Certain strategies, such as long/short equity, are inherently active by nature.
Physical versus Synthetic
DGFs can implement positions with physical securities or by synthetically using derivatives (primarily futures, swaps, and options). This decision is driven by the objectives of each investment strategy, the instruments available to express that strategy, and the relative valuation of the available instruments.
Synthetic implementation is more capital efficient and therefore provides DGFs greater flexibility to apply leverage. As a result, absolute return strategies that routinely employ leverage often use synthetic instruments. One constraining factor to synthetic investing is that a deep derivatives market does not exist for all asset classes. For example, many DGFs invest in physical inflation-linked bonds because synthetic alternatives are limited. Similarly, physical securities may be preferred in certain emerging markets given the lack of appropriate derivatives.
Relative valuation and cost effectiveness are also critical factors and can vary over time; e.g., the relative yield of physical gilts and gilt-based swaps fluctuates, enabling investors to pick up some extra yield by implementing their duration exposure with the more attractively valued instrument. Transaction costs and market liquidity are evaluated alongside relative valuation. Collectively, these factors help DGF managers identify the most attractive instrument suited to their needs.
Internal versus External
DGFs must also decide whether to implement strategies internally or outsource them to externally managed funds. If implemented internally, the DGF team can purchase securities directly or allocate to an internal fund managed by another team within the organisation. Most DGFs employ a combination of direct security investments and internally managed funds, although many allocate to external funds as well.
DGF managers typically invest in internally managed funds when they believe their organisation has a strong track record in a certain strategy. For example, if an investment manager has a successful property fund, the DGF’s property allocation may be invested through that fund.
DGFs invest in external funds when they do not have the requisite asset class expertise internally, or when they believe external managers can add significant value relative to the internal options available. For example, DGF managers often allocate alternative asset exposures to specialist external managers. Investing in external funds requires DGF managers to have professional resources for due diligence and monitoring. DGF managers may also be constrained in their access to top external managers, as external managers may balk at providing full portfolio transparency to a competing investment management firm. External funds can also impact the total expenses incurred by DGF investors.
Conclusion
DGFs have garnered significant attention and assets—particularly amongst UK defined benefit pension schemes—as a less volatile source of long-term growth. DGFs can be valuable tools for pension portfolio management, but only if trustees understand what they are buying and how it fits into the context of the total portfolio. The simple bifurcation of the available products into traditional and absolute return strategies can be a starting point for trustees to help make sense of the market and set appropriate risk/return expectations across different market environments.
In aggregate, DGFs’ track record is short and mixed. While the median DGF manager has outpaced LIBOR and inflation, its performance has lagged a simple 60/40 stock/bond benchmark over the past five years. That said, significant dispersion exists across DGF managers’ returns, highlighting the importance of rigorous manager selection. DGFs can fulfil different roles in the portfolio, the attractiveness of which depends on each scheme’s size, resource constraints, governance structure, and investment objectives.
A large part of DGFs’ appeal is simplified governance, although other benefits such as scalable access to diversified risk premia and low explicit costs are also cited. However, DGFs’ long-term success will likely hinge on whether they can deliver on their stated risk-adjusted return objectives rather than on factors of convenience.
Index Disclosures
Broad-based securities indices are unmanaged and are not subject to fees and expenses typically associated with managed accounts or investment funds Investments cannot be made directly in an index. Past performance is no guarantee of future results.
FTSE® British Government Over 15 Years Index
The index consists of securities with over 15-year maturity from the Conventional index family of the FTSE® Actuaries UK Gilts Index Series, which includes all British Government Securities quoted on the London Stock Exchange. Undated gilts are excluded. Accrued interest is based on T+1 settlement.
MSCI All Country World Index (ACWI) (Net)
MSCI ACWI captures large- and mid-cap representation across 23 developed markets and 23 emerging markets countries. With 2,478 constituents, the index covers approximately 85% of the global investable equity opportunity set. The net index provider returns net of dividend taxes.
Three-month GBP LIBOR
The three-month British pound sterling (GBP) LIBOR interest rate is the average interest rate at which a selection of banks in London are prepared to lend to one another in British pounds with a maturity of three months.
UK Retail Price Index (RPI)
The RPI is a measure of the price of goods and services in the United Kingdom. It shows the changes in the cost of living and reflects the movement of prices in a range of goods and services used regularly, such as food, heating, housing, household goods, bus fares, and petrol.
Alex Koriath, Head of UK Pension Practice
Himanshu Chaturvedi, Senior Investment Director
Max Gelb, Associate Investment Director
Footnotes