I’ve been in this industry for 20 years. This is the best time to raise money ever. It might be the best time for any kind of business in any industry to raise money for all of history, like since the time of the ancient Egyptians. It’s certainly the best time for late-stage start-ups to raise money from venture capitalists since this dynamic has been around.
—Stewart Butterfield, CEO, Slack, April 16, 2015
Venture capital offers compelling returns for the stalwart long-term investor. At the moment, however, regardless if you are a stalwart or a recent convert to the strategy, it sure appears the US venture capital market is in another bubble. Later-stage pre-money valuations have achieved escape velocity from their long-term trendline, profitless initial public offerings (IPOs) are making a comeback, and the number of “unicorns”—startups with a valuation of $1 billion or more—has exploded (not to mention the new category of “decacorns,”[1]Companies valued at $1 billion were originally called unicorns to denote their status as “magical and rare”; decacorn, according to the Bloomberg writers who recently coined the term, is “a … Continue reading those valued at more than $10 billion). Unicorn valuations have, in many cases, increased to the point where going public is the only option, because few companies could or would acquire them at going rates.
On the other hand, some in the industry argue what looks like a bubble is simply a rational and reasonable pattern of actions by certain investors trying to lock in more returns before these venture-backed companies go public. Indeed, valuation excesses seem largely confined to later-stage investments, and over the past couple of years the IPO window has been letting in a relatively steady breeze of venture-backed IPOs.
Regardless of whether later-stage venture capital is in a bubble, the most relevant question for investors in any stage of venture is the potential impact of prevailing market conditions on ultimate returns. In this brief, we look at valuation data today and also use our proprietary data set of funds to review historical returns during periods when valuations reset.
For all the investment interest unicorns have driven toward venture capital, albeit primarily at the later stages, we would caution gawkers: venture capital is a long-term asset class that requires commitment and fortitude over a long period of time, easily ten years or more, to recognize the return benefits, which can be substantial. The pursuit of compelling returns is what is propelling capital into the strategy. For those just warming up to get invested in the strategy, buckle your seatbelt, because it is going to be a long and bumpy ride.
Last Call for Late Stage
Later-stage valuations are indeed worrisome, and to some extent are raising valuations at all stages, with the lower registers least affected but still afflicted.
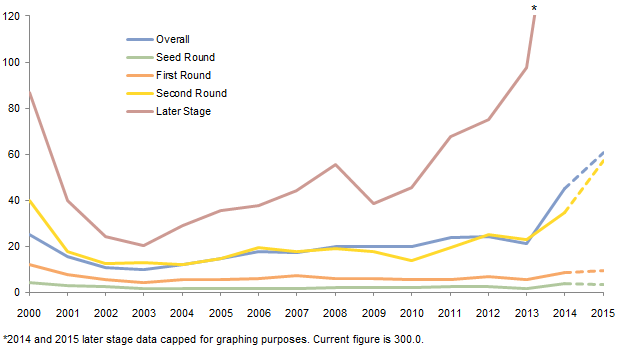
Median Pre-Money Valuations by Stage
1999–2015 • US$ (millions)
Notes: Data for 2015 are through September 30. Dashed lines indicate year-to-date figures.
Many actors are complicit in the current valuation situation: investors eager to participate in pre-IPO rounds to capture implied returns, entrepreneurs wanting to keep up with peers seeking these valuations, and earlier-round venture capitalists that can mark the valuation of their investment to market and reflect that unrealized gain in performance. Given the length of time it typically takes for a venture investment to come to fruition, much can change and the actual value realized by LPs will ultimately reflect prevailing market conditions at the time of sale, which may be vastly different and removed from today.
While we fully expect some investors in the current crop of unicorns to suffer their share of disappointments, it is important to not let this distract from the overall message: one of the underappreciated facts of venture capital—despite a great deal of lip service paid to it—is the long-term commitment required from LPs to truly benefit from investing in this strategy. Indeed, many of the success stories on investors’ lips at the moment were years in the making, initially funded during venture capital’s “lost years” between the last tech wreck and the current run. Investors from that era, often maintaining exposure through thick and thin, reaped the greatest benefit. They invested well ahead of the pack precisely because they understood the long-term nature of the strategy.
Mind the Gap
Although it is not true, as many assume, that it is necessary to get into legacy funds to which few investors can gain access. For more details please see Theresa Sorrentino Hajer et al., “Venture Capital Disrupts Itself: Breaking the Concentration Curse,” Cambridge Associates Research Note, November 2015.
Consider the figure below, which shows the remarkable fact that for virtually all vintage years since the late 1990s bubble, venture capital funds collectively have yet to even return cost back to their LPs. (Of course this is not the case on a fund-by-fund basis, which gets to the importance of manager selection.)
The figure depicts three different venture capital fund performance measurement metrics:
- Net internal rate of return (IRR)—the annualized effective rate of return earned on the net to LP cash flows and ending net asset value.
- Distributions to paid-in capital (DPI)—capital returned divided by the capital paid in. This multiple represents what has been realized.
- Total value to paid-in capital (TVPI)—the sum of capital distributions and the remaining value, divided by the capital paid in. This multiple represents what has been realized and what value remains (or is unrealized).
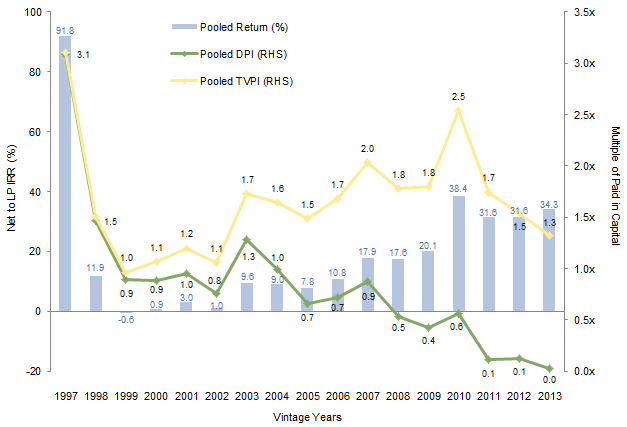
US Venture Capital: Net Pooled IRRs and Fund Multiples by Vintage Year
As of June 30, 2015
Source: Cambridge Associates LLC.
Notes: Based on data compiled from 1,101 US venture capital funds, including fully liquidated partnerships, formed between 1997 and 2013. Internal rates of return are net of fees, expenses, and carried interest. CA research shows that most funds take at least six years to settle into their final quartile ranking, and previous to this settling they typically rank in 2–3 other quartiles; therefore fund or benchmark performance metrics from more recent vintage years may be less meaningful.
What becomes clear upon examination is the current valuation environment has had the greatest impact on unrealized valuations, creating a sizable gap between DPI and TVPI, while supporting strong net IRRs. As shown, TVPI has been well above 1.0x[2]A value of 1 means a net return of zero; a value of 2 would be a 100% (i.e., 2x) return. since 2000, while DPI, a much more important metric from an investor’s standpoint, remains consistently below that level. In fact, while we show DPI at or above 1.0x for 2003 and 2004, the median DPIs for those vintages were 0.6x and 0.5x, respectively. Further, the median net IRR from the 2003 vintage is currently a meager 2.3%, and 2004 is even lower at 2.0%.
Since a DPI below 1 means investors for a given vintage year have not yet received capital back as a cohort—to say nothing of returns on that capital—how in the world can IRRs look so good? The answer, of course, is that much of this value sits in the unrealized valuation category. Therefore the question is not whether the gap between DPI and TVPI will close (spoiler alert: it will), or when, but how. Investors should have a point of view on which direction unrealized valuations will move as they become realized, and manage expectations accordingly.
Watch Out for Potholes on the Road to Returns
To provide some perspective on what potholes in the road may be lurking for investors, we revisited the performance of US venture capital funds when valuations reset. From 2000 to 2003, vintage year valuations had observable declines, as calculated by percent change in TVPI, with cumulative declines in value over the 2000–02 period reaching 69% and 61% for the most impacted 1998 and 1999 vintage years, respectively. From 2002 to 2003, the percent change in TVPI returned to positive growth, five years after valuations were significantly impacted.
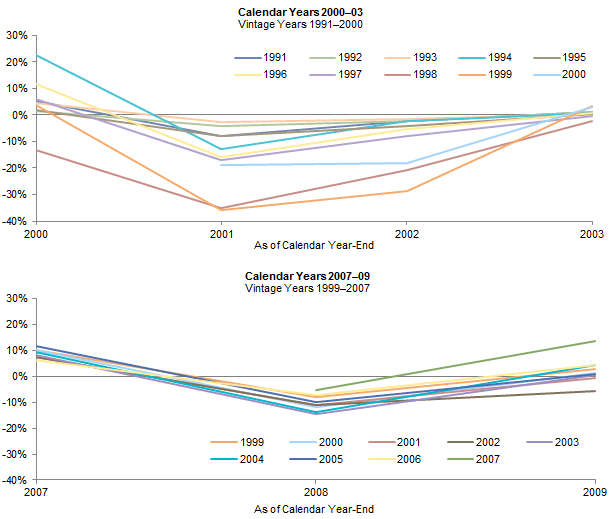
US Venture Capital: Year-Over-Year Percentage Change in Pooled Net to Limited Partners’ TVPI Multiple
As of June 30, 2015
Source: Cambridge Associates LLC.
Notes: Pooled total value to paid in capital multiples are net of fees, expenses and carried interest.
A closer look at performance of the strategy in the global financial crisis indicates a less severe experience for venture capital. Valuations were impacted across all vintage years shown (1999–2007), but averaged a 10% decline in 2008 before largely resuming an upward trajectory.
Pre-IPO Doesn’t Necessarily Mean There Will “Be-IPO”
The rising tide of late-stage valuations is lifting all boats to some extent, as discussed earlier, and is keying off eventual expected public exits. Most venture capital managers we meet have at least one company that is “going IPO.” When you look at the sheer volume of what would have to go public—successfully, mind you—to achieve those valuations, we consider it highly unlikely a significant percentage of owners could monetize their investments on a timely basis at prevailing rates. Broadly speaking, later-stage investors are taking a remarkable leap of faith that exit markets will open up to a degree never before witnessed.
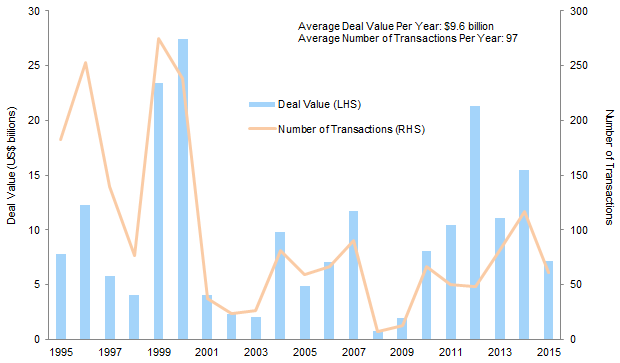
US Venture Capital–Backed IPOs
1995–2015
Source: Thomson Reuters.
Notes: Data for 2015 as of September 30. Average figures through 2014.
Consider that there are currently over 8,800 unrealized venture capital investments, with more than 100 unicorns. Since 1995, the average number of venture-backed IPOs per year has been 97, with annual realized value of $9.6 billion. But excluding the late 1990s bubble, 2001–14 averaged just 55 IPOs a year, with average annual realized value of $7.9 billion. Compare those averages to unicorns sitting on, by some estimates, more than $500 billion of unrealized value. Further, while the most robust exits in venture capital have been achieved via public exit, it remains the case that the vast majority of venture capital investments will be realized via merger & acquisition, a challenging prospect for the current crop of unicorns, many of which are currently sitting at valuation levels that largely rule out this possibility.
Such a Good Deal They’ll Buy It Twice?
While some have drawn comfort from the fact that the surge in late-stage investing and valuation represents a shift from IPOs—e.g., investors that would previously have bought IPOs are now funding later-stage private deals—we do not view this as reassuring, not least because these investors may not be natural long-term owners of illiquid equity, which can influence their behavior. In fact, given that many private investors tend to—and should—demand extra return for the illiquidity, the ballooning late-stage market strikes us as a serious problem. If investors that traditionally played only or mainly in public markets are increasingly buying in the private markets, who is left to eventually buy the public shares? That said, as with most things, relative “goodness” depends on your perspective. Regardless of the investment merits of unicorns and other later-stage companies, early-stage investors stand to benefit, as the positive stories surrounding such companies, as well as the paucity of “growth” options in global asset markets, mean late stage will likely continue to attract capital (whether from existing investors, new entrants, or both).
The Bottom Line: The Early (Stage) Bird Gets the Return
Venture capital is a strategy that yields differentiated returns to investors over a long period of time. The best way to access these returns is to be a long-term investor in the space, building exposure over time (easily a five- to seven-year period, if not longer), and in earlier-stage strategies supporting companies at their nascency—true start-ups. Earlier-stage investments have greater exit options, including selling to their later-stage siblings, at a wider range of acceptable valuations, to achieve a compelling return.
Please see Theresa Sorrentino Hajer et al., “Venture Capital Disrupts Itself: Breaking the Concentration Curse,” Cambridge Associates Research Note, November 2015
All things considered, we would not shy away from exposure to venture capital at present, but would concentrate efforts on earlier-stage funds. Further, as our recent research has shown, from 2000 to 2012, 40% to 70% of the funds producing the top gains in any year were new and emerging managers, most of which focus on early-stage investments. Long-term investors know the current gap between unrealized and realized will take a while to close and that the path may have some bumps along the way, but maintain exposure and diversity within their venture capital program in pursuit of the distinctive returns of the strategy.
Andrea Auerbach, Managing Director
Eric Winig, Managing Director
Alexandra Meyer, Senior Investment Associate
Christine Trang, Manager, Analytics
Footnotes