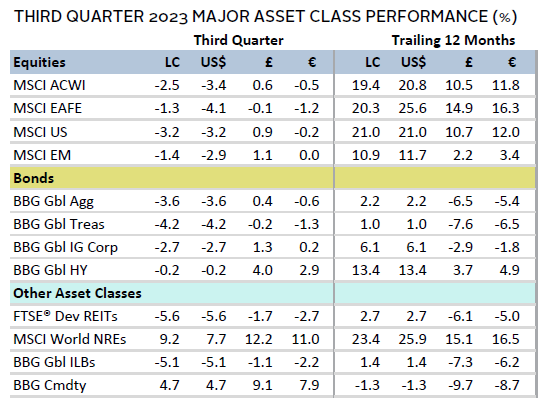
Risk assets generally declined in Q3 as rising bond yields pressured fixed income and equity performance alike. Within equities, information technology and bond proxy sectors such as utilities and real estate declined the most, whereas higher oil prices led to sharp gains for energy stocks. Developed markets (DM) lagged emerging markets (EM) for the first time in five quarters, while value topped growth and small caps edged large caps. Bond markets sold off broadly, as US Treasury yields hit 16-year highs. Real assets were mixed, highlighted by surging oil prices amid tight supply/demand conditions. A repricing of the US rate outlook contributed to broad US dollar appreciation, while the euro was mixed, and UK sterling softened.
Sources: Bloomberg Index Services Limited, Bloomberg L.P., EPRA, FTSE International Limited, MSCI Inc., National Association of Real Estate Investment Trusts, and Thomson Reuters Datastream. MSCI data provided “as is” without any express or implied warranties.
Note: Local currency returns for the Bloomberg fixed income indexes, the Bloomberg Commodity Index, and the FTSE® Developed REITs are in USD terms.
The Macro Picture
Surging bond yields came to dominate the market narrative in Q3, which tightened financial conditions. While several factors contributed, the rise was punctuated by investors repricing to the higher-for-longer central bank rhetoric delivered in September. Rate setters across major central banks generally signaled nearing an end to the hiking cycle but reiterated that a longer period of higher rates was needed to bring inflation down to target. For example, the Federal Reserve guided for one more 25–basis point (bp) rate hike this year and forecasted fewer rate cuts in 2024 than had been projected in June. The Fed also raised its economic outlook, as data have exceeded expectations. Investors balked at signs of wider budget deficits, highlighted by recent announcements in France and Italy, along with the US Treasury’s plans for increased issuances. The latter was a factor in Fitch’s US credit rating downgrade.
Economic fortunes diverged across geographies in Q3, although most regions saw a broad-based inflation moderation. Still, new risks to the outlook emerged late in the quarter. Chief among them was surging oil prices, which were up almost 30% and nearing the $100/barrel mark. While higher prices pose a headwind to growth—particularly for net energy importers—they also raise the prospect of higher headline inflation rates. US economic data outperformed that of other major regions, particularly in Europe and China, although Chinese data bounced back somewhat in September. Questions emerged regarding the potential impact on US growth from the auto workers’ strike, the resumption of student loan debt payments, and a potential government shutdown. In another divergence, several EM central banks cut policy rates in Q3, contrasting the messaging from most DM peers.
Equities
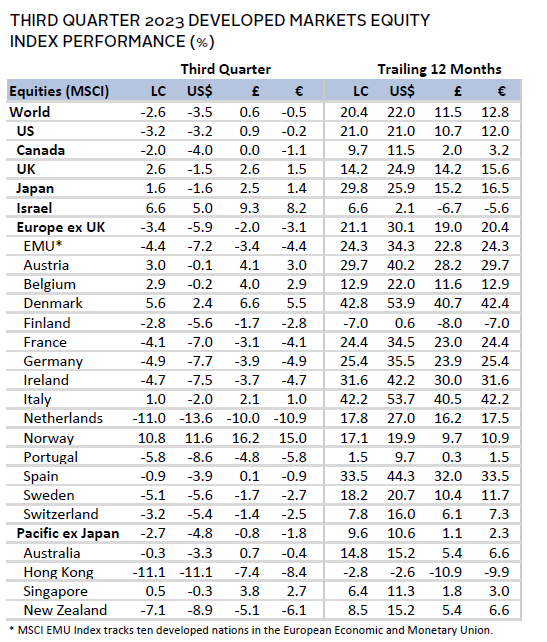
US equities lagged DM ex US peers in Q3 as a sharp repricing in US Treasury yields weighed on the tech-heavy market. However, US stocks outperformed in major currency terms as the factors driving yields higher also catalyzed US dollar strength. The information technology sector accounted for nearly half of the quarterly declines. In fact, just one stock (Apple) accounted for more than one-quarter of the losses, as Chinese officials banned the use of iPhones for government workers. But weak returns were broad as the equal-weighted index underperformed its cap-weighted counterpart. Real estate, utilities, and consumer staples fell the most among sectors, whereas energy surged on the upward move in oil prices. Value narrowly bested growth for the first quarter in 2023 but remains well behind year-to-date. Small caps trailed large caps for the ninth time in the past ten quarters.
Better-than-expected US economic data was the core factor underlying the macro environment. An index of US economic surprises rose to one of its highest levels in the past decade, outside the initial pandemic recovery, as the initial Q2 GDP growth estimate exceeded forecasts (2.4% versus 1.5% expected). GDP growth was revised down by 30 bps, as the final rate of consumer spending growth was less than half the initial estimate. This, combined with unexpected drops in consumer confidence during the quarter and looming risks of a further spending growth slowdown, weighed on sentiment. Still, GDP was buoyed by upward revisions to business investment, where durable goods ex transportation orders consistently outperformed expectations in Q3. Core inflation (ex food and energy) rates trended downwards to 4.3% year-over-year (YOY) in August, while rising oil prices lifted the headline rate to 3.7% YOY.
European equities bested broader DM shares. UK shares outperformed Europe ex UK counterparts for the first time in four quarters as peak Bank of England (BOE) rate expectations came down by more than 1 percentage point.
The European Central Bank (ECB) raised the deposit rate by 50 bps during the quarter against a weakening economic backdrop. September’s hike brought the policy rate to 4.00%, the highest level since the euro launched in the late 1990s. Eurozone economic data were generally weak in Q3, with PMI data suggesting economic growth contracted for four straight months through September, while GDP expanded just 0.1% quarter-over-quarter in Q2. Still, the ECB echoed the Fed’s playbook, signaling a potential end to the hiking cycle and a higher-for-longer approach. Preliminary data suggested core inflation softened more than expected to 4.5% YOY in September. However, the risk of a prolonged stagflationary environment appears to have increased, particularly as the euro has weakened and energy prices have climbed.
The BOE in September refrained from lifting rates above the current 5.25% level, as policy appeared to be impacting economic growth. GDP contracted more than expected month-on-month in July, preliminary PMI data suggested activity contracted for a second straight month in September, and core inflation cooled more than expected to 6.2% YOY in August. Within the PMI report, services activity hit a 32-month low. Further weighing on the outlook, broad UK money supply contracted for the first time in at least 13 years in August. UK wage growth outstripped inflation and hit new records in Q3. This suggested underlying pricing pressures remain present and contributed to a rebound in consumer confidence.
Japanese equities outperformed broader DM stocks in Q3, bolstered by the Bank of Japan’s (BOJ) ultra-easy monetary policy and negative interest rates. The outperformance margin narrowed in major currency terms, as widening rate differentials contributed to the yen’s 3.1% depreciation versus the US dollar, reaching one of its weakest levels in the last 30+ years. Despite above-target core inflation—with one measure holding at 4.3% YOY in August—the BOJ is not yet convinced that economic fundamentals support a sustained inflationary trend. Indeed, calendar Q2 GDP growth was downwardly revised to 4.8% annualized. Growth was driven entirely by external demand, as both household consumption and business investment declined more than initially estimated. In addition, wage growth slowed more than expected, leading to declining incomes in real terms. Other data pointed to aggregate demand outstripping supply in Q2 (the first time in nearly four years), suggesting that inflation may persist.
Pacific ex Japan equities nearly matched the broader DM index. Hong Kong was the primary detractor, entering a bear market as China’s headwinds weighed on performance. Australian equities were relatively flat, as GDP growth in Q2 topped expectations despite soft demand. Indeed, household consumption expanded just 0.1% on the quarter, while retail sales growth data released in Q3 were generally weak. PMI data recovered from contractionary territory according to the preliminary September release, but still suggested that growth stagnated. The Reserve Bank of Australia made no changes to policy during the quarter, as inflation eased more than expected. The Reserve Bank of New Zealand also held rates steady in Q3 but came out more hawkish as inflation and GDP growth topped expectations.
Sources: MSCI Inc. and Thomson Reuters Datastream. MSCI data provided “as is” without any express or implied warranties.
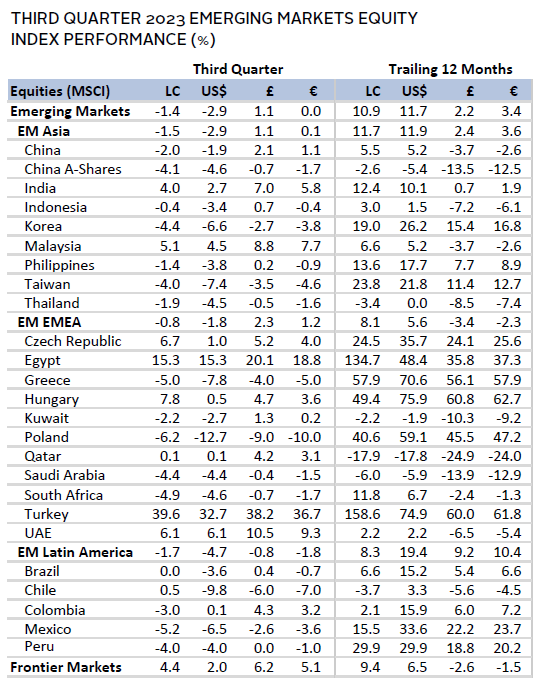
Emerging markets equities outperformed DM peers in Q3 for the first time in five quarters, as several EM central banks began cutting rates ahead of DM counterparts. All major EM regions declined, with Latin America and Asia narrowly lagging, while Europe, the Middle East & Africa outperformed. Indian equities buoyed the broader market and were the top contributor to returns, as economic growth topped expectations, inflation moderated more than expected in August, and PMI data pointed to a continued robust expansion. Turkey was the second largest contributor in Q3, as a return to more orthodox economic policies amid sky-high inflation has led to surging foreign and domestic stock market inflows. Brazil (-100 bps), Chile (-175 bps), and Poland (-75 bps) all cut policy rates during the quarter, but their underlying currencies generally underperformed, given the policy divergence vis-à-vis DM peers.
Chinese equities narrowly lagged the broader EM index but were still the largest detractor from performance given their size. Initial optimism around government economic support in July gave way to fears that stimulus efforts did not go far enough by August, amid a rapidly deteriorating economic backdrop. However, green shoots emerged in September, as retail sales, industrial output, and official PMI data all exceeded expectations, with the manufacturing sector returning to growth for the first time since March. In addition, the People’s Bank of China cut the required reserve ratio by 25 bps in September, the second such cut this calendar year. This move followed other actions, including interest rate cuts and targeted support measures to boost consumption and home purchases. Highlighting recent economic headwinds, the yuan fell to a 16-year low versus the US dollar.
Sources: MSCI Inc. and Thomson Reuters Datastream. MSCI data provided “as is” without any express or implied warranties.
Fixed Income
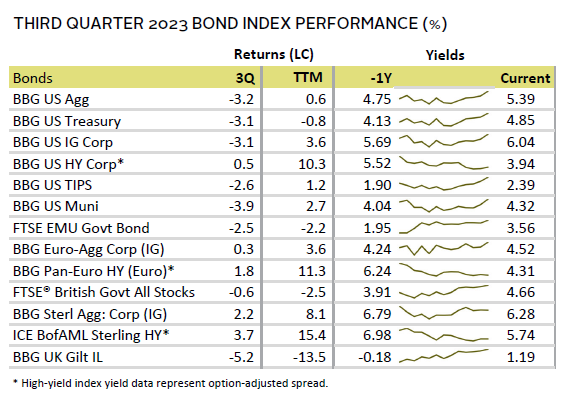
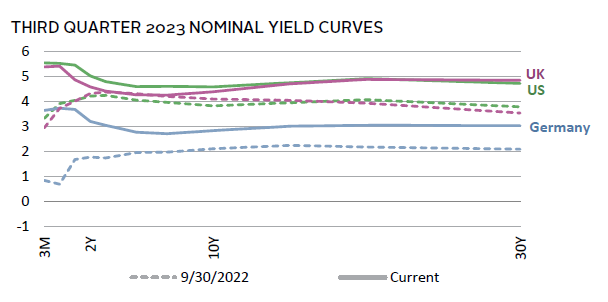
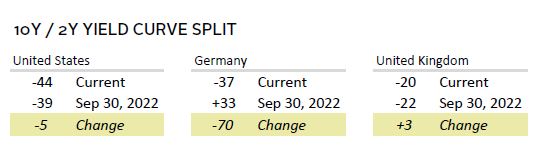
US fixed income performance faltered in Q3 as US Treasury yields soared. The ten-year yield rose 78 bps to 4.59%, reaching its highest levels since 2007. The move higher was driven more by real yields than inflation expectations, with the ten-year US TIPS yield up 65 bps to 2.24%. This suggests markets were more concerned about issues such as Fed policy, resilience of the US economy, and increased Treasury issuance over the inflation outlook. With the steep rise concentrated at longer-dated tenors, the US yield curve inversion abated, with the ten-year/three-month spread narrowing by 66 bps but remaining inverted at -96 bps. US Treasuries are now on pace for their third consecutive annual decline, with performance down 1.5% year-to-date. High-yield corporates were the lone exception in Q3, with credit spreads largely unchanged at 15% below median levels.
UK gilts declined the least among major government bonds in Q3. Ten-year gilt yields rose just 10 bps to 4.39%, as inflation moderated more than expected and peak BOE rate expectations came down by more than 100 bps. German ten-year bund yields climbed 44 bps to 2.84%, reaching their highest levels in more than a decade. Yields pushed higher across the eurozone, including in Italy, where larger-than-expected budget deficits catalyzed a widening in spreads versus core German bund yields.
Sources: Bank of England, Bloomberg Index Services Limited, Federal Reserve, FTSE Fixed Income LLC, FTSE International Limited, Intercontinental Exchange, Inc., and Thomson Reuters Datastream.
Real Assets
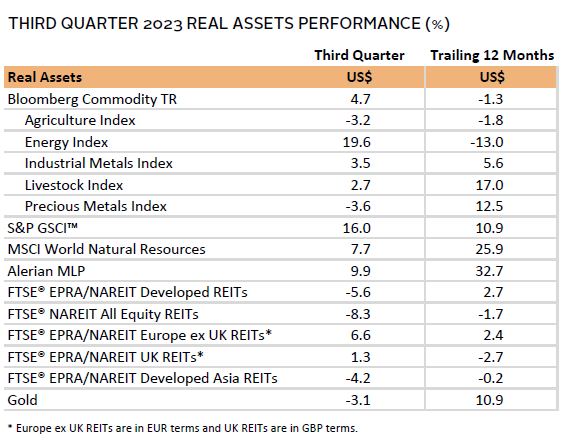
Real assets performance was largely mixed as investors digested several crosscurrents, including the Chinese growth outlook, central bank policy, and a strengthening US dollar. Commodity futures advanced, spurred by sharp increases in energy prices, whereas precious metals declined.
Oil prices ($95.31 for Brent and $90.79 for WTI) gained nearly 30% on the quarter as supply/demand dynamics fed expectations that the market could be in deficit in the near term. Saudi Arabia and Russia extended their voluntary production cuts of a combined 1.5 million barrels/day through the end of the year, which is on top of announced cuts from other OPEC+ members. European natural gas prices rose more than 10%, as a short-lived strike at Australian liquefied natural gas facilities—which account for roughly 7% of global supply—sent prices higher.
Global natural resources equities rode the wave of higher energy prices. Still, materials stocks declined in Q3, offsetting some of the gains from the energy sector.
REITs were mixed. US REITs lagged, given the sharply higher US Treasury yields, but Europe ex UK and UK REITs managed to gain. In China, property shares came under pressure as further stress in the sector—particularly for beleaguered Evergrande—weighed on sentiment.
Gold prices fell to $1,856.75 as a stronger US dollar and higher real yields weighed on the yellow metal.
Sources: Alerian, Bloomberg L.P., EPRA, FTSE International Limited, Intercontinental Exchange, Inc., MSCI Inc., National Association of Real Estate Investment Trusts, Standard & Poor’s, and Thomson Reuters Datastream. MSCI data provided “as is” without any express or implied warranties.
Note: Gold performance based on spot price return.
USD-Based Investors
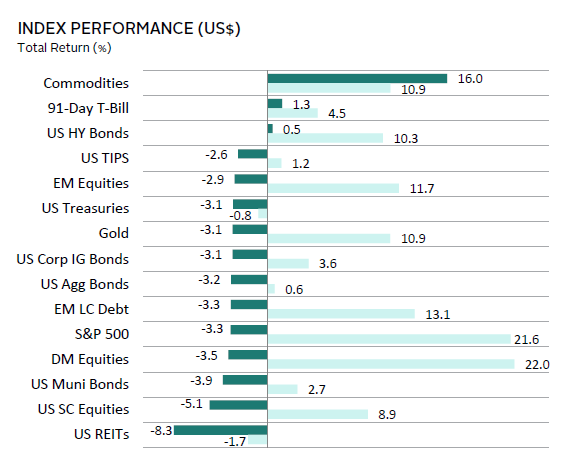
Most asset classes declined in Q3 as higher bond yields weighed on sentiment. Commodity futures were a notable exception, as tighter supply/demand dynamics pushed oil prices up nearly 30%. Within equities, EM bested DM for the first time in five quarters, while US small caps lagged domestic large caps. Investment-grade fixed income categories declined, as the trailing 12-month return for US Treasuries remained negative. Cash outperformed, given its shorter duration and elevated policy rates. US REITs and gold prices lost ground on higher bond yields and a stronger US dollar.
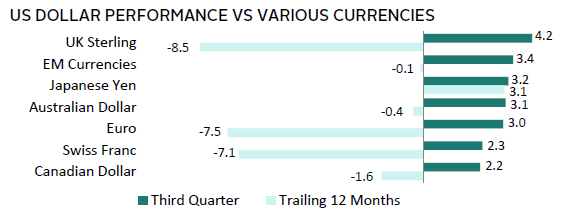
The US dollar broadly advanced, strengthening the most versus the UK sterling, EM currencies, and the Japanese yen. Wider rate differentials were a key driver of the performance, as these three segments saw a reset of policy expectations, several rate cuts, and ongoing negative rates, respectively. The greenback was mostly weaker over the past year, gaining versus only the Japanese yen.
Better-than-expected US economic data was the core factor underlying the macro environment. An index of US economic surprises rose to one of its highest levels in the past decade, outside the initial pandemic recovery, as the initial Q2 GDP growth estimate exceeded forecasts (2.4% versus 1.5% expected). GDP growth was revised down by 30 bps, as the final rate of consumer spending growth was less than half the initial estimate. This, combined with unexpected drops in consumer confidence during the quarter and looming risks of a further spending growth slowdown, weighed on sentiment. Still, GDP was buoyed by upward revisions to business investment, where durable goods ex transportation orders consistently outperformed expectations in Q3. Core inflation (ex food and energy) rates trended downwards to 4.3% YOY in August, while rising oil prices lifted the headline rate to 3.7% YOY.
Sources: Bloomberg Index Services Limited, FTSE International Limited, Frank Russell Company, Intercontinental Exchange, Inc., J.P. Morgan Securities, Inc., MSCI Inc., National Association of Real Estate Investment Trusts, Standard & Poor’s, and Thomson Reuters Datastream. MSCI data provided “as is” without any express or implied warranties.
EUR-Based Investors
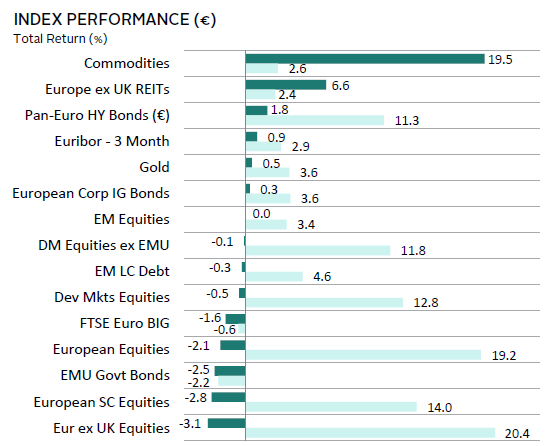
Risk asset performance was mixed in Q3. Equity markets generally declined, with Europe ex UK equities posting the largest drawdown. EM outperformed DM for the first time in five quarters, while European small caps lagged large caps. Investment-grade bond returns were generally weak as German bund yields rose to decade highs, whereas high-yield corporates and cash outperformed. Real assets generally gained, highlighted by oil prices surging nearly 30%, which boosted commodities. Europe ex UK REITs and gold also managed gains on the quarter.
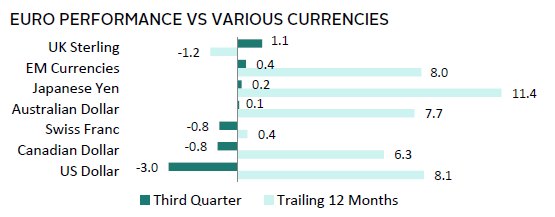
The euro was mixed in Q3, gaining versus the UK sterling, EM currencies, and the Japanese yen, while depreciating the most against the US dollar. Although the ECB raised rates, weak economic fundamentals weighed on the common currency. The euro generally advanced over the past year, save for against the UK sterling.
The ECB raised the deposit rate by 50 bps during the quarter against a weakening economic backdrop. September’s hike brought the policy rate to 4.00%, the highest level since the euro launched in the late 1990s. Eurozone economic data were generally weak in Q3, with PMI data suggesting economic growth contracted for four straight months through September, while GDP expanded just 0.1% quarter-over-quarter in Q2. Still, the ECB echoed the Fed’s playbook, signaling a potential end to the hiking cycle and a higher-for-longer approach. Preliminary data suggested core inflation softened more than expected to 4.5% YOY in September. However, the risk of a prolonged stagflationary environment appears to have increased, particularly as the euro has weakened and energy prices have climbed.
Sources: Bloomberg Index Services Limited, EPRA, European Banking Federation, FTSE Fixed Income LLC, FTSE International Limited, Intercontinental Exchange, Inc., J.P. Morgan Securities, Inc., MSCI Inc., National Association of Real Estate Investment Trusts, Standard & Poor’s, and Thomson Reuters Datastream. MSCI data provided “as is” without any express or implied warranties.
GBP-Based Investors
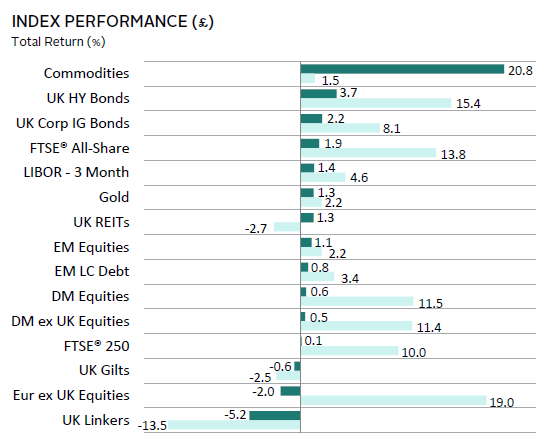
UK-based investors enjoyed gains across most asset classes in Q3, as upward pressure on gilt yields was limited, given the sharp reset in BOE rate expectations. UK stocks outperformed other equity asset classes and have now bested the broader DM index over the past year. Still, more domestically oriented UK mid caps were flat on the quarter. Within fixed income, high-yield and investment-grade corporates outperformed gilts, with cash also among the top performers. Commodities were boosted by the near 30% rise in oil prices, while UK REITs and gold also managed to gain.
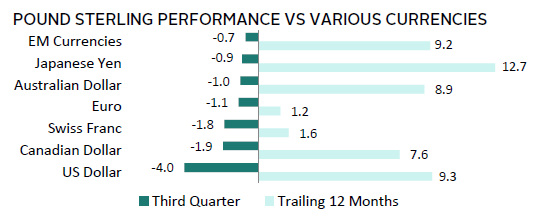
The UK sterling broadly weakened during the quarter, depreciating the most versus the US and Canadian dollars and the Swiss Franc. This stands in sharp contrast to results over the past year, where the pound gained versus all major currencies we track.
The BOE in September refrained from lifting rates above the current 5.25% level, as policy appeared to be impacting economic growth. GDP contracted more than expected month-on-month in July, preliminary PMI data suggested activity contracted for a second straight month in September, and core inflation cooled more than expected to 6.2% YOY in August. Within the PMI report, services activity hit a 32-month low. Further weighing on the outlook, broad UK money supply contracted for the first time in at least 13 years in August. UK wage growth outstripped inflation and hit new records in Q3. This suggested underlying pricing pressures remain present and contributed to a rebound in consumer confidence.
Sources: Bloomberg Index Services Limited, EPRA, FTSE International Limited, Intercontinental Exchange, Inc., J.P. Morgan Securities, Inc., MSCI Inc., National Association of Real Estate Investment Trusts, Standard & Poor’s, and Thomson Reuters Datastream. MSCI data provided “as is” without any express or implied warranties.
Performance Exhibits
All data are total returns unless otherwise noted. Total return data for all MSCI indexes are net of dividend taxes.
USD-Based Investors index performance chart includes performance for the Bloomberg US Aggregate Bond, Bloomberg US Corporate Investment Grade, Bloomberg US High Yield Bond, Bloomberg Municipal Bond, Bloomberg US TIPS, Bloomberg US Treasuries, ICE BofAML 91-Day Treasury Bills, FTSE® NAREIT All Equity REITs, J.P. Morgan GBI-EM Global Diversified, LBMA Gold Price, MSCI Emerging Markets, MSCI World, Russell 2000®, S&P 500, and S&P GSCI™ indexes.
EUR-Based Investors index performance chart includes performance for the Bloomberg Euro-Aggregate: Corporate, Bloomberg Pan-Euro High Yield (Euro), EURIBOR 3M, FTSE EMU Govt Bonds, FTSE Euro Broad Investment-Grade Bonds, FTSE® EPRA/NAREIT Europe ex UK RE, J.P. Morgan GBI-EM Global Diversified, LBMA Gold Price AM, MSCI Emerging Markets, MSCI Europe, MSCI Europe ex UK, MSCI Europe Small-Cap, MSCI World ex EMU, MSCI World, and S&P GSCI™ indexes.
GBP-Based Investors index performance chart includes performance for the Bloomberg Sterling Aggregate: Corporate Bond, Bloomberg Sterling Index-Linked Gilts, ICE BofAML Sterling High Yield, FTSE® 250, FTSE® All-Share, FTSE® British Government All Stocks, FTSE® EPRA/NAREIT UK RE, J.P. Morgan GBI-EM Global Diversified, LBMA Gold Price AM, LIBOR 3M GBP, MSCI Emerging Markets, MSCI Europe ex UK, MSCI World, MSCI World ex UK, and S&P GSCI™ indexes.
EM currencies is an equal-weighted basket of 20 emerging markets currencies.
Fixed Income Performance Table
Performance data for US TIPS reflect the Bloomberg US TIPS Index, with yields represented by the Bloomberg Global Inflation Linked Bond Index: US.