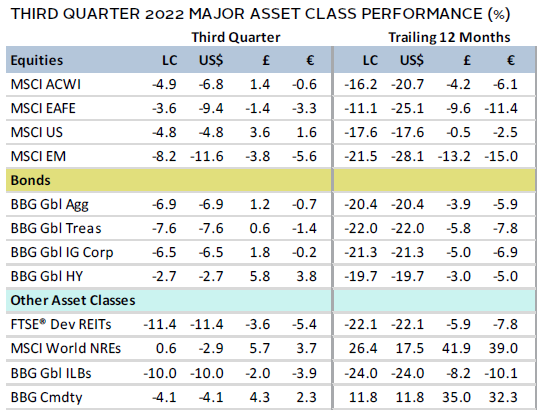
Risk assets declined again in third quarter. Global equities recorded the worst three-quarter decline since the 2008–09 Global Financial Crisis (GFC). Developed ex US equities held up better than US peers. But US stocks outperformed in major currency terms as the dollar strengthened, while emerging markets equities trailed. Growth equities and small caps outpaced their value and large-cap equivalents. Global bonds, pressured by central bank benchmark rate hikes, declined for the fifth consecutive quarter. High-yield bonds held up better than most other asset classes, while government bonds again experienced historically steep declines. Real assets mostly fell. REITs declined more than any other major asset class amid rising interest rates. Among major currencies, the US dollar strengthened, the euro was mixed, and UK sterling suffered historical weakness.
Sources: Bloomberg Index Services Limited, Bloomberg L.P., EPRA, FTSE International Limited, MSCI Inc., National Association of Real Estate Investment Trusts, and Thomson Reuters Datastream. MSCI data provided “as is” without any express or implied warranties.
Note: Local currency returns for the Bloomberg fixed income indexes, the Bloomberg Commodity Index, and the FTSE® Developed REITs are in USD terms.
The Macro Picture
The pattern of global equity price movements in third quarter resembled that of a rollercoaster, first experiencing a steep ascent before sharply plunging to end the quarter at the lowest levels since 2020. Investors were initially optimistic that the Federal Reserve could pivot away from restrictive monetary policy sooner than expected to avert an economic hard landing. However, sentiment took a sharp turn after Fed Chairman Jerome Powell delivered a stern message that the central bank would maintain its restrictive policy stance until inflation returns to its 2% target, even if it causes economic pain. Higher-than-expected global inflation readings and unified hawkish messaging from major central banks have also forced investors to come to terms with the reality that elevated interest rates could persist for longer than expected. As yields surged higher, bond markets experienced yet another historically steep decline.
Many economists have trimmed global growth forecasts in recent months. A multitude of geopolitical issues captured headlines during the quarter and form the backdrop heading into the last quarter of 2022. China—one of the few countries to avoid recession during the height of the COVID-19 pandemic—is facing economic fallout from its zero-COVID policy and faltering real estate market. The EU is reeling from an intensifying energy crisis, as Russia cut off nearly all its natural gas supplies amid continuing escalation of its ongoing invasion of Ukraine. The new UK government proposed a widely criticized budget, sparking major turbulence in its debt and currency markets. The latter development contributed to an uptick in asset price volatility, suggesting that investors believe the global economy is on fragile footing and susceptible to contagion.
Equities
US equities declined in third quarter and underperformed all other major developed markets; however, in major currency terms, US stocks outperformed as the US dollar strengthened considerably. Small caps and growth stocks held up better than large-cap and value peers. Most losses occurred late in the quarter as stocks sharply repriced from earlier gains. As recently as mid-September, all 11 S&P 500 sectors were positive for the quarter and more than half had amassed gains of at least 10%. However, by quarter end, only two sectors logged positive gains—energy, which continued to benefit from elevated prices, and consumer discretionary, which advanced due to its heavy concentration in two individual stocks. Communication services and real estate were bottom performers, pressured by rising interest rates. S&P 500 earnings grew 6% year-over-year in second quarter; but when the energy sector is excluded, earnings per share declined. Analysts now expect third quarter year-over-year earnings growth to moderate to just 3%, significantly below earlier estimates and the steepest downward revision in two years.
US GDP declined in the first two quarters of 2022, entering a technical recession, but underlying measures of economic activity remained strong. Unemployment remained near historic lows, payrolls and job openings exceeded expectations, and retail sales generally outperformed. Forward-looking data painted a less optimistic picture—investor sentiment dipped to the lowest level for the year, most regional Fed indexes indicated softening economic activity, and business activity contracted. Headline inflation ticked down but remained extraordinarily high as the Fed raised benchmark interest rates 150 basis points (bps) and tamed market expectations for an early rate cut.
European equities declined in third quarter, under-performing broad developed ex US stocks. Europe ex UK trailed all major developed markets, save for the United States in local currency terms, but the United Kingdom was the bottom performer in major currency terms as UK sterling fell to its lowest level against the US dollar in history.
UK GDP expanded 0.2% in second quarter, beating expectations, but the Bank of England (BOE) lowered future growth forecasts and increased inflation expectations. Inflation topped 10%, its highest rate in 40 years, before slightly moderating later in the quarter. The BOE raised its benchmark interest rate 100 bps but was forced to provide emergency liquidity to the gilt market in late September—a move viewed as counterproductive to its goal of lowering inflation—after new Prime Minister Liz Truss announced a controversial budget plan. UK sterling steeply sold off after the announcement as critics claimed the plan would increase the budget deficit without boosting economic activity. The BOE subsequently unleashed a 13-day £65B bond-buying program to avoid “material risk to UK financial stability.”
Eurozone second quarter GDP expanded 0.8%, slightly better than expected, but both headline and core inflation continued to tick higher. The European Central Bank (ECB) raised its benchmark interest rate 125 bps but remained behind the curve compared to central banks in other developed economies fighting multi-decade high inflation. Both manufacturing and services PMIs turned contractionary in third quarter as the monetary union grappled with its ongoing energy crisis resulting from Russia’s invasion of Ukraine.
Japanese equities declined the least among major developed ex US markets in third quarter, supported by the Bank of Japan’s (BOJ’s) ongoing accommodative policy. Inflation continued to accelerate, yet remained well below the exceptional levels seen elsewhere, reaching 3.0% year-over-year in August, above but near the central bank’s 2.0% target. The BOJ maintained its dovish stance to support economic growth, keeping benchmark interest rates at -0.1% and reaffirming its commitment to buy an unlimited amount of domestic bonds. The BOJ is the only central bank in the world that still has negative benchmark rates. This has kept downward pressure on the yen, which significantly depreciated during the quarter, particularly against the US dollar. Late in the quarter, the BOJ intervened in currency markets for the first time since 1998, temporarily propping up the yen, which had reached its lowest level vis-à-vis the US dollar in 24 years. Calendar second quarter GDP grew well above forecast at an annualized rate of 3.5%, yet manufacturing PMI softened and services PMI dipped into contractionary territory. BOJ Governor Haruhiko Kuroda noted the central bank has “no choice other than continued monetary easing until wages and prices rise in a stable and sustainable manner.”
Pacific ex Japan equities trailed broad developed ex US stocks, buffeted by Hong Kong, which declined more than any other developed market. New Zealand topped second quarter GDP estimates, Australia and Singapore expanded but missed expectations, and Hong Kong unexpectedly contracted. The Reserve Bank of Australia (RBA) and Reserve Bank of New Zealand (RBNZ) raised their benchmark cash rates by 150 bps and 100 bps, respectively. The RBA reaffirmed its commitment to doing whatever is necessary to bring inflation down to the 2%–3% range. The RBNZ updated its forecasts and now expects inflation to continue to exceed targets until the middle of 2024, noting additional monetary tightening is needed.
Sources: MSCI Inc. and Thomson Reuters Datastream. MSCI data provided “as is” without any express or implied warranties.
Emerging markets equities declined in third quarter by the most since the onset of the COVID-19 pandemic, trailing developed markets peers for the sixth time in the past seven quarters. Performance varied widely across countries and regions. Emerging Asia trailed the broader index, Europe, the Middle East & Africa (EMEA) declined but outperformed, and Latin America gained. Among major countries, China and Taiwan lagged, Korea and South Africa declined but outperformed the broader index, Saudi Arabia was flat, and Brazil and India advanced. Brazil’s top performance comes amid a contentious election battle between President Jair Bolsonaro and former president Luiz Inácio Lula da Silva that was heading to a second-round run-off after the end of the quarter. Among other notable country returns, Turkey, which has been experimenting with unconventional monetary policy, advanced nearly 30%. The Central Bank of the Republic of Turkey surprised with two 1% benchmark rate cuts in third quarter despite inflation of more than 80%. The Turkish lira has lost more than half of its value vis-à-vis the US dollar over the last year.
Chinese equities declined the most among emerging markets as investors grappled with slowing growth in the world’s second largest economy. Official second quarter year-over-year GDP grew at a 0.4% clip, much lower than expected, while independently calculated manufacturing PMIs dipped into contractionary territory in third quarter and youth unemployment hit a record at nearly 20%. Chinese equities were temporarily boosted by a landmark deal allowing US regulators access to audits of Chinese firms listed in the United States. However, investors remained cautious as the deal’s details were limited. The People’s Bank of China enacted several dovish actions to help rejuvenate economic growth.
Sources: MSCI Inc. and Thomson Reuters Datastream. MSCI data provided “as is” without any express or implied warranties.
Fixed Income
US fixed income securities broadly declined again in third quarter as interest rates rose across maturities and the Fed sent a forceful message to expect higher rates for longer. Investment-grade corporate bonds declined the most, while high-yield corporate peers were nearly flat. Five- and ten-year Treasury yields rose 105 bps and 85 bps to 4.06% and 3.83%, respectively. The ten-year/two-year yield curve retreated 45 bps to -39 bps and has now been inverted for 63 consecutive business days. Since data became available in the mid-1970s, every time the ten-year/two-year yield curve has inverted for at least 20 consecutive business days, there has been an official recession within the following two years. TIPS trailed nominal Treasuries as real ten-year interest rates rose 103 bps to 1.68%, their highest level since the GFC.
UK fixed income declined steeply on Prime Minister Truss’s deficit-inducing budget plan and broader declining economic outlook—UK investment-grade corporates and gilts declined by double digits. Five- and ten-year nominal gilt yields rose 238 bps and 181 bps to 4.32% and 4.10%, respectively, both reaching their highest levels since the GFC. UK linkers also declined nearly 10% and are the bottom-performing major fixed income asset class over the last 12 months. German ten-year bund yields rose 74 bps to 2.11%, reaching their highest level in more than a decade. German and Italian ten-year bond yield spreads reached their highest levels since the onset of the COVID-19 pandemic, despite the ECB’s new policy tool designed to minimize spreads between member-countries’ borrowing costs.
Real Assets
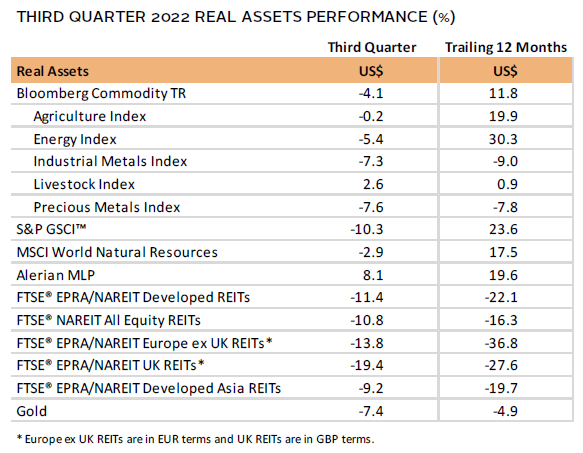
Commodities declined in third quarter as a weakened global growth outlook and higher interest rates dampened demand for energy, industrial, and precious metals—all of which underperformed.
Oil prices ($87.96 for Brent and $79.49 for WTI) declined more than 20% to their lowest levels in nine months, as slowing demand from China and a stronger dollar weighed on prices. However, late in the quarter, reports surfaced that OPEC+ planned to cut supply by around a million barrels per day to prop up prices—a significant divergence from concessions made by the 23-nation alliance to increase output amid spiking energy prices earlier in the quarter.
Global natural resources equities and energy MLPs were among top-performing major asset classes, supported by significant corporate earnings increases.
Global REITs posted heavy declines as government bond yields rose and mortgage rates reached the highest levels since before the GFC. UK REITs and Europe ex UK REITs fell the most, while US REITs and developed Asia REITs outperformed but also declined by around 10%.
Gold prices fell to $1,674.06/troy ounce—the lowest quarter-end level in two and a half years—and turned negative on a trailing 12-month basis as the dollar strengthened.
Sources: Alerian, Bloomberg L.P., EPRA, FTSE International Limited, Intercontinental Exchange, Inc., MSCI Inc., National Association of Real Estate Investment Trusts, Standard & Poor’s, and Thomson Reuters Datastream. MSCI data provided “as is” without any express or implied warranties.
Note: Gold performance based on spot price return.
USD-Based Investors
Risk assets declined again in third quarter as rising interest rates and US dollar strength impacted relative performance. Cash was the only asset class to gain and is now one of two major asset classes with a positive return over the trailing 12 months. US high-yield bonds were nearly flat, outperforming Treasuries and US investment-grade corporate peers. Treasuries held up better than TIPS as real interest rates touched their highest levels since the GFC. US stocks outperformed global ex US as the dollar surged. Developed markets outperformed emerging markets, which were weighed down by Chinese equities; emerging markets equities declined the most among major asset classes in third quarter and over the trailing 12-month period. Other bottom performers include US REITs, pressured by rising interest rates, and commodities, which sold off on dampened global growth outlook.
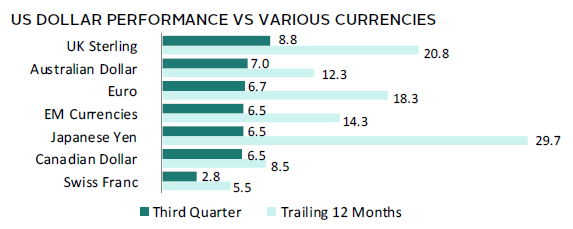
The US dollar reached a 20-year high on hawkish comments from Fed Chairman Powell, advancing against all other major currencies. The greenback advanced the most vis-à-vis UK sterling, the Australian dollar, and the euro, while gaining the least against fellow safe-haven, the Swiss franc. Notably, the Japanese yen declined the most versus the US dollar over the trailing 12 months, due in large part to central bank policy divergence. The BOJ is the only central bank in the world to still have negative benchmark policy rates, while the Fed has been aggressively tightening monetary policy.
US GDP declined for a second consecutive quarter but other indicators, including labor market and consumer spending data, remained strong. Forward-looking data painted a less optimistic picture—investor sentiment dipped to the lowest level for the year, most regional Fed indexes indicated softening economic activity, and composite PMI data turned contractionary. Headline inflation ticked down but remained extraordinarily high as the Fed raised benchmark interest rates 150 basis points and tamed market expectations for an early rate cut.
Sources: Bloomberg Index Services Limited, FTSE International Limited, Frank Russell Company, Intercontinental Exchange, Inc., J.P. Morgan Securities, Inc., MSCI Inc., National Association of Real Estate Investment Trusts, Standard & Poor’s, and Thomson Reuters Datastream. MSCI data provided “as is” without any express or implied warranties.
EUR-Based Investors
Most risk assets declined again in third quarter as rising interest rates and US dollar strength impacted relative performance. Developed markets ex EMU stocks, boosted by significant US dollar appreciation versus the euro, advanced and outperformed European equities. Emerging markets equities lagged, buffeted by a steep decline in Chinese stocks. Pan-Euro high-yield corporate bonds outperformed European investment-grade corporate peers and EMU government bonds. Europe ex UK REITs declined the most on rising interest rates. Commodities and gold were in the middle of the pack, mostly due to their pricing in USD; when performance is viewed in USD terms, commodities and gold were among the bottom performers. Cash was a top asset class simply for providing a near-zero return.
The euro was mixed in third quarter, advancing vis-à-vis UK sterling, declining versus the safe-havens US dollar and Swiss franc, and remaining relatively flat relative to other major currencies. Notably, the euro has significantly gained versus the Japanese yen over the trailing 12 months, due in large part to central bank policy divergence. The BOJ is the only central bank in the world to still have negative benchmark policy rates, while the ECB has tightened monetary policy, raising its benchmark rate into positive territory for the first time since 2012.
Eurozone second quarter GDP expanded 0.8%, slightly better than expected, but both headline and core inflation continued to tick higher. The ECB raised its benchmark interest rate 125 bps to +0.75% but remained behind the curve compared to central banks in other developed economies fighting multi-decade high inflation. Both manufacturing and services PMIs turned contractionary in third quarter as the monetary union grappled with its ongoing energy crisis resulting from Russia’s invasion of Ukraine.
Sources: Bloomberg Index Services Limited, EPRA, European Banking Federation, FTSE Fixed Income LLC, FTSE International Limited, Intercontinental Exchange, Inc., J.P. Morgan Securities, Inc., MSCI Inc., National Association of Real Estate Investment Trusts, Standard & Poor’s, and Thomson Reuters Datastream. MSCI data provided “as is” without any express or implied warranties.
GBP-Based Investors
Most risk assets declined again in third quarter as rising interest rates and US dollar strength impacted relative performance. Developed markets ex UK stocks, boosted by significant US dollar appreciation versus UK sterling, advanced and outperformed UK equities. Emerging markets equities lagged, buffeted by a steep decline in China stocks. UK high-yield corporate bonds held up better than UK investment-grade corporate peers and gilts, which were among the bottom performers amid a controversial spending plan put forward by new Prime Minister Truss that has since been amended. Steeply rising interest rates also meant UK REITs were bottom performer over the quarter and the trailing 12 months.
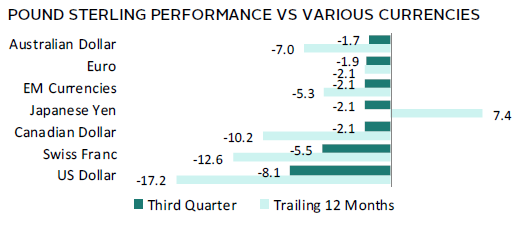
UK sterling suffered historic weakness, falling to its lowest level versus the US dollar in history following the policy announcement. Sterling declined the most vis-à-vis the safe-havens US dollar and Swiss franc; over the trailing 12-month period, UK sterling has declined at least 10% versus the US dollar, Swiss franc, and Canadian dollar. Notably, UK sterling has significantly gained versus the Japanese yen over the trailing 12 months, due in large part to central bank policy divergence. The BOJ is the only central bank in the world to still have negative benchmark policy rates, while the BOE has tightened monetary policy.
UK GDP expanded 0.2% in second quarter, beating expectations, but the BOE lowered future growth forecasts and increased inflation expectations. Inflation topped 10%, its highest rate in 40 years, before moderating slightly later in the quarter. The BOE raised its benchmark interest rate 100 bps but was forced to provide emergency liquidity to the gilt market in late September—a move viewed as counterproductive to their goal of bringing down inflation—after a controversial budget plan forced the BOE to unleash a 13-day £65B bond-buying program to avoid “material risk to UK financial stability.”
Sources: Bloomberg Index Services Limited, EPRA, FTSE International Limited, Intercontinental Exchange, Inc., J.P. Morgan Securities, Inc., MSCI Inc., National Association of Real Estate Investment Trusts, Standard & Poor’s, and Thomson Reuters Datastream. MSCI data provided “as is” without any express or implied warranties.
Performance Exhibits
All data are total returns unless otherwise noted. Total return data for all MSCI indexes are net of dividend taxes.
USD-Based Investors index performance chart includes performance for the Bloomberg US Aggregate Bond, Bloomberg US Corporate Investment Grade, Bloomberg US High Yield Bond, Bloomberg Municipal Bond, Bloomberg US TIPS, Bloomberg US Treasuries, ICE BofAML 91-Day Treasury Bills, FTSE® NAREIT All Equity REITs, J.P. Morgan GBI-EM Global Diversified, LBMA Gold Price, MSCI Emerging Markets, MSCI World, Russell 2000®, S&P 500, and S&P GSCI™ indexes.
EUR-Based Investors index performance chart includes performance for the Bloomberg Euro-Aggregate: Corporate, Bloomberg Pan-Euro High Yield (Euro), EURIBOR 3M, FTSE EMU Govt Bonds, FTSE Euro Broad Investment-Grade Bonds, FTSE® EPRA/NAREIT Europe ex UK RE, J.P. Morgan GBI-EM Global Diversified, LBMA Gold Price AM, MSCI Emerging Markets, MSCI Europe, MSCI Europe ex UK, MSCI Europe Small-Cap, MSCI World ex EMU, MSCI World, and S&P GSCI™ indexes.
GBP-Based Investors index performance chart includes performance for the Bloomberg Sterling Aggregate: Corporate Bond, Bloomberg Sterling Index-Linked Gilts, ICE BofAML Sterling High Yield, FTSE® 250, FTSE® All-Share, FTSE® British Government All Stocks, FTSE® EPRA/NAREIT UK RE, J.P. Morgan GBI-EM Global Diversified, LBMA Gold Price AM, LIBOR 3M GBP, MSCI Emerging Markets, MSCI Europe ex UK, MSCI World, MSCI World ex UK, and S&P GSCI™ indexes.
EM currencies is an equal-weighted basket of 20 emerging markets currencies.
Fixed Income Performance Table
Performance data for US TIPS reflect the Bloomberg US TIPS Index, with yields represented by the Bloomberg Global Inflation Linked Bond Index: US.


