Capital markets performance was mixed in third quarter, with muted gains or losses across many asset classes. Global equities declined for the first time since the onset of the pandemic; developed shares mildly advanced, but emerging equivalents experienced sharp drawdowns. Growth bested value, while large caps edged small caps. Sovereign bonds trailed corporate equivalents, and investment-grade corporates lagged high-yield peers. Inflation-linked bonds advanced. Real assets were mixed as commodities were the top-performing asset class, but natural resources equities and developed REITs declined. The US dollar appreciated during the quarter, the euro was mixed, and UK sterling mostly depreciated.

THIRD QUARTER 2021 MAJOR ASSET CLASS PERFORMANCE (%)
Sources: Bloomberg Index Services Limited, Bloomberg L.P., EPRA, FTSE International Limited, MSCI Inc., National Association of Real Estate Investment Trusts, and Thomson Reuters Datastream. MSCI data provided “as is” without any express or implied warranties.
Note: Local currency returns for the Bloomberg fixed income indexes, the Bloomberg Commodity Index, and the FTSE® Developed REITs are in USD terms.
The Macro Picture
Several key themes weighed on risk assets near the end of the quarter, particularly signs that central banks were prepared to tighten monetary policy, coupled with political uncertainty around the globe. On the latter theme, partisan standoffs in the United States, pivotal elections in Germany and Japan, and ongoing regulatory crackdowns in China all added to market volatility.
Many central banks have adopted more hawkish stances, and some emerging markets banks have even raised interest rates in efforts to prevent runaway inflation, as year-over-year price changes remained elevated in third quarter. Federal Reserve Chairman Jerome Powell, who has frequently characterized the bout of inflation as transitory, indicated that higher prices could last for longer than initially expected. Fed members have consequently pulled forward rate hike expectations, with more members now forecasting rate hikes as early as 2022.
Political posturing in the United States has pushed the country to its sixth debt ceiling standoff in the last ten years. According to Treasury Secretary Janet Yellen, if the debt ceiling is not raised or suspended by October 18, the United States risks a debt default. US Congress narrowly avoided a government shutdown and remained sharply divided on two other potential landmark bills—the $1.2 trillion bipartisan infrastructure deal and President Biden’s $3.5 trillion social spending package. Outside the United States, Japan and Germany held elections that effectively chose their next leaders, though the future policy impacts of these results remain uncertain. In China, numerous technology sector restrictions were introduced, and concerns about financial contagion related to the potential collapse of real estate developer Evergrande exacerbated market volatility near the end of the quarter.
Equities
US equities advanced for the sixth consecutive quarter, outperforming their developed ex US and emerging markets equivalents in major currency terms. Six of 11 S&P 500 Index sectors gained, led by financials, utilities, and communications services, whereas industrials, materials, and energy declined the most. Growth topped value and large caps bested small caps for the full quarter, although the reverse was true in September amid market volatility. US corporate earnings per share (EPS) grew 91% year-over-year in second quarter, nearly doubling expectations at the beginning of the quarter. Revenues grew 25% and net profit margins rose to 13%—both setting records since FactSet began tracking data in 2008. Since the beginning of third quarter, analysts have boosted full calendar year 2021 earnings growth by 7 ppts to 43%.
High frequency US economic data were generally robust, but momentum waned as third quarter unfolded. Manufacturing and services PMIs mostly declined but remained expansionary, consumer confidence fell, and weekly initial unemployment claims unexpectedly rose in September. US GDP grew at an annualized rate of 6.7% in second quarter, well below initial expectations. Second quarter GDP deflator—a more comprehensive measure of inflation than CPI or the Fed’s preferred measure, PCE—grew at its highest level in 40 years. Inflation remained elevated, and Fed Chairman Powell now expects elevated inflation to continue into 2022. The Fed indicated it believes the economy is strengthening enough to consider tapering asset purchases later this year. Officials were split on whether to increase interest rates as soon as next year, where it had previously noted higher rates would not come until at least 2023.
European equities gained but underperformed broader developed markets. Europe ex UK trailed UK counterparts for only the second time since the end of 2018.
Eurozone economic data releases were strong in third quarter, as consumer activity returned to pre-pandemic levels. Economic confidence remained relatively stable around all-time highs as COVID-19 cases declined and economies across Europe reopened. Second quarter Eurozone GDP grew at 2.2% quarter-on-quarter, above initial estimates. Germany’s federal election resulted in a narrow victory for the Social Democratic Party (SPD), besting the party of outgoing Chancellor Angela Merkel. However, with no party receiving more than about a quarter of the votes, SPD must now attempt to form a coalition government. Meanwhile, German inflation reached a nearly three-decade high amid soaring energy prices and supply chain bottlenecks. Inflation across the broader Eurozone area reached its highest level since the onset of the global financial crisis. ECB President Christine Lagarde affirmed the central bank will continue to keep monetary policy loose to support the region’s pandemic recovery and promised not to “overreact to [the] transitory supply shocks” that are boosting inflation.
In the United Kingdom, economic woes flared up as food, fuel, and labor shortages created headwinds for a sustained recovery, highlighted by retail sales declining throughout the quarter. The Bank of England noted that rising inflation and a higher inflation forecast “appeared to have strengthened” the case for higher interest rates. Backward-looking data were more robust, as second quarter GDP grew 5.5% quarter-on-quarter, outpacing expectations.
Japanese equities advanced and outgained all other major developed countries and regions in third quarter, having gained 29.1% over the past 12 months, second only to the United States. Japan’s economy grew at an annualized rate of 1.9% in calendar second quarter 2021, well above expectations and rebounding from a decline in the prior quarter. In late September, the country’s ruling party elected former foreign minister Fumio Kishida as their new leader, likely setting him up to be Japan’s next prime minister. The Bank of Japan held its target interest rate steady at -0.1%, reaffirmed its optimistic recovery outlook despite rising risks to exports, and reinforced expectations that the central bank will continue its massive stimulus program.
Pacific ex Japan equities declined in third quarter, lagging all other major developed markets peers. Hong Kong equities’ steep decline drove the underperformance for the quarter, while New Zealand outgained Singapore and Australia. Hong Kong shares were dragged down by China’s ongoing tech crackdown, fear of contagion from embattled Chinese real estate developer Evergrande, and increasing fissures between the United States and China as US President Joe Biden’s administration warned that US businesses operating in Hong Kong face significant and rising risks from mainland China’s increasing control over the city. The Reserve Bank of Australia decided to stick with its hawkish plan to taper its bond buying program in September. However, it decided to purchase bonds at A$4 billion a week until at least mid-February 2022, which was viewed as a dovish concession amid a growing Delta variant outbreak.

THIRD QUARTER 2021 DEVELOPED MARKETS EQUITY INDEX PERFORMANCE (%)
Sources: MSCI Inc. and Thomson Reuters Datastream. MSCI data provided “as is” without any express or implied warranties.
Emerging markets equities declined in third quarter, their first quarterly drawdown since the onset of the pandemic. Emerging markets trailed developed counterparts for the third straight quarter, bringing year-to-date underperformance to 14.2 ppts. Emerging markets also underperformed on a trailing 12-month basis by the most since first quarter 2014. Emerging Asia and Latin America dragged on performance, while emerging Europe, the Middle East & Africa gained. The regions’ declines were driven by China and Brazil, respectively, which both declined by double digits in local and major currency terms. Brazil’s struggling economic recovery, combined with rising political tensions, weighed on stocks in third quarter. Among other major emerging countries, Korea also lagged the broader index, Taiwan and South Africa declined but outperformed, and India advanced, boosted by strong domestic growth and demand recovery.
The double-digit decline in China stemmed from actual and perceived threats to tech firms from the central government’s ongoing crackdowns, fears surrounding potential contagion from real estate developer Evergrande’s missed debt payments, and rising tensions with the United States. Major events in third quarter included opening an investigation into Didi Chuxing just days after its IPO on the New York Stock Exchange, issuing new guidance effectively preventing tutoring firms from making a profit, increasing scrutiny of the online insurance sector, instituting stricter rules surrounding user data by tech firms, and developing enforceable curbs on the amount of time children can play video games. The Chinese government indicated that authorities plan to continue to actively work on new laws and regulations for the foreseeable future.

THIRD QUARTER 2021 EMERGING MARKETS EQUITY INDEX PERFORMANCE (%)
Sources: MSCI Inc. and Thomson Reuters Datastream. MSCI data provided “as is” without any express or implied warranties.
Fixed Income
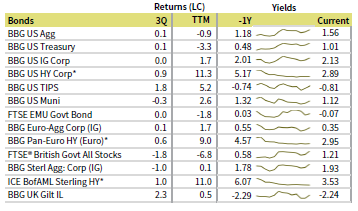
US fixed income returns were mostly flat in third quarter. Yields declined for most of the quarter but rose in September as elevated inflationary readings pressured more Fed policymakers to expect a faster path to raising interest rates. Treasuries edged investment-grade corporates but both were flat, while high-yield corporates topped investment-grade equivalents. Five- and ten-year Treasury yields rose 11 bps and 7 bps to 0.98% and 1.52%, respectively. Longer-term 30-year Treasury yields advanced 2 bps. The yield curve steepened slightly as the Fed considered raising rates much earlier than previously expected. TIPS were the top-performing US fixed income asset class as ten-year breakeven inflation rose only 5 bps to 2.37%.
UK linkers gained the most among sterling-denominated fixed income. Gilts lagged investment-grade corporate equivalents, but both declined and trailed high-yield corporates, which advanced. Five- and ten-year gilt yields advanced 26 bps and 22 bps to 0.62% and 1.04%, respectively—their highest levels since 2019. Euro-denominated investment-grade corporates edged sovereign peers, although both were effectively flat. Pan-euro high-yield corporates topped investment-grade equivalents, similar to trends seen in other geographies. Ten-year German bund yields finished the quarter where they started at -0.20%.
THIRD QUARTER 2021 BOND INDEX PERFORMANCE (%)
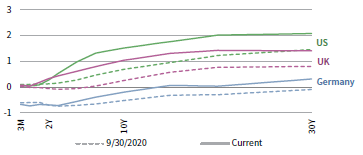
THIRD QUARTER 2021 NOMINAL YIELD CURVES
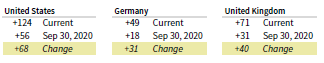
10Y/2Y YIELD CURVE SPLIT
Sources: Bank of England, Bloomberg Index Services Limited, BofA Merrill Lynch, Federal Reserve, FTSE Fixed Income LLC, FTSE International Limited, Intercontinental Exchange, Inc., and Thomson Reuters Datastream.
Real Assets
Commodity futures advanced for the sixth straight quarter. Strong gains in the energy sub-index were boosted by rising gas prices, stemming from rising demand and growing shortages. Over the past 12 months, the energy sub-index gained nearly double the return of the broader index.
Oil prices ($78.52 for Brent and $75.03 for WTI) finished the quarter at multi-year high month-end levels. Oil prices have now risen more than 50% year-to-date, despite OPEC+ members having announced plans to boost output by 400,000 barrels a day per month and committing to restore all of the deep cuts made at the start of the pandemic gradually through late 2022. Analysts predict further rises are likely given already-prevalent shortages in reserves across Europe as the northern hemisphere heads toward cooler seasonal weather.
Global natural resources equities and energy MLPs declined in third quarter, although both remain strongly positive over the past 12 months. The Alerian MLP Index in particular leads all major asset classes over that time.
Global developed REITs declined in aggregate, but performance varied across regions. UK REITs and US REITs advanced, while Europe ex UK REITs and developed Asia REITs declined and lagged the broad REIT index.
Gold prices fell to $1,760.95/troy ounce—the third quarterly decline in the last year—amid hawkish tapering comments from central bankers. The yellow metal has fallen out of favor despite stickier than predicted inflation, signs of declining economic sentiment, and rising recovery uncertainty.

THIRD QUARTER 2021 REAL ASSETS PERFORMANCE (%)
Sources: Alerian, Bloomberg L.P., EPRA, FTSE International Limited, Intercontinental Exchange, Inc., MSCI Inc., National Association of Real Estate Investment Trusts, Standard & Poor’s, and Thomson Reuters Datastream. MSCI data provided “as is” without any express or implied warranties.
Note: Gold performance based on spot price return.
USD-Based Investors
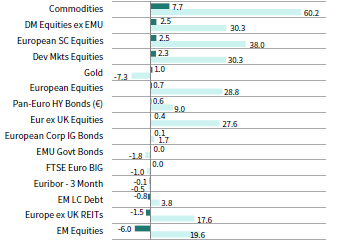
Inflation-sensitive assets led performance in third quarter, supported by rising prices, supply bottlenecks, and increasingly hawkish central bank communique. Commodities gained the most and are the top performer over the past year. US TIPS topped all fixed income categories; high-yield corporates outgained investment-grade equivalents, and Treasuries edged out investment-grade corporates. US large caps outperformed all other major equity categories, while US small caps and emerging markets stocks lagged and were the bottom-performing asset classes in third quarter. However, over the past 12 months US small caps were a top performer, and emerging equities returned nearly 20%. Gold prices retreated the most over the last year.
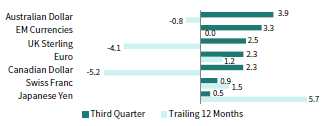
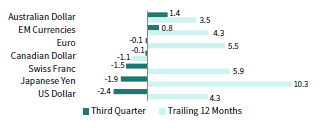
The US dollar appreciated in third quarter, gaining the most vis-à-vis the Australian dollar, our basket of EM currencies, and UK sterling. The dollar appreciated the least versus the safe havens Japanese yen and Swiss franc. The greenback was mixed over the past year, gaining the most versus the Japanese yen and Swiss franc, while declining the most vis-à-vis the Canadian dollar and UK sterling.
High frequency US economic data were generally robust, but momentum waned as third quarter unfolded. US GDP grew at an annualized rate of 6.7% in second quarter, well below initial expectations, while second quarter GDP deflator—a more comprehensive measure of inflation than CPI or the Fed’s preferred measure, PCE—grew at its highest level in 40 years. Fed officials debated a more hawkish view and were split on whether to increase interest rates as soon as next year. The Fed had previously noted that higher rates would not come until at least 2023.

INDEX PERFORMANCE (US$)
US DOLLAR PERFORMANCE VS VARIOUS CURRENCIES
Sources: Bloomberg Index Services Limited, FTSE International Limited, Frank Russell Company, Intercontinental Exchange, Inc., J.P. Morgan Securities, Inc., MSCI Inc., National Association of Real Estate Investment Trusts, Standard & Poor’s, and Thomson Reuters Datastream. MSCI data provided “as is” without any express or implied warranties.
EUR-Based Investors
Commodities and equities led performance in third quarter, supported by out-of-sync energy supply/demand dynamics and the continuing economic recovery across Europe. Developed ex EMU equities topped European stocks, and both outperformed emerging markets equities, which were the bottom-performing asset class. European small caps bested large-cap equivalents, while Europe ex UK stocks trailed UK peers. European high-yield bonds outperformed investment-grade equivalents; European corporate investment-grade bonds edged EMU sovereigns. Over the past 12 months, commodities and European small-cap equities were top performers, while gold and EMU sovereigns declined the most.
The euro was mixed in third quarter, appreciating the most versus the Australian dollar and our basket of EM currencies, and declining the most vis-à-vis safe havens US dollar, Japanese yen, and Swiss franc. The common currency mostly depreciated over the past year, gaining only versus the Japanese yen and Swiss franc, while declining the most vis-à-vis Canadian dollar, UK sterling, and Australian dollar.
Eurozone economic data releases were strong in third quarter, as consumer activity returned to pre-pandemic levels. Economic confidence remained relatively stable around all-time highs as COVID-19 cases declined and economies across Europe reopened. Second quarter Eurozone GDP grew at 2.2% quarter-on-quarter, above initial estimates. Inflation across the Eurozone area reached its highest level since the onset of the global financial crisis. ECB President Christine Lagarde affirmed the central bank will continue to keep monetary policy loose to support the region’s pandemic recovery and promised not to “overreact to [the] transitory supply shocks” that are boosting inflation.
INDEX PERFORMANCE (€)

EURO PERFORMANCE VS VARIOUS CURRENCIES
Sources: Bloomberg Index Services Limited, EPRA, European Banking Federation, FTSE Fixed Income LLC, FTSE International Limited, Intercontinental Exchange, Inc., J.P. Morgan Securities, Inc., MSCI Inc., National Association of Real Estate Investment Trusts, Standard & Poor’s, and Thomson Reuters Datastream. MSCI data provided “as is” without any express or implied warranties.
GBP-Based Investors
Real assets and equities led performance in third quarter. Commodities outperformed amid out-of-sync energy supply/demand dynamics. UK mid caps were also a top performer, outgaining large-cap peers. Developed ex UK equities outgained domestic UK securities, but both topped emerging markets equities, which were the bottom performer. UK high-yield corporate bonds advanced and topped UK investment-grade equivalents. UK investment-grade corporates bested UK gilts, although both declined. Over the past year, commodities and UK mid caps were top performers, while gold and gilts declined the most.
UK sterling mostly depreciated in third quarter, declining the most vis-à-vis safe havens US dollar, Japanese yen, and Swiss franc, and appreciating only versus the Australian dollar and our basket of EM currencies. The pound mostly gained over the past year, advancing the most versus Japanese yen, Swiss franc, and the euro, and declining only vis-à-vis the Canadian dollar.
Economic woes flared up as food, fuel, and labor shortages created headwinds for a sustained recovery, highlighted by retail sales declining throughout the quarter. The Bank of England noted that rising inflation and a higher inflation forecast “appeared to have strengthened” the case for higher interest rates. Backward-looking data were more robust, as second quarter GDP grew 5.5% quarter-on-quarter, outpacing expectations.

INDEX PERFORMANCE (£)
POUND STERLING PERFORMANCE VS VARIOUS CURRENCIES
Sources: Bloomberg Index Services Limited, EPRA, FTSE International Limited, Intercontinental Exchange, Inc., ICE Benchmark Administration Ltd., J.P. Morgan Securities, Inc., MSCI Inc., National Association of Real Estate Investment Trusts, Standard & Poor’s, and Thomson Reuters Datastream. MSCI data provided “as is” without any express or implied warranties.
Performance Exhibits
All data are total returns unless otherwise noted. Total return data for all MSCI indexes are net of dividend taxes.
USD-Based Investors index performance chart includes performance for the Bloomberg US Aggregate Bond, Bloomberg US Corporate Investment Grade, Bloomberg US High Yield Bond, Bloomberg Municipal Bond, Bloomberg US TIPS, Bloomberg US Treasuries, ICE BofAML 91-Day Treasury Bills, FTSE® NAREIT All Equity REITs, J.P. Morgan GBI-EM Global Diversified, LBMA Gold Price, MSCI Emerging Markets, MSCI World, Russell 2000®, S&P 500, and S&P GSCI™ indexes.
EUR-Based Investors index performance chart includes performance for the Bloomberg Euro-Aggregate: Corporate, Bloomberg Pan-Euro High Yield (Euro), EURIBOR 3M, FTSE EMU Govt Bonds, FTSE Euro Broad Investment-Grade Bonds, FTSE® EPRA/NAREIT Europe ex UK RE, J.P. Morgan GBI-EM Global Diversified, LBMA Gold Price AM, MSCI Emerging Markets, MSCI Europe, MSCI Europe ex UK, MSCI Europe Small-Cap, MSCI World ex EMU, MSCI World, and S&P GSCI™ indexes.
GBP-Based Investors index performance chart includes performance for the Bloomberg Sterling Aggregate: Corporate Bond, Bloomberg Sterling Index-Linked Gilts, ICE BofAML Sterling High Yield, FTSE® 250, FTSE® All-Share, FTSE® British Government All Stocks, FTSE® EPRA/NAREIT UK RE, J.P. Morgan GBI-EM Global Diversified, LBMA Gold Price AM, LIBOR 3M GBP, MSCI Emerging Markets, MSCI Europe ex UK, MSCI World, MSCI World ex UK, and S&P GSCI™ indexes.
EM currencies is an equal-weighted basket of 20 emerging markets currencies.
Fixed Income Performance Table
Performance data for US TIPS reflect the Bloomberg US TIPS Index, with yields represented by the Bloomberg Global Inflation Linked Bond Index: US.