Risk assets rallied again in third quarter, notwithstanding declines in September. Emerging markets equities bested developed markets. Global growth stocks outperformed value stocks for the seventh consecutive quarter and large caps edged small caps. High-yield bonds outgained investment-grade corporates and sovereigns as credit spreads narrowed. Real assets were mixed as commodities and REITs advanced, while natural resources equities declined sharply as oil prices were nearly flat. UK sterling and the euro broadly advanced, while the US dollar continued its sell-off, despite a sharp rebound in September.

THIRD QUARTER MAJOR ASSET CLASS PERFORMANCE (%)
Sources: Bloomberg Index Services Limited, Bloomberg L.P., FTSE International Limited, MSCI Inc., and Thomson Reuters Datastream. MSCI data provided “as is” without any express or implied warranties.
Note: Local currency returns for the Bloomberg Barclays indexes, the Bloomberg Commodity Index, and the FTSE® Developed REITs are in USD terms.
The Macro Picture
The risk rally continued, supported by robust global stimulus and further signs of a rebounding global economy. While global equities gained for the quarter, momentum stalled in September when equities experienced their first monthly decline since March. The pullback at the end of the quarter reflected concerns related to a coronavirus resurgence as weather in the northern hemisphere turns colder, risks of waning fiscal support, and political turbulence.
The trajectory of economic recovery has varied by region as some countries grappled with a second wave of infections, forcing tighter restrictions that risk stifling economic activity. Progress toward vaccine development continues to be a source of optimism, but the timing of vaccine rollout remains unclear.
Global stimulus measures have helped buffer the economic fallout from the pandemic, but the future of fiscal support is uncertain. While the US Federal Reserve has taken unprecedented steps to keep monetary policy accommodative, including recent changes to its long-held inflation targeting policy, Fed officials have indicated that additional fiscal support will be necessary for a faster recovery. However, negotiations for an additional spending bill faced a stalemate in Congress. The EU agreed to a breakthrough budget and stimulus package agreement in July, but recent disputes among member states risk delaying the disbursement of funds.
Geopolitical developments also weighed on sentiment as investors prepared for an uncertain US presidential election, and further uncertainty emerged after President Trump tested positive for coronavirus in October. Brexit negotiations between the United Kingdom and EU faced continued obstacles with the transition period deadline approaching.
Equities
US equities bested their developed ex US counterparts, extending their year-to-date outperformance to 16 percentage points (ppts). The S&P 500 Index retraced its entire peak-to-trough drawdown by late August and reached new all-time highs, but performance stumbled in September. In fact, nine of 11 sectors declined in the final month of the quarter. Still, most sectors posted strong performance in the third quarter; ten of 11 sectors advanced, with consumer discretionary, materials, industrials, information technology, and consumer staples all advancing by double digits. Energy was the only sector to decline. Among size and style, large caps and growth stocks bested small caps and value equivalents for the quarter, respectively. Over the past 12 months, large caps have topped small caps by 16 ppts, while growth outperformed value by a staggering 46 ppts, the second widest margin since data began in 1975, exceeded only by August 2020 month-end. Sell-side analysts upgraded their bottom-up forward earnings estimates during the quarter, with the latest consensus EPS for calendar year 2020 indicating a 19% year-over-year decline.
US second quarter GDP declined at a 31.4% annualized rate, better than initially expected, but still the biggest quarterly plunge on record. Manufacturing regained momentum as PMI advanced from steep contractionary readings into expansionary territory and readings of new orders for nondefense capital goods, excluding aircrafts, increased to its highest level in two years. Services PMI also rebounded into expansionary territory. US consumer confidence surged in September, sharply beating expectations and reaching the highest level since March but remains well below pre-crisis levels. The US jobs market continued its sluggish recovery; initial US jobless claims and continuing claims improved significantly from last quarter, but are well above levels reached during the peak of the Global Financial Crisis.
European equities were roughly flat in third quarter, underperforming broader developed markets stocks, which extended year-to-date underperformance vs developed ex Europe shares to 16 ppts. Europe ex UK stocks topped UK equivalents for the seventh consecutive calendar quarter, although both remain firmly negative year-to-date. The European Central Bank (ECB) reported second quarter Eurozone GDP at -11.8% quarter-over-quarter(-39.4% annualized), slightly better than initially expected. Manufacturing activity expanded in third quarter, with July’s survey reading breaking a streak of 17 consecutive months in contractionary territory. Yet, services PMI continued to struggle as preliminary September data indicated the sector fell back into contraction. Headline consumer price inflation slipped into deflationary territory in August, with a reading of -0.2% year-on-year. ECB President Christine Lagarde hinted the central bank may shift its inflation target from “below but close to 2%” to a policy where inflation is permitted to run higher than target for a time to make up for low periods of inflation, similar to policy shift that the Fed announced in August. EU leaders agreed to a groundbreaking budget and stimulus plan in July, but member states are at odds about how to enforce the appropriation of funds.
The United Kingdom experienced the deepest contraction among G7 countries in second quarter, with a preliminary GDP growth estimate of -19.8% quarter-over-quarter (-58.7% annualized), the largest decline since comparable data began in 1955. The Bank of England left its benchmark policy rate unchanged in August, later stating it plans leave monetary policy loose until inflation sustainably returns to target. The most recent round of Brexit negotiations began at the end of third quarter, with many hurdles remaining before the December 31 cutoff.
Japanese equities trailed broad developed markets, but outperformed other major developed ex US markets in both local and major currency terms. Japan’s second calendar quarter GDP declined at a 28.1% annualized rate, the sharpest decrease on record, but less severe than the downturns seen in other G7 countries. Still, this marked the third consecutive quarterly GDP decline in Japan, dating back to fourth quarter 2019, when growth was negatively impacted by an increase in the national sales tax. Shinzo Abe, Japan’s longest-serving Prime Minister, resigned due to health concerns and was quickly replaced by his close lieutenant Yoshihide Suga. The new Prime Minister is expected to stay the course with many of his predecessor’s economic policies.
Emerging markets equities outgained developed peers. In local and major currency terms, heavily weighted emerging Asia outpaced the broader index, while emerging Europe, the Middle East & Africa, and Latin America lagged. Among major countries, Taiwan, India, China, and Korea bested the broader index, while South Africa and Brazil trailed and declined. Frontier markets bested developed counterparts but trailed emerging equivalents.
Chinese equities have outpaced all other emerging countries for the year, as economic data shows continued signs of recovery. China’s second quarter GDP (3.2% year-over-year) grew faster than expected. Official manufacturing PMI readings reached the second-highest expansionary level since mid-2018, while non-manufacturing data reached their strongest levels in almost seven years. Industrial output and exports grew faster than expected in August. Despite the promising economic releases, geopolitical tensions remain a key risk to the recovery. The quarter consisted of a slew of back-and-forth reprisals between the United States and China, including retaliatory closures of consulates, US sanctions on senior officials related to human rights violations and Hong Kong policy, and an ongoing battle concerning Chinese technology in the United States. TikTok, a popular social media app owned by Chinese company ByteDance, became a focal point in the escalating US-China tech war. The United States cited national security concerns and data privacy concerns related to the app and took steps to give a US company more control over the technology, but a potential deal has been complicated by disagreements between both countries.

THIRD QUARTER EQUITY INDEX PERFORMANCE (%)
Sources: MSCI Inc. and Thomson Reuters Datastream. MSCI data provided “as is” without any express or implied warranties.
Fixed Income
Credits, led by high-yield corporates, outperformed sovereign counterparts in third quarter as credit spreads narrowed amid improving corporate outlook. US Treasury yields touched record (or near-record) lows across the entire yield curve before ultimately finishing the quarter near where they began; the yield curve nudged slightly steeper. The ten-year yield advanced 3 basis points (bps) to 0.69%, and the five-year yield declined 1 bp to 0.28%. TIPS outperformed nominal Treasuries, pushing real interest rates into record negative territory as Chairman Jerome Powell announced the Fed unanimously adopted a “flexible form of average targeting,” aiming to achieve an average inflation rate of 2% over time. Tax-exempt municipal bonds continued rebounding, besting nominal US government bonds.
Relative performance for sterling- and euro-denominated bonds mirrored their US counterparts. Ten- and five-year gilt yields rose 6 and 1 bps to 0.26% and -0.06%, respectively, and UK five-year gilt yields briefly turned positive for the first time since early June. Ten-year German bund yields declined 6 bps to -0.52%, while 30-year bund yields finished the quarter in negative territory at -0.09%. UK linkers lagged nominal gilts as fears of potential no-deal Brexit continued to push inflation expectations higher.

THIRD QUARTER BOND INDEX PERFORMANCE (%)
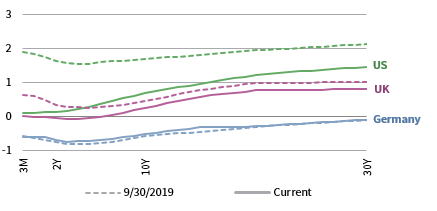
THIRD QUARTER NOMINAL YIELD CURVES

10Y/2Y YIELD CURVE SPLIT
* High-yield index yield data represent option-adjusted spread.
Sources: Bank of England, Bloomberg Index Services Limited, BofA Merrill Lynch, Federal Reserve, FTSE Fixed Income LLC, FTSE International Limited, Intercontinental Exchange, Inc., and Thomson Reuters Datastream.
Real Assets
Commodity futures advanced, led by agriculture and industrial metals.
Oil prices ($40.95 for Brent and $40.22 for WTI) were close to flat for the quarter as demand waned. In August, prices briefly touching their highest levels since March due to fears of potential US supply disruptions as Hurricane Laura approached the US Gulf Coast. The hurricane ultimately caused extensive damage across Louisiana, but refineries along the US energy corridor narrowly avoided significant disruptions.
Global natural resources equities and MLPs experienced steep declines in third quarter and remain deeply in the red year-to-date as investors grapple with what lower oil prices mean for future profitability.
Global developed REITs advanced, led by Europe ex UK REITs and Asia REITs; US REITs also gained but underperformed the broader market, while UK REITs declined. All four REIT markets declined by more than 10% over the past 12 months.
Gold prices ($1,899.84 per troy ounce) advanced for the quarter, but sharply declined from early August all-time highs as the dollar strengthened and real yields rose in September. The yellow metal has been in high demand this year and remains the top-performing asset this year-to-date.

THIRD QUARTER REAL ASSETS PERFORMANCE (%)
* Europe ex UK REITs are in EUR terms and UK REITs in GBP terms.
Sources: Alerian, Bloomberg L.P., EPRA, FTSE International Limited, Intercontinental Exchange, Inc., MSCI Inc., National Association of Real Estate Investment Trusts, Standard & Poor’s, and Thomson Reuters Datastream. MSCI data provided “as is” without any express or implied warranties.
Notes: Total return data for all MSCI indexes are net of dividend taxes. Gold performance based on spot price return.
USD-Based Investors
Equities and gold outperformed in third quarter. Emerging markets stocks outgained broad developed markets equities, while US equities outperformed developed ex US counterparts. The S&P 500 Index retraced its entire peak-to-trough drawdown by late August and reached new all-time highs, but performance stumbled in September. US large caps bested small caps equivalents.
Commodity futures advanced, led by agriculture and industrial metals. US high-yield bonds outperformed investment-grade corporate equivalents and Treasuries. US TIPS and municipal bonds topped nominal Treasuries as real yields fell deeper into negative territory.
The US dollar continued its sell-off against major currencies, falling the most versus UK sterling, the euro, and the Australian dollar; however, declines were less severe vis-à-vis an equal-weighted basket of emerging markets currencies. Over the past year, the greenback has fallen the most versus the Swiss franc, euro, and Australian dollar, and has only strengthened against emerging markets currencies and Canadian dollar.
The risk rally showed signs of fading in September, as equities declined for the first month since March. Investors grew more cautious about the uncertain impacts of fading fiscal stimulus, a resurgence in global COVID-19 cases, and the forthcoming US presidential election.

INDEX PERFORMANCE (US$)
US DOLLAR PERFORMANCE VS VARIOUS CURRENCIES
Sources: Bloomberg Index Services Limited, FTSE International Limited, Frank Russell Company, Intercontinental Exchange, Inc., J.P. Morgan Securities, Inc., MSCI Inc., National Association of Real Estate Investment Trusts, Standard & Poor’s, and Thomson Reuters Datastream. MSCI data provided “as is” without any express or implied warranties.
EUR-Based Investors
Risk assets, led by broad-market equities, advanced the most in third quarter. European small caps, emerging markets stocks, and developed ex EMU—the top-performing asset classes—topped large cap equivalents, developed markets peers, and European equities, respectively. Europe ex UK REITs also posted solid gains for the quarter.
Pan-Euro high-yield bonds outperformed investment-grade corporate and EMU government bonds. Gold advanced and is the top-performing asset class over the past year by a wide margin. Commodity futures slightly gained, led by agriculture and industrial metals, but remain the worst-performing asset class over the last 12 months, declining by nearly a third over that span.
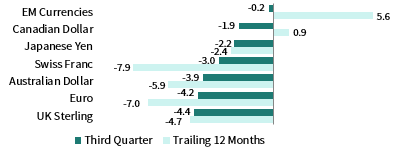
The euro mostly advanced in third quarter, appreciating the most versus the US dollar, an equal-weighted basket of emerging markets currencies, and the Canadian dollar, while declining only against UK sterling. Over the past 12 months, the common currency mostly appreciated, gaining the most vis-à-vis the basket of EM currencies, the Canadian dollar, and the US dollar, and declining only versus the Swiss franc.
The resurgence of COVID-19 cases across much of Europe unsettled markets late in the quarter, as tighter restrictions threaten to stifle economic activity. The EU agreed to a breakthrough budget and stimulus package in July, but negotiations are at loggerheads and the package risks being delayed.
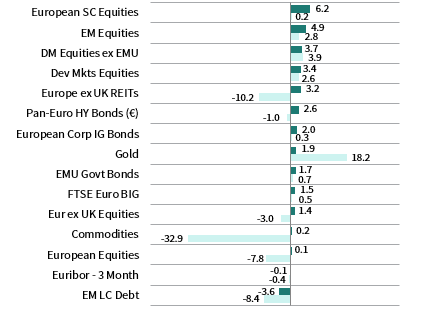
INDEX PERFORMANCE (€)
EURO PERFROMANCE VS VARIOUS CURRENCIES
Sources: Bloomberg Index Services Limited, EPRA, European Banking Federation, FTSE Fixed Income LLC, FTSE International Limited, ICE Benchmark Administration Ltd., J.P. Morgan Securities, Inc., MSCI Inc., National Association of Real Estate Investment Trusts, Standard & Poor’s, and Thomson Reuters Datastream.
GBP-Based Investors
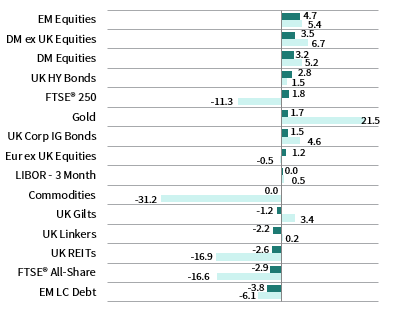
Broad-market equities and high-yield bonds led among major asset classes in third quarter. Emerging markets stocks and developed ex UK equities—the top two performing asset classes—topped developed peers and UK counterparts, respectively. UK mid-caps bested large cap equivalents, while Europe ex UK stocks topped UK equities.
UK high-yield credits topped investment-grade corporate equivalents and UK gilts. Nominal gilts bested UK linkers but both asset classes declined. Gold advanced and remains the top performing asset class over the past 12 months.
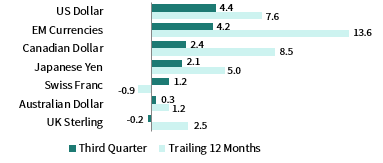
UK sterling strengthened against all major currencies in third quarter, gaining the most versus the US dollar, an equal-weighted basket of emerging markets currencies, and the Canadian dollar. Over the past 12 months, UK sterling was more mixed, advancing the most versus the emerging markets currency basket and the Canadian and US dollars, while declining vis-à-vis the Swiss franc, euro, and Australian dollar.
Brexit negotiations between the United Kingdom and EU faced continued obstacles with the transition period deadline approaching.
INDEX PERFORMANCE (£)

POUND STERLING PERFORMANCE VS VARIOUS CURRENCIES
Sources: Bloomberg Index Services Limited, EPRA, FTSE International Limited, Intercontinental Exchange, Inc., ICE Benchmark Administration Ltd., J.P. Morgan Securities, Inc., MSCI Inc., National Association of Real Estate Investment Trusts, Standard & Poor’s, and Thomson Reuters Datastream.
Performance Exhibits
All data are total returns unless otherwise noted. Total return data for all MSCI indexes are net of dividend taxes.
USD-Based Investors index performance chart includes performance for the Bloomberg Barclays US Aggregate Bond, Bloomberg Barclays US Corporate Investment Grade, Bloomberg Barclays US High Yield Bond, Bloomberg Barclays Municipal Bond, Bloomberg Barclays US TIPS, Bloomberg Barclays US Treasuries, ICE BofAML 91-Day Treasury Bills, FTSE® NAREIT All Equity REITs, J.P. Morgan GBI-EM Global Diversified, LBMA Gold Price, MSCI Emerging Markets, MSCI World, Russell 2000®, S&P 500, and S&P GSCI™ indexes.
EUR-Based Investors index performance chart includes performance for the Bloomberg Barclays Euro-Aggregate: Corporate, Bloomberg Barclays Pan-Euro High Yield (Euro), EURIBOR 3M, FTSE EMU Govt Bonds, FTSE Euro Broad Investment-Grade Bonds, FTSE® EPRA/NAREIT Europe ex UK RE, J.P. Morgan GBI-EM Global Diversified, LBMA Gold Price AM, MSCI Emerging Markets, MSCI Europe, MSCI Europe ex UK, MSCI Europe Small-Cap, MSCI World ex EMU, MSCI World, and S&P GSCI™ indexes.
GBP-Based Investors index performance chart includes performance for the Bloomberg Barclays Sterling Aggregate: Corporate Bond, Bloomberg Barclays Sterling Index-Linked Gilts, ICE BofAML Sterling High Yield, FTSE® 250, FTSE® All-Share, FTSE® British Government All Stocks, FTSE® EPRA/NAREIT UK RE, J.P. Morgan GBI-EM Global Diversified, LBMA Gold Price AM, LIBOR 3M GBP, MSCI Emerging Markets, MSCI Europe ex UK, MSCI World, MSCI World ex UK, and S&P GSCI™ indexes.
EM currencies is an equal-weighted basket of 20 emerging markets currencies.
Fixed Income Performance Table
Performance data for US TIPS reflect the Bloomberg Barclays US TIPS Index, with yields represented by the Bloomberg Barclays Global Inflation Linked Bond Index: US.