Global equities posted modest returns in third quarter as central banks eased, global economic outlook weakened, and corporate earnings declined. Developed markets stocks outperformed emerging markets equivalents, while the US outpaced global ex US. Growth equities outgained value, and large caps bested small caps. Global corporate investment-grade bonds outpaced government and high-yield bonds as yields broadly fell. Among real assets, commodity futures and natural resources equities declined, while REITs and gold prices advanced. Of major currencies, the US dollar appreciated, the euro weakened, and UK sterling was mixed.
It was a turbulent environment for risk assets in third quarter, as investors wrestled with global trade concerns, political uncertainties, and increasingly pessimistic economic data. Global central banks shifted to dovish policy in support of risk appetite, led by the Federal Reserve, which cut its benchmark interest rate 25 basis points (bps) in July—its first since 2008—and again in September. The European Central Bank (ECB) followed suit, delivering a more aggressive stimulus by cutting interest rates and resuming quantitative easing. Moreover, the Bank of Japan (BOJ) left interest rates in negative territory and indicated that it would respond aggressively to economic weakness, perhaps as early as its next meeting in October. The US-China trade conflict continued to loom large over the world economy, as the United States officially labeled China a currency manipulator after China allowed the yuan to depreciate beyond the seven-per- dollar threshold and a series of tit-for-tat tariffs fueled market volatility. Germany’s economy faltered as its manufacturing numbers sank to the lowest levels since 2009 and the weakness appeared to be spreading to the services sector, weighing on the broader Eurozone. The United Kingdom’s planned departure from the EU remained unclear. Newly elected Prime Minister Boris Johnson’s controversial decision to suspend Parliament was overruled by the nation’s top court; legislation designed to stop a “no-deal” Brexit on October 31 passed. Yet, a wide range of potential outcomes remain in play. Global corporate earnings growth expectations for 2019 declined to just less than 2%, significantly below the double-digit marks seen the previous two years, as second quarter earnings growth was negative in most regions and third quarter estimates steadily declined. Yet, despite fault lines in the longest economic expansion on record, global equities advanced for the quarter and have gained well into the double digits year-to-date.
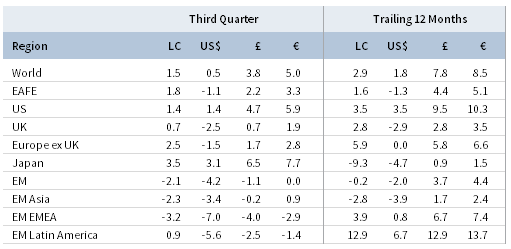
TOTAL RETURN FOR MSCI INDEXES (%)
US equities (1.7% for the S&P 500 Index) reached new all-time highs during the quarter and outgained the broader developed markets for the third consecutive quarter. US stocks gained 20.6% year-to-date through September, the best performance in the first three quarters of the year since 1997, outperforming all major equity regions. Eight of 11 sectors delivered positive returns, led by defensive and interest rate sensitive utilities, real estate, and consumer staples; energy, healthcare, and materials declined. Growth edged value for the quarter despite a surge in value performance in September, and large caps bested small caps. Second quarter year-over-year earnings per share (EPS) growth for the S&P 500 finished at -0.4%—better than expected, but negative for the second consecutive quarter, marking a technical “earnings recession” for the first time since early 2016. Third quarter earnings are estimated to decline 3.8% and thus far, a greater-than-usual proportion of companies have issued negative EPS guidance. US economic growth decelerated to a 2.0% annualized rate in second quarter, down from first quarter and below earlier estimates, but above the Fed’s long-run growth expectation; it was driven by strong growth in consumer spending, which represents roughly 70% of overall US GDP. At the Fed’s annual symposium in Jackson Hole in August, Chairman Jerome Powell noted that the global economic outlook “has been deteriorating” —a sentiment echoed in official communications for the Fed’s two 25 bp rate cuts during the quarter—and added that the Fed will act as appropriate to sustain the current economic expansion. However, dissent among voting members of the Fed’s Open Market Committee left investors questioning the future path of interest rate changes. Business-oriented data felt the impact of the global economic outlook deterioration, as industrial production unexpectedly declined, the manufacturing outlook dipped to its lowest level in nearly ten years, and services activity growth slowed more than expected. The two major consumer outlook surveys were volatile in third quarter, but remain quite favorable.
European equities (-1.8% in USD, 2.6% in EUR, 1.4% in GBP) underperformed broader developed markets in major currency terms amid ongoing economic weakness and declining growth outlook. Europe ex UK stocks outperformed UK equivalents since the latter was impacted by Brexit unpredictability, which came to a head as newly elected Prime Minister Boris Johnson’s prorogue of Parliament was rebuffed, making his earlier pledge to leave the EU on October 31 “no matter what” less certain. UK second quarter GDP growth fell into negative territory due to declining trade and weakening business outlook, its first quarterly decline since fourth quarter 2012. Quarter-on-quarter GDP growth in the Eurozone was barely positive, growing at its slowest pace since second quarter 2014. Economic data turned markedly weak as consumer confidence fell further negative, industrial production slid more than expected, and a widely followed business climate measure turned negative for the first time since fourth quarter 2013. Eurozone powerhouse Germany experienced particularly negative data, where already below-target inflation slowed, exports declined, and manufacturing and business sentiment fell further into contractionary territory. German GDP growth turned negative, compelling the Bundesbank, Germany’s central bank, to warn that the country is likely to enter a recession in third quarter. Elsewhere in the Eurozone, Italy’s government collapsed over a disagreement between the Northern League and 5 Star Movement parties about whether to trigger an early election, leading to a new coalition government between the 5 Star Movement and the Democratic Party; the new government is broadly seen as a more moderatecoalition. European corporate earnings reported negative growth in second quarter, but above earlier expectations.
Japanese equities (3.1% in USD, 7.7% in EUR, 6.5% in GBP) bested all major equity markets in both local and major currency terms during third quarter, but remain a laggard year-to-date. Japanese corporate EPS growth fell for the third consecutive quarter, the biggest decline since calendar second quarter 2016. Fiscal year 2019 EPS growth is now expected to be negative. Japanese GDP growth surprised to the upside at a 1.3% seasonally adjusted annual rate, well above the consensus 0.5% estimate. The BOJ kept benchmark interest rates steady at -0.1% and reaffirmed its pledge not to raise interest rates before at least spring 2020. The central bank strengthened its commitment to addressing risks to the economy from abroad that threaten momentum toward its long-sought-after 2% inflation goal. BOJ Governor Haruhiko Kuroda signaled a possibility that the central bank could expand stimulus at its next policy meeting in October, noting weakening exports, industrial output, and manufacturing sentiment as challenges. The political dispute between Korea and Japan heated up as, among other escalations, the former scrapped its intelligence sharing agreement with the latter after Japan placed export restrictions on Korea—its third-largest export partner behind the United States and China. Prime Minister Shinzo Abe’s Liberal Democratic Party (LDP) lost its super majority in July’s parliamentary elections; however, the LDP still maintains a significant majority and is expected to continue economic policies colloquially referred to as “Abenomics.”
Emerging markets equities (-4.2% in USD, 0.0% in EUR, -1.1% in GBP) weakened and underperformed developed markets counterparts for the third consecutive quarter. Latin America outperformed heavily weighted emerging Asia in local currency terms, but underperformed in major currency terms due to sharp depreciation in the Brazilian real; emerging Europe, the Middle East & Africa was the worst- performing region. China, which constitutes about one-third of the index, declined and underperformed the broader market. The world’s second-largest economy reported second quarter GDP growth of 6.2%, as the effects of the trade spat continued to weigh on the economy; foreign direct investment growth, industrial output, and retail sales slowed. Among other large emerging markets, Taiwan and Brazil advanced, Korea declined, but outperformed the broader emerging index, while India and South Africa underperformed. Argentina, which was promoted to the MSCI Emerging Markets Index at the end of May 2019, declined nearly 50% in major currency terms after reformist president Mauricio Macri’s unanticipated defeat in primary elections, and the country defaulted on its sovereign debt for the ninth time. Frontier equity markets (-1.1% in USD, 3.3% in EUR, 2.1% in GBP) bested emerging markets equivalents.
Real assets performance was mixed in second quarter. Commodity futures (-1.8% for the Bloomberg Commodity TR Index and -4.2% for the energy-heavy S&P GSCI™ Index) declined due to energy and agriculture, but were supported by precious metals. Oil prices ($60.78 for Brent and $54.07 for WTI) fell to their lowest levels since early January after briefly spiking when a drone attack on state-owned Saudi Aramco infrastructure temporarily cut the world’s largest oil-exporting nation’s output by more than half. Despite initial uncertainty, Aramco was able to meet its September shipments and managed to restore its full production capacity within a few weeks. Global natural resources equities (-6.4% for the MSCI World Natural Resources Index in USD terms) and energy MLPs (-5.0%) underperformed broader equities amid declining energy prices and softening global economic growth outlook. Global developed REITs (4.9% in USD terms) advanced, led by Europe ex UK REITs (9.2%) and US REITs (7.7%); UK REITs (6.4%) gained, but underperformed broader developed REITs, while Asia REITs (-0.5% in USD terms) declined. Gold prices (4.4%) rose to $1,473.85 per troy ounce as global economic and geopolitical fears deepened; the yellow metal has appreciated 23.7% over the past year, its largest 12-month gain at quarter-end since September 2011.
Fixed income assets advanced in third quarter as central banks eased, the economic outlook deteriorated, and negative yielding debt reached all-time highs. US corporate investment-grade (3.0%) outgained Treasuries (2.4%) and high-yield (1.3%) bonds. Five- and ten-year Treasury yields declined 21 bps and 32 bps to 1.55% and 1.68%, respectively, and the 30-year yield briefly touched an all-time low during the quarter. The ten-year minus three-month yield curve moved further negative and has remained inverted for 92 of the past 93 trading days. The benchmark ten-year minus two-year yield curve, another closely watched yield curve inversion indicator, briefly turned negative for the first time since June 2007, but finished the month positive. UK gilts (6.2%) gained, besting UK investment-grade corporate (4.0%) and high-yield (1.9%) bonds. Five- and ten-year gilt yields declined 36 bps and 43 bps to 0.25% and 0.46%, respectively. EMU government bonds (3.8%) gained as German ten-year bund yields continued their slide deeper into negative territory, finishing the month at -0.57%. Notably, German 30-year yields turned negative for the first time. Despite a struggling economy and domestic political turmoil, Italian ten-year government bond yields fell below 1% for the first time ever. Denmark became the first country ever to have its entire yield curve turn negative, but was quickly joined by Switzerland after the Swiss 50-year government bond yield also turned negative. Total global negative yielding investment-grade debt touched a new record of US$17 trillion during the quarter, which accounted for 30% of all outstanding global debt by market value, and now includes some investment-grade corporates, high-yield corporates, and euro-denominated emerging markets bonds. US Treasuries outpaced TIPS (1.3%) and tax-exempt municipal bonds (1.6%). UK linkers (7.8%) bested nominal gilts.
Among major currencies, the US dollar appreciated, the euro depreciated, and UK sterling was mixed. The greenback gained the most vis-à-vis the euro, Australian dollar, and our equal-weighted basket of EM currencies. During the past 12 months, only the Japanese yen has strengthened against the US dollar. The euro declined the most against the US dollar, Japanese yen, and Canadian dollar. The common currency is stronger against only the Australian dollar over the past year. UK sterling gained against the euro, Australian dollar, and our basked of EM currencies, but fell vis-à-vis safe-haven currencies—the US dollar, Japanese yen, and Swiss franc—as well as the Canadian dollar. Over the past year, UK sterling has been broadly weaker, besting only the euro and Australian dollar.
Market Exhibits
Yields declined in third quarter amid central bank easing and weakening global economic outlook. A key portion of the US Treasury curve, the ten-year rate minus three-month rate yield curve, has been negative for 92 of the last 93 trading days, generating market attention given its history as a recession prerequisite.
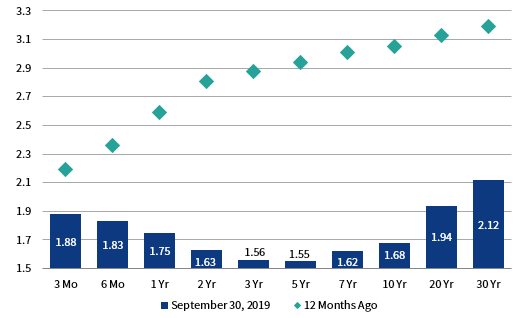
YIELD CURVE COMPARISON
As of September 30, 2019
Sources: Federal Reserve and Thomson Reuters Datastream.
Global manufacturing data has weakened in recent months as the US-China trade war has sowed uncertainty into major supply chains, but other major economies are also experiencing a downturn. The Eurozone, and particularly powerhouse Germany, have seen manufacturing plunge deeply into contractionary territory.
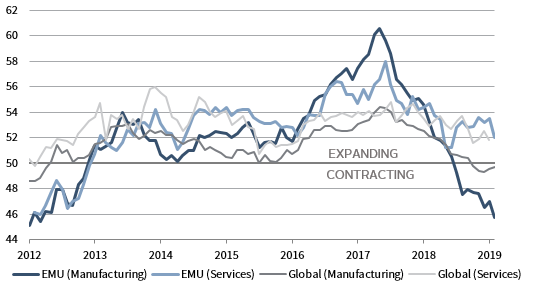
GLOBAL & EUROZONE MANUFACTURING & SERVICES PMIs
August 31, 2012 – September 30, 2019
Sources: J.P. Morgan Securities, Inc., Markit Economics, and Thomson Reuters Datastream.
Notes: EMU and Global PMI data for September are flash estimates. Global (Services) PMI data are as of August.
After two years of double-digit growth, global corporate earnings experienced declines in second quarter and are expected to decline in third quarter 2019, leading analysts to revise calendar year 2019 EPS growth projections to just less than 2%.

MSCI ACWI CALENDAR YEAR EARNINGS GROWTH
2011–19 • Percent (%) • US Dollar
Sources: I/B/E/S, MSCI Inc., and Thomson Reuters Datastream. MSCI data provided “as is” without any express or implied warranties.
Note: MSCI ACWI Index calendar year 2019 earnings growth estimates are as of September 27.
Investors rotated away from growth and into value in September, weighing on momentum stocks, which underperformed against all major factors in September. Value gained 4.1% in the month, but still lags growth and momentum over the past 12 months.
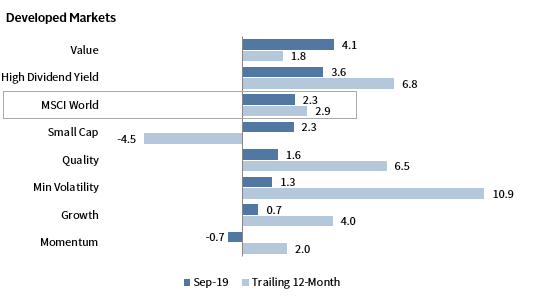
GLOBAL EQUITY PERFORMANCE BY STYLE/FACTOR
As of September 30, 2019 • Local Currency • Percent (%)
Sources: MSCI Inc. and Thomson Reuters Datastream. MSCI data provided “as is” without any express or implied warranties.
Note: Total return data for all MSCI indexes are net of dividend taxes.
Currency Performance as of September 30, 2019
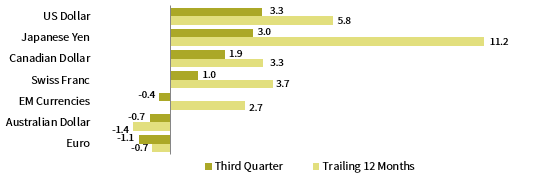
The US dollar broadly appreciated in third quarter, gaining the most versus the euro, Australian dollar, and our equal-weighted basket of EM currencies. Over the past 12 months, only the Japanese yen has strengthened against the US dollar.

VERSUS THE US DOLLAR
Total Return (%)
The euro declined versus all major developed and emerging currencies we track, weakening the most against the US dollar, Japanese yen, and Canadian dollar in third quarter. The common currency is stronger against only the Australian dollar over the past year.

VERSUS THE EURO
Total Return (%)
UK sterling gained against the euro, Australian dollar, and our basket of EM currencies, but fell vis-à-vis safe- haven currencies—US dollar, Japanese yen, and Swiss franc—as well as the Canadian dollar. Over the past 12 months, UK sterling is broadly weaker, gaining in value relative only to the euro and Australian dollar.
VERSUS THE POUND STERLING
Total Return (%)
Note: EM currencies is an equal-weighted basket of 20 currencies.
USD Market Performance as of September 30, 2019
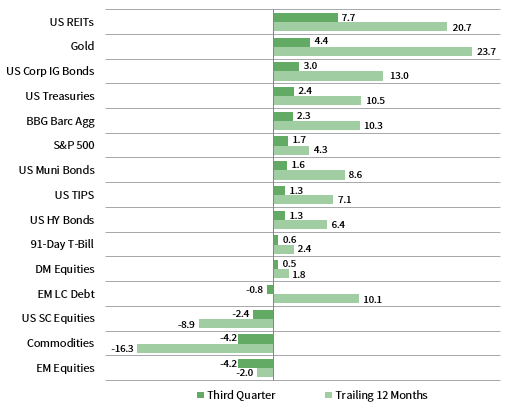
US REITs, gold, and bonds were top performers in third quarter as yields moved lower. US equities outperformed developed counterparts, and domestic large caps bested small caps. IG corporates outgained Treasuries and HY. Commodities and EM equities declined the most amid USD strength.
INDEX PERFORMANCE (US$)
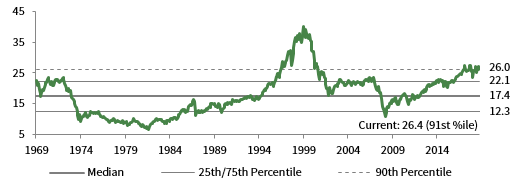
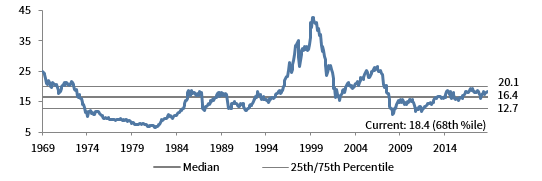
COMPOSITE NORMALIZED P/E: MSCI US
December 31, 1969 – September 30, 2019

FIXED INCOME YIELDS
September 2018 – September 2019
Sources: Bloomberg Index Services Limited, Bloomberg L.P., BofA Merrill Lynch, FTSE International Limited, Frank Russell Company, J.P. Morgan Securities, Inc., MSCI Inc., National Association of Real Estate Investment Trusts, Standard & Poor’s, and Thomson Reuters Datastream. MSCI data provided “as is” without any express or implied warranties.
Euro Market Performance as of September 30, 2019
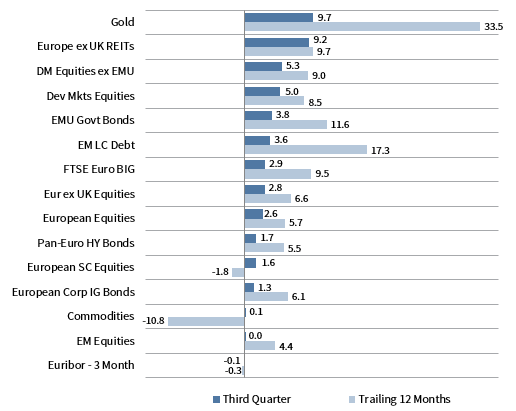
Gold, Europe ex UK REITs, and bonds were among the top performers in third quarter as safe-haven assets outperformed. EMU government bonds bested corporate IG and HY. European equities underperformed broader developed markets. Commodities and emerging markets equities were among the laggards.
INDEX PERFORMANCE (€)
COMPOSITE NORMALIZED P/E: MSCI EUROPE EX UK
December 31, 1969 – September 30, 2019
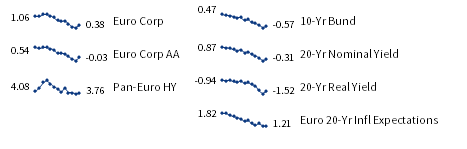
FIXED INCOME YIELDS
September 2018 – September 2019
Sources: Bloomberg Index Services Limited, Bloomberg L.P., Citigroup Global Markets, EPRA, FTSE International Limited, J.P. Morgan Securities, Inc., MSCI Inc., National Association of Real Estate Investment Trusts, Standard & Poor’s, and Thomson Reuters Datastream. MSCI data provided “as is” without any express or implied warranties.
GBP Market Performance as of September 30, 2019
Gold, sovereigns, and UK REITs were top performers in third quarter. UK equities lagged developed markets counterparts. Linkers outgained nominal gilts, investment-grade corporates, and high-yield bonds. Domestic equities were among the worst-performing asset classes, along with commodities and EM equities.

INDEX PERFORMANCE (₤)

COMPOSITE NORMALIZED P/E: MSCI UK
December 31, 1969 – September 30, 2019
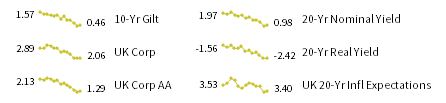
FIXED INCOME YIELDS
September 2018 – September 2019
Sources: Bloomberg Index Services Limited, Bloomberg L.P., BofA Merill Lynch, EPRA, FTSE International Limited, J.P. Morgan Securities, Inc., MSCI Inc., National Association of Real Estate Investment Trusts, Standard & Poor’s, and Thomson Reuters Datastream. MSCI data provided “as is” without any express or implied warranties.
Exhibit Notes
Performance Exhibits
Total return data for all MSCI indexes are net of dividend taxes.
US dollar index performance chart includes performance for the Bloomberg Barclays Aggregate Bond, Bloomberg Barclays Corporate Investment Grade, Bloomberg Barclays High-Yield Bond, Bloomberg Barclays Municipal Bond, Bloomberg Barclays US TIPS, Bloomberg Barclays US Treasuries, BofA Merrill Lynch 91-Day Treasury Bills, FTSE® NAREIT All Equity REITs, J.P. Morgan ELMI+, J.P. Morgan GBI-EM Global Diversified, MSCI Emerging Markets, MSCI World, Russell 2000®, S&P 500, and S&P GSCI™ indexes.
Euro index performance chart includes performance for the Bloomberg Barclays Euro-Aggregate: Corporate, Bloomberg Barclays Pan-Euro High Yield, Citigroup EMU Govt Bonds, Citigroup Euro Broad Investment-Grade Bonds, Euribor 3-month, FTSE® EPRA/NAREIT Europe ex UK, J.P. Morgan ELMI+, J.P. Morgan GBI-EM Global Diversified, MSCI Emerging Markets, MSCI Europe, MSCI Europe ex UK, MSCI Europe Small-Cap, MSCI World ex EMU, MSCI World, and S&P GSCI™ indexes.
UK sterling index performance chart includes performance for the Bloomberg Barclays Sterling Aggregate: Corporate Bond, BofA Merrill Lynch Sterling High Yield, FTSE® 250, FTSE® All-Share, FTSE® British Government All Stocks, FTSE® British Government Index-Linked All Stocks, FTSE® EPRA/NAREIT UK RE, J.P. Morgan ELMI+, J.P. Morgan GBI-EM Global Diversified, LIBOR 3M GBP, MSCI Emerging Markets, MSCI Europe ex UK, MSCI World, MSCI World ex UK, and S&P GSCI™ indexes.
Valuation Exhibits
The composite normalized P/E ratio is calculated by dividing the inflation-adjusted index price by the simple average of three normalized earnings metrics: ten-year average real earnings (i.e., Shiller earnings), trend-line earnings, and return on equity–adjusted earnings. We have removed the bubble years 1998–2000 from our mean and standard deviation calculations. All data are monthly.
Fixed Income Yields
US fixed income yields reflect Bloomberg Barclays Municipal Bond Index, Bloomberg Barclays US Corporate High Yield Bond Index, Bloomberg Barclays US Corporate Investment-Grade Bond Index, and the ten-year Treasury.
European fixed income yields reflect the BofA Merrill Lynch Euro Corporate AA Bond Index, BofA Merrill Lynch Euro Corporate Bond Index, Bloomberg Barclays Pan-European Aggregate High Yield Bond Index, Bloomberg Twenty-Year European Government Bond Index (nominal), ten-year German bund, 20-year European Inflation Swaps (inflation expectations), and the real yield calculated as the difference between the inflation expectation and nominal yield.
UK sterling fixed income yields reflect the Bank of England 20-year nominal yields, Bloomberg Generic UK 20-year inflation-linked (real) yields, ICE BofAML Sterling Corporate AA Bond Index, ICE BofAML Sterling Corporate Bond Index, and UK ten-year gilts.