Developed markets equities and high-yield bonds led capital markets returns in third quarter, as US stocks outperformed on superior macroeconomic and corporate earnings growth. In stark contrast, emerging markets equities entered a technical bear market, underperforming developed markets equivalents as index heavyweight China lagged. Large caps outperformed small caps on a global basis after trailing most of the year; however, while US growth stocks continued to outperform value counterparts, the latter fared better outside the United States, including strong value outperformance in emerging markets. Sovereign bonds broadly declined in contrast to strong gains for high yield, which outperformed investment-grade equivalents amid renewed risk appetite and spread tightening for corporate credits overall. Global natural resources equities were flat as commodities were mixed; metals prices fell, but energy commodities gained as oil continued to rally. Developed REITs were also mostly flat, despite pressure from rising bond yields, except for UK REITs, which declined amid heightened Brexit uncertainties. Currency movements generally continued year-to-date trends—the US dollar gained, the euro was mixed, and UK sterling depreciated, while several EM currencies depreciated sharply versus the US dollar.
Third quarter market performance reflected, in part, the recent divergence between the quickening US economy and the moderate cyclical slowdown happening in the rest of the world—in contrast to the more synchronized global acceleration observed last year. Other factors include tightening liquidity, a more challenged global trade outlook, and rising political and policymaking risks. Yet, despite an expansion that is now well advanced and increased threats to the global outlook, the overall macroeconomic backdrop remains fairly healthy. Monetary policy remains accommodative outside the United States, and growth is still above potential in the world’s major economies. Absent a major policy mistake or an exogenous geopolitical shock, risks of near-term recession remain low, and this cycle could have further legs. Still, investors have continued to mostly favor relative safety and stability irrespective of valuations, which has reinforced market performance disparities between, for example, US and non-US equities and between growth and value stocks. Although further divergence between the United States and the rest of the world would likely reinforce these trends, if some of the current uncertainties facing capital markets were to fade over the coming months, the greater near-term risk could be for investors trying to chase recent winners.
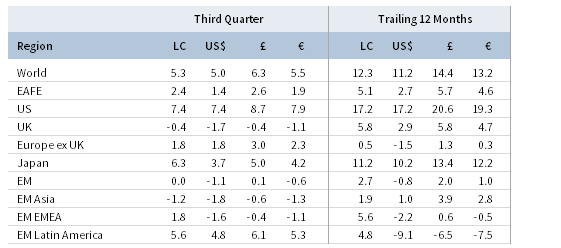
TOTAL RETURN FOR MSCI INDEXES (%)
US equities (7.7% for the S&P 500 Index) outperformed global ex US counterparts and delivered the best quarterly return since fourth quarter 2013. US stocks hit fresh all-time highs during the quarter, the current bull market (which began on March 9, 2009) became the longest on record, and two companies—Apple and Amazon—were the first in market history to trade above a $1 trillion market capitalization. Large caps outperformed small caps after underperforming earlier this year, while growth outperformed value for the seventh consecutive quarter. All 11 S&P 500 sectors were in the black for the quarter, led by health care, industrials, and communication services,[1]On September 24, 2018, S&P Dow Jones implemented a significant reclassification of the Global Industry Classification System (GICS) in its equity indexes; the former telecommunications services … Continue reading while the commodity-driven materials and energy sectors delivered only marginally positive returns. At 25%, second quarter earnings per share (EPS) growth far surpassed global peers as the US economy accelerated with second quarter GDP growth of 4.2% annualized, underscored by healthy consumer spending, net trade, and business investment on the back of loose fiscal policy and rising trade tensions. The US labor market continued to tighten as the monthly average initial jobless claims fell to the lowest level since 1969 and as annual wage growth rose to the highest pace since 2009. Consumer confidence hit an 18-year high and small businesses reported the highest optimism levels on record. Growth and sentiment at or near cycle-to-date peaks, combined with record share buybacks, helped drive the US rally. Against this backdrop, the Fed raised rates at its late-September meeting as widely expected, removing references to monetary policy being “accommodative” from its policy statement.
European equities (0.8% in USD, 1.3% in EUR, and 2.1% in GBP) advanced but underperformed broader developed markets as gains for Europe ex UK stocks were offset by losses from UK counterparts. Meanwhile, EMU stocks were relatively flat. Although year-over-year EPS growth for second quarter was reported in the low double-digits, signaling healthy corporate fundamentals, heightened political risk was a key theme for European equity performance in third quarter. The possibility of a no-deal Brexit increased in September after EU leaders rejected the UK government’s “Chequers” proposal at a summit in Salzburg, Austria; the document had already caused two high-level UK cabinet officials—the May administration’s most senior Brexit leaders—to resign in early July, just after the proposal was announced. On the Continent, the new Italian government’s coalition partners officially agreed on a 2019 budget targeting a 2.4% fiscal deficit. The proposal remains within the EU threshold but calls for higher spending levels than earlier announced, prompting fears concerning the sustainability of Italy’s high debt load. Earlier in the quarter, the Bank of England raised rates, as widely expected, while the European Central Bank (ECB) signaled low rates well into next year while confirming a wind-down of its Asset Purchase Program by year end. Notably, however, the ECB will continue reinvesting proceeds from maturing bonds for the foreseeable future. Despite signs of cooling economic growth in Europe, composite PMI data remain squarely in expansion territory.
Japanese equities (3.7% in USD, 4.2% in EUR, and 5.0% in GBP) rallied, underperforming US stocks but outperforming global ex US counterparts, and Japan’s year-to-date performance moved into positive territory despite yen weakness. Calendar second quarter EPS grew 9% year-over-year, above analyst estimates, but marked the slowest pace in nearly two years. Prime Minister Shinzo Abe was re-elected as leader of the ruling Liberal Democratic party, putting him on track to become Japan’s longest-serving prime minister despite recent political scandals. Japan’s economy bounced back in second quarter, recording GDP growth of 3.0% annualized following a mild contraction in first quarter. Consumer spending was robust, and wage growth rose to the highest level in more than 20 years as the Japanese labor market firmed. Industrial production increased in August for the first time in four months, but Japanese exports remain pressured by continued global trade tensions. The Bank of Japan slightly modified its monetary policy framework during the quarter in an effort to bolster the banking system, which pushed up local yields.
Emerging markets equities (-1.1% in USD, -0.6% in EUR, and 0.1% in GBP) entered a bear market and underperformed developed counterparts—China’s economic slowdown, the stronger US dollar, heightened trade tensions, and external deficit funding concerns all weighed on sentiment and returns. Among emerging regions, in major currency terms, Latin America outperformed, while emerging Europe, the Middle East & Africa, and heavily weighted emerging Asia lagged. Chinese equities sold off over 6% in major currency terms and now trail broad EM equities year-to-date, as trade tensions with the United States intensified, economic activity cooled, and the once high-flying Chinese information technology sector came under pressure. In response, Chinese authorities eased fiscal and monetary policies in an effort to support domestic growth. Among other large markets, South Africa and India declined in major currency terms as the former’s economy entered a technical recession. Brazil and Mexico drove Latin America’s outperformance, while Taiwan and Russia also outperformed. Turkey, a small component of the overall index, sold off around 20% in major currency terms but pared earlier, deeper losses after the central bank aggressively raised rates and the lira rallied. Frontier markets equities (-2.0% in USD, -1.5% in EUR, and -0.8% in GBP) lagged global counterparts due in part to heavily weighted Argentina’s request for expedited and increased bailout funds from the International Monetary Fund, which caused the Argentine peso to depreciate further.
Real assets performance was mixed, highlighted by the divergence in metals and energy prices. Returns for commodity futures (-2.0% for the Bloomberg Commodity TR Index and 1.3% for the energy-heavy S&P GSCI™ Index) depended on index construction; energy buoyed returns, while metals and agriculture detracted due to the potential for trade rifts to weaken global economic growth. Crude oil prices ($82.72 for Brent and 73.25 for WTI) rose late in the quarter (following earlier declines), with Brent hitting its highest level since 2014 as OPEC and non-OPEC countries ruled out raising production limits to offset lost supply from Iran and Venezuela. Energy MLPs (6.6%) was the top-performing real assets category on favorable entity consolidation activity and underlying commodity price strength, but natural resources equities (-0.2% for the MSCI World Natural Resources Index in USD) were weighed down by metals and mining stocks. Developed markets REITs (-0.2% in USD) felt pressure from rising bond yields; US REITs (0.5%) and Europe ex UK REITs (0.4%) outperformed UK REITs (-5.0%) as UK assets broadly declined due to rising Brexit risks. Gold prices (-4.8%) continued to fall and ended the quarter at $1,191.49/ounce, the lowest quarterly close in nearly two years.
Government bond yields in major developed markets increased as growth and inflation expectations firmed and central banks continued to slowly dial back stimulus. US Treasuries (-0.6%) fell as one- and three-month Treasury bill yields both eclipsed 2%, while ten-year yields increased to above 3%. The benchmark ten-year versus two-year yield spread fell to 24 basis points (bps) by quarter end but was as low as 18 bps intra-quarter. Five- and ten-year yields climbed 21 bps and 20 bps to end the quarter at 2.94% and 3.05%, respectively. UK gilts (-1.7%) also declined as five- and ten-year gilt yields backed up 18 bps each to 1.15% and 1.57%, respectively. Likewise, EMU government bonds (-1.1%) declined as spreads on Italian government bonds widened to the highest level in five years and as the ECB reaffirmed its planned Asset Purchase Program wind down. US credit spreads tightened as high-yield (2.4%) and investment-grade (1.0%) corporate bonds outperformed Treasuries—in fact, US high-yield credit spreads ended the quarter at the lowest level since mid-2007. US TIPS (-0.8%) underperformed nominal Treasuries, but tax-exempt municipal bonds (-0.2%) outperformed. UK linkers (-1.2%) declined less than nominal gilts as sterling weakness prompted renewed inflation concerns.
The US dollar gained against all but the Canadian dollar and Swiss franc, appreciating the most against the Japanese yen, an equal-weighted EM currency basket, and the Australian dollar, all of which were broadly weaker in third quarter. The greenback appreciated against the vast majority of global currencies over the past year, strengthening the most vis-à-vis the Australian dollar and EM currencies. The euro was mixed last quarter, advancing versus the Japanese yen, EM currencies, Australian dollar, and UK sterling, but weakening versus the Canadian dollar, Swiss franc, and US dollar. The common currency was also mixed over the past year, gaining relative to the Australian and Canadian dollars, UK sterling, and EM currencies, but depreciating against the safe-haven Japanese yen, Swiss franc, and US dollar, particularly the latter. UK sterling was generally weaker last quarter, falling relative to the Canadian dollar, Swiss franc, US dollar, and euro, but moving higher against broadly weaker counterparts. UK sterling mostly depreciated over the past year, particularly against the US dollar and Japanese yen. Most EM currencies weakened relative to the US dollar last quarter—most notably the Turkish lira, Indian rupee, Russian ruble, Indonesian rupiah, Chinese yuan, Brazilian real, and South African rand—in contrast, the Mexican peso (5.1%) strengthened as the United States and Mexico announced a new trade agreement to replace NAFTA.
Market Exhibits
US/China trade relations further deteriorated in third quarter as import tariffs on roughly $360B of goods came into effect and negotiations stalled. In contrast, the US eased trade tensions with several other major partners—Canada, the European Union, Mexico, and South Korea.

THE US-LED TRADE WAR: A SUMMARY OF KEY DEVELOPMENTS
As of September 30, 2018
Sources: Bloomberg, L.P., International Monetary Fund, Peterson Institute for International Economics, and Thomson Reuters Datastream.
Global equity performance further diverged last quarter; US equities significantly outperformed on strong macroeconomic and corporate results, while EM equities entered a bear market, partly due to a strong dollar, rising interest rates, and trade tensions. DM ex US equities also underperformed the United States by a wide margin year-to-date.
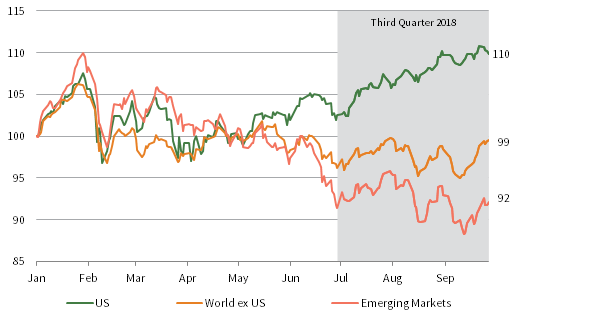
YEAR-TO-DATE EQUITY MARKET CUMULATIVE TOTAL RETURNS
January 1, 2018 – September 30, 2018 • December 31, 2017 = 100
Sources: MSCI Inc. and Thomson Reuters Datastream. MSCI data provided “as is” without any express or implied warranties.
Notes: US, World ex US, and Emerging Markets are represented by MSCI US Index, MSCI World ex US Index, and MSCI Emerging Markets Index, respectively. Returns for all MSCI indexes are net of dividend taxes in USD terms.
For 2018, US earnings per share (EPS) growth is expected to surpass 20%, bolstered by economic strength, tax cuts, and share buybacks. While EPS growth is expected to slow from here, the 2019 EPS growth outlook generally remains healthy across the major equity regions.

CALENDAR YEARS 2017, 2018 & 2019 EPS GROWTH ESTIMATES FOR SELECT REGIONS
Percent (%)
Sources: I/B/E/S, MSCI Inc., and Thomson Reuters Datastream. MSCI data provided “as is” without any express or implied warranties.
Notes: Data are weekly. Global and EM estimates are in USD terms and reflect the impact of currency fluctuations. All other regional estimates are in local currency terms. Annual EPS estimates for Japan are for the fiscal year starting April 1 of the associated calendar year and ending March 31 of the subsequent calendar year.
US IG bonds treaded water as Treasuries declined and corporate IG bonds advanced, while HY bonds outperformed. Concerns over Italy’s debt and the coming wind down of ECB quantitative easing translated into losses for euro IG bonds. EM contagion was largely contained as USD-denominated sovereign bonds rebounded.
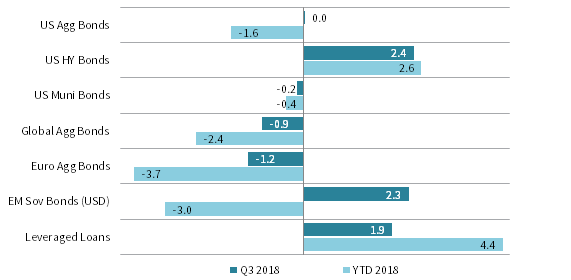
FIXED INCOME MARKET SUMMARY: Q3 AND YTD 2018 RETURNS
As of September 30, 2018 • US Dollar • Percent (%)
Sources: Bloomberg Index Services Limited, Credit Suisse, J.P. Morgan Securities, Inc., and Thomson Reuters Datastream.
Notes: Asset classes represented by: Bloomberg Barclays US Aggregate Bonds Index (US Agg Bonds), Bloomberg Barclays US Corporate High Yield Bond Index (US HY Bonds), Bloomberg Barclays Municipal Bond Index (US Muni Bonds), Bloomberg Barclays Global Aggregate Bond Index (Global Agg Bonds), Bloomberg Barclays European Aggregate Bond Index (Euro Agg Bonds), J.P. Morgan EM Bond Index Global Diversified (EM Sov Bonds [USD]), and Credit Suisse Leveraged Loan Index (Leveraged Loans).
Currency Performance as of September 30, 2018
The US dollar generally appreciated in third quarter, gaining the most against the Japanese yen, an equal-weighted EM currency basket, and the Australian dollar; exceptions were the Canadian dollar and Swiss franc. The greenback widely appreciated over the past year, particularly against the Australian dollar and EM currencies.

VERSUS THE US DOLLAR
Total Return (%)
The euro was mixed last quarter, gaining relative to the Japanese yen, EM currencies, and Australian dollar, but depreciating against the Canadian dollar, Swiss franc, and US dollar. The common currency was also mixed over the past year, declining the most vis-à-vis the US dollar.

VERSUS THE EURO
Total Return (%)
Heightened Brexit uncertainty led UK sterling to mostly depreciate last quarter, weakening against the Canadian dollar, Swiss franc, US dollar, and euro, but gaining relative to the Japanese yen, EM currencies, and Australian dollar. The pound generally retreated over the past year, particularly against the US dollar and Japanese yen.

VERSUS THE POUND STERLING
Total Return (%)
Note: EM currencies is an equal-weighted basket of 20 currencies.
USD Market Performance as of September 30, 2018
US large caps surged in third quarter, outpacing gains by broader DM equities and US small caps. HY and IG corporate bonds also advanced, outperforming Treasuries, which fell as the Fed raised rates. Returns for Commodities were positive but more muted, though they led over the past year. EM assets broadly declined.

INDEX PERFORMANCE (US$)
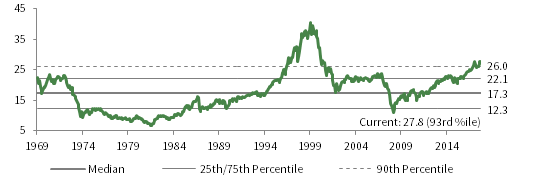
COMPOSITE NORMALIZED P/E: MSCI US
December 31, 1969 – September 30, 2018
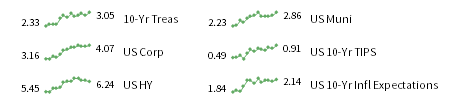
FIXED INCOME YIELDS
September 2017 – September 2018
Sources: Barclays, Bloomberg L.P., BofA Merill Lynch, FTSE International Limited, Frank Russell Company, J.P. Morgan Securities, Inc., MSCI Inc., National Association of Real Estate Investment Trusts, Standard & Poor’s, and Thomson Reuters Datastream. MSCI data provided “as is” without any express or implied warranties.
Euro Market Performance as of September 30, 2018
A US stock rally helped DM equities to outpace gains by European equivalents. Commodities also advanced and led all asset classes over the past year. Pan-euro HY bonds edged out European equities, while euro IG bonds declined. Further currency weakness dragged EM equities and local current debt lower.

INDEX PERFORMANCE (€)

COMPOSITE NORMALIZED P/E: MSCI EUROPE EX UK
December 31, 1969 – September 30, 2018
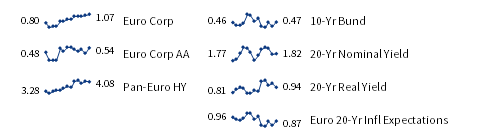
FIXED INCOME YIELDS
September 2017 – September 2018
Sources: Barclays, Bloomberg L.P., Citigroup Global Markets, EPRA, FTSE International Limited, J.P. Morgan Securities, Inc., MSCI Inc., National Association of Real Estate Investment Trusts, Standard & Poor’s, and Thomson Reuters Datastream. MSCI data provided “as is” without any express or implied warranties.
GBP Market Performance as of September 30, 2018
Amid heightened Brexit uncertainty, UK assets generally declined last quarter, save for HY bonds. UK equities retreated, particularly UK mid caps, while DM ex UK stocks surged and EM equivalents were flat. UK gilts, corporate IG bonds, and linkers were all in the red, and UK REITs posted the sharpest losses.
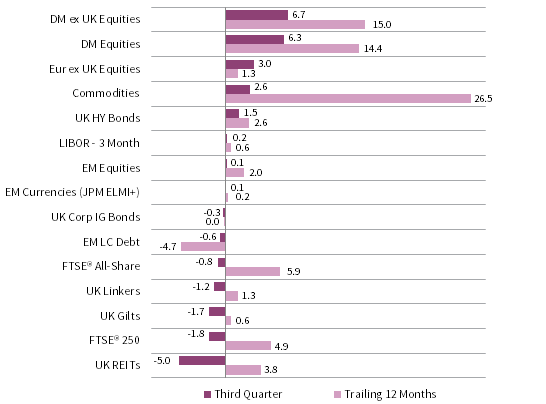
INDEX PERFORMANCE (₤)
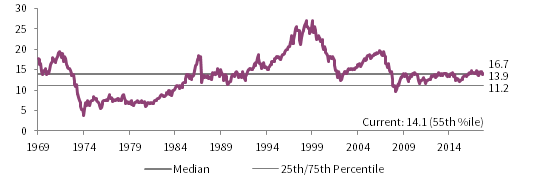
COMPOSITE NORMALIZED P/E: MSCI UK
December 31, 1969 – September 30, 2018

FIXED INCOME YIELDS
September 2017 – September 2018
Sources: Barclays, Bloomberg L.P., BofA Merill Lynch, EPRA, FTSE International Limited, J.P. Morgan Securities, Inc., MSCI Inc., National Association of Real Estate Investment Trusts, Standard & Poor’s, and Thomson Reuters Datastream. MSCI data provided “as is” without any express or implied warranties.
Exhibit Notes
Performance Exhibits
Total return data for all MSCI indexes are net of dividend taxes.
US dollar index performance chart includes performance for the Bloomberg Barclays Aggregate Bond, Bloomberg Barclays Corporate Investment Grade, Bloomberg Barclays High-Yield Bond, Bloomberg Barclays Municipal Bond, Bloomberg Barclays US TIPS, Bloomberg Barclays US Treasuries, BofA Merrill Lynch 91-Day Treasury Bills, FTSE® NAREIT All Equity REITs, J.P. Morgan ELMI+, J.P. Morgan GBI-EM Global Diversified, MSCI Emerging Markets, MSCI World, Russell 2000®, S&P 500, and S&P GSCI™ indexes.
Euro index performance chart includes performance for the Bloomberg Barclays Euro-Aggregate: Corporate, Bloomberg Barclays Pan-Euro High Yield, Citigroup EMU Govt Bonds, Citigroup Euro Broad Investment-Grade Bonds, Euribor 3-month, FTSE® EPRA/NAREIT Europe ex UK, J.P. Morgan ELMI+, J.P. Morgan GBI-EM Global Diversified, MSCI Emerging Markets, MSCI Europe, MSCI Europe ex UK, MSCI Europe Small-Cap, MSCI World ex EMU, MSCI World, and S&P GSCI™ indexes.
UK sterling index performance chart includes performance for the Bloomberg Barclays Sterling Aggregate: Corporate Bond, BofA Merrill Lynch Sterling High Yield, FTSE® 250, FTSE® All-Share, FTSE® British Government All Stocks, FTSE® British Government Index-Linked All Stocks, FTSE® EPRA/NAREIT UK RE, J.P. Morgan ELMI+, J.P. Morgan GBI-EM Global Diversified, LIBOR 3M GBP, MSCI Emerging Markets, MSCI Europe ex UK, MSCI World, MSCI World ex UK, and S&P GSCI™ indexes.
Valuation Exhibits
The composite normalized P/E ratio is calculated by dividing the inflation-adjusted index price by the simple average of three normalized earnings metrics: ten-year average real earnings (i.e., Shiller earnings), trend-line earnings, and return on equity–adjusted earnings. We have removed the bubble years 1998–2000 from our mean and standard deviation calculations. All data are monthly.
Fixed Income Yields
US fixed income yields reflect Bloomberg Barclays Municipal Bond Index, Bloomberg Barclays US Corporate High Yield Bond Index, Bloomberg Barclays US Corporate Investment-Grade Bond Index, and the ten-year Treasury.
European fixed income yields reflect the BofA Merrill Lynch Euro Corporate AA Bond Index, BofA Merrill Lynch Euro Corporate Bond Index, Bloomberg Barclays Pan-European Aggregate High Yield Bond Index, Bloomberg Twenty-Year European Government Bond Index (nominal), ten-year German bund, 20-year European Inflation Swaps (inflation expectations), and the real yield calculated as the difference between the inflation expectation and nominal yield.
UK sterling fixed income yields reflect the Bank of England 20-year nominal yields, Bloomberg Generic UK 20-year inflation-linked (real) yields, ICE BofAML Sterling Corporate AA Bond Index, ICE BofAML Sterling Corporate Bond Index, and UK ten-year gilts.
Footnotes