Capital markets performance was generally positive in third quarter, bolstered by positive economic data, strong earnings growth, and mild inflation. Global equities advanced once again, led by emerging markets and growth stocks. Global investment-grade bond yields declined for most of the quarter, but increased sharply in the closing weeks. After a challenging first half of the year, real assets reversed course and delivered mostly positive third quarter performance, with commodities and global natural resources equities outperforming global stocks. Among currencies, the US dollar continued to slide, while the euro and UK sterling strengthened.
The positive macroeconomic environment that has supported global risk assets in 2017 continued in third quarter, with global equities (as represented by the MSCI All Country World Index) closing September at an all-time high in nominal terms. This year is expected to mark the first time in a decade that the economies of all member countries in both the MSCI World Index of developed countries and the MSCI Emerging Markets Index will be in synchronized expansion. Global GDP growth is forecasted to accelerate this year as economic policies implemented in recent years appear to be bearing fruit, while global inflation remains quite subdued. As a result, monetary policy in the world’s major economies is set to remain highly accommodative despite the US Federal Reserve’s widely telegraphed September announcement that it would begin slowly reducing its balance sheet this month, and despite expectations that the European Central Bank (ECB) will begin tapering its asset purchases early next year. This supportive macroeconomic backdrop has contributed to a positive earnings growth outlook for 2017 and 2018 across all major global equity regions, which has driven the strong returns for risk assets year-to-date—particularly emerging markets stocks, which have outperformed developed markets equivalents by over 1,100 basis points (bps) in USD terms.
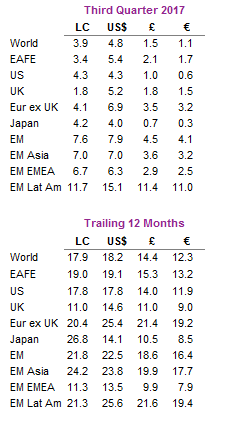
Total Return for MSCI Indexes (%)
US equities (4.5% for the S&P 500 Index) advanced for the eighth straight quarter, and are now up 14.2% year-to-date. Market volatility continued to be exceptionally low, with the VIX measure of implied volatility touching its lowest level since data began in 1990. US equity market returns were aided by second quarter earnings growth of 10% year-over-year, above expectations. Earnings benefitted from a weak US dollar and strong economic data, both abroad and at home. Second quarter US GDP grew an estimated above-trend 3.1%, consumer confidence in August reached its second highest level since 2000, and unemployment in July touched its lowest level in 16 years. The Fed’s September announcement noted balance sheet normalization is targeted for fourth quarter 2021 and signaled a December rate hike remains on the table. In late September, top Republicans in the White House and Congress released a unified framework for US tax reform, which contributed to a rise in bond yields and changes to recent equity market themes. Value outperformed growth in September (though still underperformed by 266 bps for the quarter), and small caps (5.7%) outperformed large caps for the quarter after underperforming the first half of the year. Information technology (8.6%) led among sectors, while consumer staples (-1.3%) was the only sector to decline.
European equities (3.5%) advanced for the sixth straight quarter and are up 11.6% year-to-date. Performance is almost double this in USD terms given dollar weakness. Eurozone (4.3%) and Europe ex UK (4.1%) stocks outperformed UK equities (2.1% for the FTSE® All-Share), with most of the outperformance occurring in September. Angela Merkel won re-election to a fourth term as German Chancellor, but European markets declined after the far-right Alternative for Germany party gained seats in parliament for the first time—many of which came at the expense of Merkel’s centrist Christian Democrats. Second quarter earnings per share for European companies grew 14% year-over-year; although this was down from the first quarter, it was still the second highest earnings growth in three years. Second quarter Eurozone GDP was revised up slightly to 2.3% and economic sentiment reached its highest level since July 2007. Eurozone headline inflation increased to 1.5%, but core inflation ticked down to 1.1%, well below the ECB’s 2.0% target. Market participants are eyeing the October 26 policy meeting that could signal whether the ECB is ready to begin tapering the asset purchase program at the beginning of next year.
Japanese equities (4.2%) outperformed in local currency terms, but yen weakness pulled down returns in most major currencies (4.0% in USD, 0.7% in GBP, and 0.3% in EUR). Japanese companies posted strong earnings results; second quarter earnings grew 22% year-over-year, buoyed by a weaker yen and accelerating global economic growth. Japanese economic data are improving but remain mixed. While second quarter Japanese GDP grew a healthy 2.5% and unemployment remained at a 23-year low, retail sales and real wage growth have disappointed. The Bank of Japan (BOJ) recommitted to ultra-loose monetary policy and pushed back the date at which it expects to meet its 2% inflation target for the sixth time since 2013 as headline and core inflation—both key metrics for the BOJ—remained anemic.
Emerging markets equities (7.9% in USD, 4.5% in GBP, and 4.1% in EUR) continued to outperform developed markets counterparts in third quarter, supported by earnings strength, dollar weakness, and improving global economic trade. Notably, emerging markets’ outperformance began to reverse in the final weeks of September, following the US Fed meeting. Latin America outperformed broader emerging markets for the quarter, while emerging Asia and emerging Europe, the Middle East & Africa underperformed. Brazil (17.4%) was the primary driver of Latin America’s outperformance as investors cheered prospects for economic reforms, though new corruption charges filed against President Michel Temer in September could present a roadblock. Heavily weighted China (14.7%) accounted for more than half of emerging markets returns, despite emerging Asia’s underperformance. Russia (14.8%), Peru (14.1%), and Chile (12.4%) also rallied, while Greece (-15.2%) and newly promoted Pakistan (-16.1%) experienced sharp declines.
Real assets performance varied in the third quarter but was mostly positive. Commodity futures rebounded (2.5% for the Bloomberg Commodity TR Index and 7.2% for the energy-heavy S&P GSCI™ Index) as strong gains in energy and industrial metals more than offset declines in agriculture and livestock. Energy prices ($57.54 for Brent crude oil and $51.67 for WTI) increased, but conflicting impacts from Hurricanes Harvey and Irma led Brent and WTI price levels to diverge the most since August 2015. Global natural resources equities (9.7% for the MSCI World Natural Resources Index in USD terms) was the best-performing asset class; energy MLPs (-3.0%) significantly underperformed. Rising geopolitical tensions helped gold advance 3.2% to $1,283.83/troy ounce, but the precious metal declined nearly 5% from early September as US bond yields jumped and the US dollar strengthened. Global REITs (1.8% in USD terms) advanced for the third consecutive quarter, with Europe ex UK REITs (1.9%) outperforming US REITs (1.1%) and UK REITs (0.0%).
EMU government bonds (0.6%) and US Treasuries (0.4%) modestly advanced for the quarter, while UK gilts (-0.5%) declined. The US yield curve shifted upward slightly after two consecutive quarters of flattening, but yields at all maturities on the curve remain significantly above levels from a year ago, just before the US election. Five- and ten-year US Treasury yields gained 3 bps and 2 bps over the quarter to finish at 1.92% and 2.33%, respectively, but were up 29 bps and 28 bps from early September lows due to the aforementioned Fed and tax reform announcements. Five- and ten-year UK gilt yields finished the quarter at 0.78% and 1.40%, respectively, up 42 bps and 39 bps from early September. US credit spreads narrowed as US high-yield bonds (2.0%) and US investment-grade corporate bonds (1.3%) both outperformed Treasuries. Among developed markets inflation-linked bonds, US TIPS (0.9%) outperformed Treasuries, but UK linkers (-0.7%) underperformed gilts.
US dollar weakness continued in third quarter as the trade-weighted greenback touched its lowest level since January 2015. The US dollar retreated against the Canadian dollar, euro, UK sterling, Australian dollar, and our equal-weighted basket of EM currencies but gained against the Japanese yen and Swiss franc. Continuing recent trends, the euro strengthened against all major currencies (other than the Canadian dollar) and our EM currency basket. UK sterling strengthened against most major currencies and our basket of EM currencies, but continued to weaken against the euro and Canadian dollar.
Market Exhibits
Expected Change in Central Bank Balance Sheet Assets
The Fed announced plans to begin slowly shrinking its balance sheet this month, but global monetary policy will remain highly accommodative with the BOJ and ECB expected to continue buying bonds for the foreseeable future, although at a potentially slower pace starting in 2018
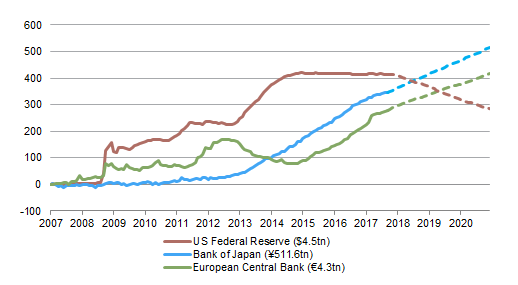
Expected Change in Central Bank Balance Sheet Assets
January 31, 2007 – December 31, 2020 • Local Currency • January 31, 2007 = 0
Notes: Amounts in legend reflect balance sheet assets as of August 31, 2017. Data after August 31, 2017 are projected. Fed balance sheet data are assumed to follow the New York Fed median projected path when normalization begins October 2017. In this scenario, the Fed balance sheet is expected to normalize in fourth quarter 2021. Bank of Japan projected balance sheet data are assumed to increase by ¥5tn/month. European Central Bank balance sheet data are assumed to increase by €60bn/month through December 2017 and by €40bn/month thereafter.
Percent of Global Economies Expanding vs Contracting
2017 is expected to mark the first year in a decade that the economies of all member countries in both the MSCI World Index of developed countries and the MSCI Emerging Markets Index will be in synchronized expansion
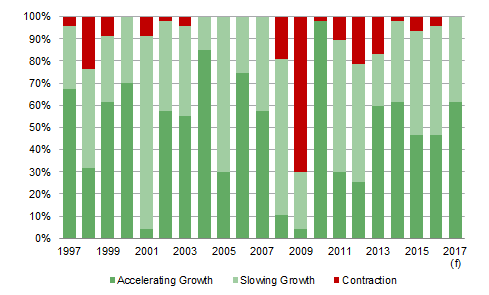
Percent of Global Economies Expanding vs Contracting
1997–2017(f)
Notes: Included in this analysis are the 23 developed markets economies in the MSCI World Index and the 24 emerging markets economies in the MSCI Emerging Markets Index. GDP growth figures are in national currencies and inflation-adjusted terms. Growth for 2017 are forecasts.
Estimated Calendar Year 2017 and 2018 EPS Growth
Strong earnings results observed in 2017, with expectations of double-digit growth across all major equity regions, are expected to continue in 2018, albeit at a more muted pace
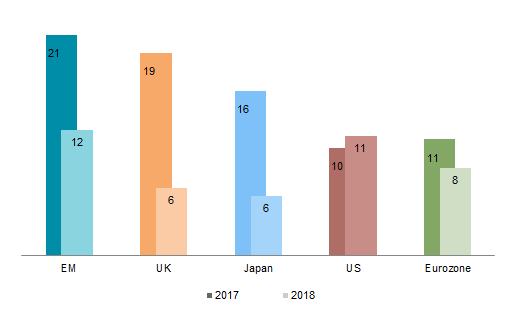
Estimated Calendar Year 2017 and 2018 EPS Growth
As of September 30, 2017 • Year-over-Year Percent Change (%)
Notes: All data are in local currency terms except EM, which is in USD terms. Data for Japan represents the fiscal year ending March 31 of the subsequent year.
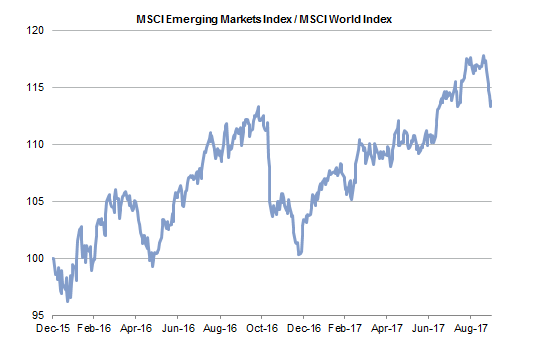
Relative Performance: Emerging vs Developed Markets Equities
Emerging markets equities have outperformed developed markets equivalents since the end of 2015, though only in mid-July 2017 did emerging markets stocks regain lost relative performance following the November 2016 US election. EM stocks also gave back some of their strong year-to-date outperformance in September following the Fed meeting
Relative Performance: Emerging vs Developed Markets Equities
December 31, 2015 – September 30, 2017 • US Dollar • December 31, 2015 = 100
Notes: Data are daily total returns. Emerging markets and developed markets data are represented by the MSCI Emerging Markets Index and the MSCI World Index, respectively.
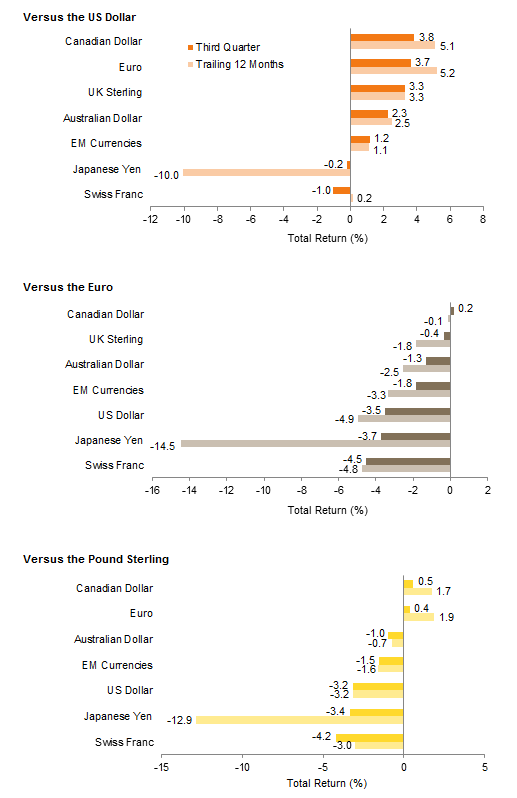
Currency Performance
The US dollar weakened in third quarter, as the DXY index touched a multi-year low. The greenback fell vis-à-vis the Canadian dollar, euro, UK sterling, Australian dollar, and our EM currency basket but strengthened against the Japanese yen and Swiss franc. Only the yen has been weak vs the US dollar over the past year
The euro strengthened against all major currencies (except the Canadian dollar) and our EM currency basket in third quarter, and over the past year has appreciated against every major currency and almost every other currency we track
UK sterling reversed course in third quarter on rate hike expectations, strengthening against the Australian dollar, our basket of EM currencies, the US dollar, the Japanese yen, and the Swiss franc, though it continued to weaken against the Canadian dollar and euro
Currency Performance
As of September 30, 2017
Note: EM currencies is an equal-weighted basket of 20 currencies.
Index Performance (US$)
Further US dollar weakness helped emerging markets and developed markets equities outperform US stocks in third quarter. Commodities and US small-cap equities outperformed, reversing trends from earlier in 2017. US bonds underperformed domestic equities, and credit spreads tightened as US high-yield bonds and US investment-grade corporates outperformed US Treasuries

Index Performance (US$)
As of September 30, 2017

Composite Normalized P/E: MSCI US
December 31, 1969 – September 30, 2017
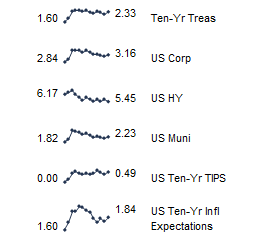
Fixed Income Yields
September 2016 – September 2017
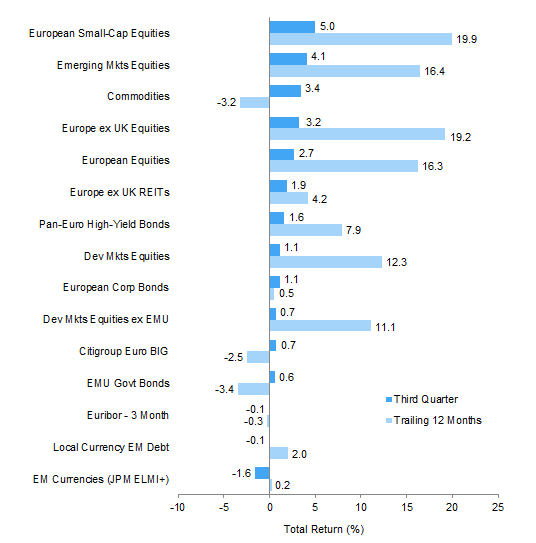
Index Performance (€)
European small caps, emerging markets equities, and commodities outperformed European equities and bonds in third quarter. Continued euro strength was a headwind to returns from outside the region, with developed markets equities underperforming European equivalents. Investment-grade European bonds experienced muted gains in third quarter but have declined over the past year
Index Performance (€)
As of September 30, 2017

Composite Normalized P/E: MSCI Europe ex UK
December 31, 1969 – September 30, 2017
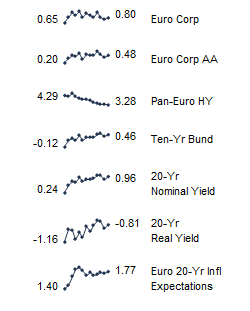
Fixed Income Yields
September 2016 – September 2017
Index Performance (£)
Emerging markets equities continued to outperform developed markets equities in third quarter. Europe ex UK and UK mid-caps also posted decent gains. Among bond categories, UK high-yield bonds advanced, UK investment-grade corporate bonds were roughly flat, and UK gilts declined. Commodities rebounded but remain negative over the past 12 months
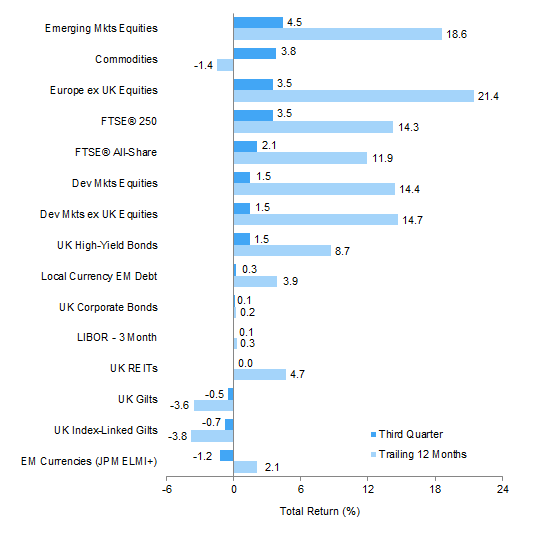
Index Performance (£)
As of September 30, 2017
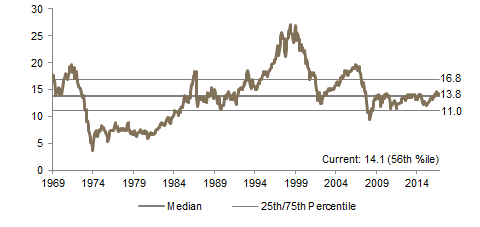
Composite Normalized P/E: MSCI UK
December 31, 1969 – September 30, 2017
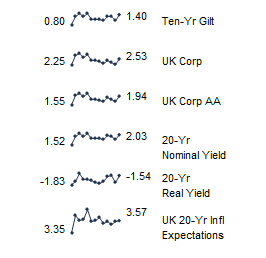
Fixed Income Yields
September 2016 – September 2017
Exhibit Notes
Performance Exhibits
Total return data for all MSCI indexes are net of dividend taxes.
US dollar index performance chart includes performance for the Bloomberg Barclays Aggregate Bond, Bloomberg Barclays Corporate Investment Grade, Bloomberg Barclays High-Yield Bond, Bloomberg Barclays Municipal Bond, Bloomberg Barclays US TIPS, Bloomberg Barclays US Treasuries, BofA Merrill Lynch 91-Day Treasury Bills, FTSE® NAREIT All Equity REITs, J.P. Morgan ELMI+, J.P. Morgan GBI-EM Global Diversified, MSCI Emerging Markets, MSCI World, Russell 2000®, S&P 500, and S&P GSCI™ indexes.
Euro index performance chart includes performance for the Bloomberg Barclays Euro-Aggregate: Corporate, Bloomberg Barclays Pan-Euro High Yield, Citigroup EMU Govt Bonds, Citigroup Euro Broad Investment-Grade Bonds, Euribor 3-month, FTSE® EPRA/NAREIT Europe ex UK, J.P. Morgan ELMI+, J.P. Morgan GBI-EM Global Diversified, MSCI Emerging Markets, MSCI Europe, MSCI Europe ex UK, MSCI Europe Small-Cap, MSCI World ex EMU, MSCI World, and S&P GSCI™ indexes.
UK sterling index performance chart includes performance for the Bloomberg Barclays Sterling Aggregate: Corporate Bond, BofA Merrill Lynch Sterling High Yield, FTSE® 250, FTSE® All-Share, FTSE® British Government All Stocks, FTSE® British Government Index-Linked All Stocks, FTSE® EPRA/NAREIT UK RE, J.P. Morgan ELMI+, J.P. Morgan GBI-EM Global Diversified, LIBOR 3M GBP, MSCI Emerging Markets, MSCI Europe ex UK, MSCI World, MSCI World ex UK, and S&P GSCI™ indexes.
Valuation Exhibits
The composite normalized P/E ratio is calculated by dividing the inflation-adjusted index price by the simple average of three normalized earnings metrics: ten-year average real earnings (i.e., Shiller earnings), trend-line earnings, and return on equity–adjusted earnings. We have removed the bubble years 1998–2000 from our mean and standard deviation calculations. All data are monthly.
Fixed Income Yields
US fixed income yields reflect Bloomberg Barclays Municipal Bond Index, Bloomberg Barclays US Corporate High-Yield Bond Index, Bloomberg Barclays US Corporate Investment-Grade Bond Index, and the ten-year Treasury.
European fixed income yields reflect the BofA Merrill Lynch Euro Corporate AA Bond Index, BofA Merrill Lynch Euro Corporate Bond Index, Barclays Pan-European Aggregate High Yield Bond Index, Bloomberg Twenty-Year European Government Bond Index (nominal), ten-year German bund, 20-year European Inflation Swaps (inflation expectations), and the real yield calculated as the difference between the inflation expectation and nominal yield.
UK sterling fixed income yields reflect the BofA Merrill Lynch Sterling Corporate AA Bond Index, BofA Merrill Lynch Sterling Corporate Bond Index, UK ten-year gilts, Bank of England 20-year nominal yields, and Bloomberg Generic UK 20-year inflation-linked (real) yields. Current UK 20-year nominal yield data are as of September 28, 2017.