Third quarter turned out to be a breeze for global risk assets. Concerns sparked by the UK’s historic “Brexit” vote heading into the quarter were allayed by central bankers’ decisive statements and actions in the days and weeks following the referendum, which reassured markets that monetary policy would remain highly accommodative, and by the new UK government’s indications that it would not rush into exit negotiations. Global high-yield bonds and global equities enjoyed strong performance as a result, ending the quarter at or near year-to-date highs. The global equity rally was particularly broad, with all major regions finishing the quarter above levels observed just prior to the sell-off that followed the UK referendum in late June. Emerging markets equities and developed markets small caps saw the largest gains, reflecting the risk-on sentiment that has prevailed in recent months. The year-to-date rally in gold, global government bonds, and US REITs stalled in contrast as rising risk appetite diminished investor demand for safe haven assets and bond proxies.
US equities (3.9%) enjoyed strong gains in aggregate yet underperformed developed markets equivalents despite setting multiple all-time highs during the quarter. Bond proxies underperformed as consumer staples, telecom services, and utilities were the only sectors to suffer declines amid a growing realization that the US Federal Reserve is approaching another rate hike given better economic data releases and signs of rising inflation. Third quarter results season will begin shortly and, while analyst estimates have been downgraded coming into the quarter, the extent of the downgrades has not been as large as those observed in recent quarters. Third quarter earnings are expected to show growth relative to those of the last two quarters, if not on a year-over-year basis. US small caps (9.0%) outpaced large caps by over 500 basis points (bps) and have now outperformed over the trailing 12 months after underperforming for much of 2014 and 2015. Small-cap growth stocks were the top-performing market segment despite lofty valuations and the prevalence of negative earnings.
UK equities (7.0%) topped developed markets peers, although the weak British pound weighed on returns for foreign investors, with returns of 4.0%, 2.8%, and 3.5% for US dollar, euro, and Swiss franc investors, respectively. The UK large-cap universe is dominated by natural resources producers and multinationals, which are benefitting from stronger commodity prices, the currency’s recent depreciation, or both. The consumer discretionary, financial, information technology, and materials sectors all enjoyed double-digit returns. UK mid caps (10.7%), which are more domestically focused, outperformed large-cap equivalents for the quarter but lagged on a trailing 12-month basis after multiple years of outperformance. Recent economic data releases suggest the UK economy was stronger than previously understood coming into the referendum, which may help explain why the results of economic surveys taken since the vote indicate resilient economic activity in the face of rising uncertainty.
Eurozone (6.6%) and Europe ex UK (5.1%) equities were led by Germany (8.8%), Spain (8.1%), and the Netherlands (8.0%) and outperformed developed markets as a whole. The results of the European Banking Authority’s stress tests revealed that most banks have made progress raising capital and shoring up balance sheets since the last round of bank examinations in 2014. Still, the quarter ended with German lender Deutsche Bank capturing headlines as its share price plunged amid news of a potentially large settlement with the US Department of Justice over the bank’s misdeeds underwriting mortgage-related securities prior to the global financial crisis. Despite the recent sell-off in Deutsche Bank’s stock and subordinated bonds, most analysts believe the bank’s issues are ones of capital adequacy and not liquidity, which would explain why the share prices of other European banks have not succumbed to similar pressures in recent weeks.
Japanese equities (7.2%) rebounded from a difficult first half of the year as the Bank of Japan refrained from cutting its deposit rate further into negative territory and the Abe government announced a fiscal stimulus package. In late September, the central bank announced some changes to its monetary policy framework, introducing interest rate targeting to ease the burden of its negative interest rate policy on financial institutions. Financials underperformed in September nonetheless, but performed roughly in line with the broad market over the full quarter.
For more on the opening of Chinese markets, please see Aaron Costello, “The Opening of China: An Update for Investors,” Cambridge Associates Research Brief, September 30, 2016.
Emerging markets equities (7.7%) meaningfully outperformed developed markets counterparts (4.8%) and have outpaced developed equities over the trailing 12 months by nearly 300 bps. China (13.9%) set the pace for the emerging Asia (8.9%) region, which outperformed Latin America (7.6%) and emerging Europe, the Middle East, and Africa (2.6%). The strong rally in the offshore-listed Chinese stocks composing the MSCI China Index during third quarter coincided with an August announcement by the Chinese government authorizing a stock trading link between Shenzhen and Hong Kong, similar to the one established between Shanghai and Hong Kong in late 2014. That existing link saw a strong jump in capital flows from mainland Chinese investors into Hong Kong–listed shares of Chinese companies during the quarter, with some indication that Chinese government-related entities were responsible for much of the buying. Brazil—where the country’s senate voted to officially impeach former president Dilma Rousseff for her role in the government corruption scandal involving the state oil company, Petrobras—was also a strong performer for the quarter and the second best performing market year-to-date.
Real asset performance was mixed, with most categories outperforming commodity futures (-3.9% for the Bloomberg Commodity TR Index and -4.2% for the energy-heavy S&P GSCI™), which were hurt by the ongoing negative roll yield as well as price weakness for grains, livestock, and natural gas. Crude oil prices rallied into quarter-end following the announcement that OPEC members had agreed in principle to production limits at the cartel’s Algiers summit; prices for WTI and Brent finished at $48.24 and $49.06, respectively. Gold was flat for the quarter, with the spot price closing at $1,321.51/troy ounce. Natural resources equities (3.5%) gained, led by metals and mining stocks, which benefited from a strong rebound in industrial metals prices. Energy master limited partnerships (1.1%) also advanced. US REITs (-1.2%) declined as demand for bond proxies in the United States waned; REITs in the UK (5.0%) and Europe ex UK (5.0%) enjoyed strong results in contrast. Real estate officially became a standalone sector within the major equity indexes during September.
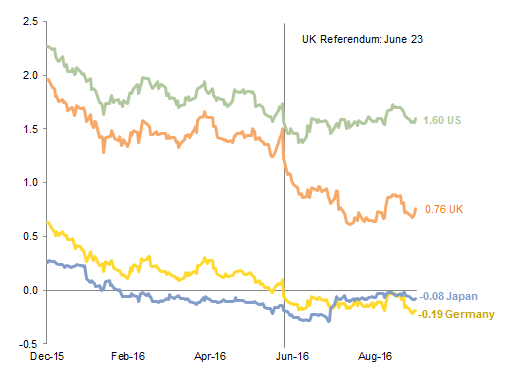
Global developed markets government bonds (-0.3%) declined as sovereign yields rose from record lows observed in July. UK gilts (2.3%) outperformed as the surprise UK referendum result prompted the Bank of England (BOE) to cut rates and reinstitute asset purchases. The ten-year gilt yield dropped 26 bps over the quarter. UK credit spreads fell sharply as UK investment-grade corporate bonds (6.4%) rallied on the BOE’s decision to include them among the eligible collateral for its quantitative easing program. US Treasuries (-0.3%) retreated as the ten-year yield closed at 1.60%, a 23 bp bounce from the all-time low set on July 8. Eurozone government bonds (0.7%) advanced, mostly due to a strong rally in German bunds into quarter-end. US tax-exempt bonds (-0.3%) declined alongside Treasuries. US corporate credit spreads continued to tighten as US high-yield bonds (5.6%) enjoyed strong outperformance despite rising default rates. Turning to inflation-linked bonds, UK linkers (10.1%) recorded their highest performance of any quarter since the 1982 inception of the index as the British pound’s sharp decline since the referendum has driven inflation expectations markedly higher. US TIPS (1.0%) experienced more muted gains but still handily outperformed nominal Treasuries.
The US dollar weakened against several developed markets currencies and versus an equal-weighted basket of emerging markets currencies. The British pound was the main exception, falling 2.8% against the greenback over the quarter after an 8.2% drop in June. The pound sterling weakened against every major currency and most emerging markets currencies for the quarter and has depreciated against every global currency we track for the year-to-date and trailing 12-month periods. The euro appreciated against the UK sterling, Canadian dollar, US dollar, an EM currency basket, and Swiss franc but fell vis-à-vis the Japanese yen and Australian dollar; the latter enjoyed broad strength, having benefited from the rebound in industrial metals prices. Within emerging markets, the South African rand and Korean won were particularly strong; the Mexican peso was notably weak in contrast as Donald Trump’s candidacy has stoked concerns that Mexico’s trade agreements with the United States would be at risk were he to win the US presidency.
Market Exhibits
Ten-Year Government Bond Yields
Government bond yields in key markets touched record lows during the quarter; the economic uncertainty caused by the “Brexit” vote, combined with the BOE’s decision to reinstitute quantitative easing, drove a particularly sharp decline in gilt yields
Ten-Year Government Bond Yields
December 31, 2015 – September 30, 2016 • Percent (%)
Note: Data are daily.
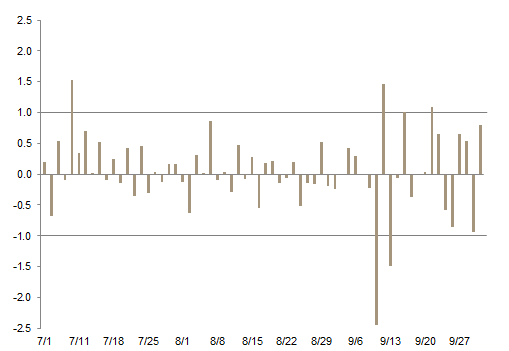
S&P 500 Daily Price Returns
Reassurances from central banks that monetary policy will remain highly accommodative and seasonally depressed trading volumes contributed to muted equity market volatility for most of July and August. Volatility rose somewhat in September as the Fed began to lay the groundwork for a rate hike before year-end
S&P 500 Daily Price Returns
July 1, 2016 – September 30, 2016 • Percent (%)
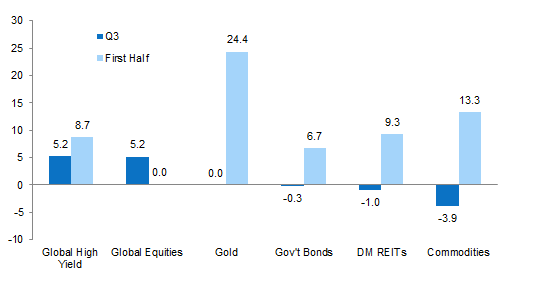
2016 Global Asset Returns
Global high-yield bonds and global equities enjoyed strong performance, ending the quarter at or near year-to-date highs; the rally in gold, global government bonds, and REITs stalled in contrast as rising risk appetite diminished investor demand for safe haven assets and bond proxies. Commodity futures were dragged lower by the energy and agriculture categories
2016 Global Asset Returns
As of September 30, 2016 • Total Return (%)
Notes: Returns are denominated in local currency terms. Gold return is the change in spot price. Asset classes represented by: Bloomberg Barclays Global High Yield Bond Index (Global High Yield), MSCI All Country World Index (Global Equities), J.P. Morgan Global Government Bond Index (Govt Bonds), FTSE® EPRA/NAREIT Developed REITs (DM REITs), Bloomberg Commodity Index Total Return (Commodities). Global equities and DM REITs returns are gross of dividend taxes.
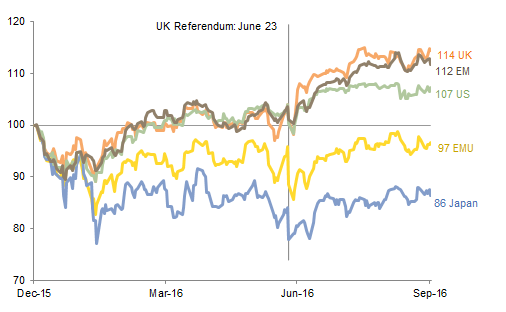
YTD Performance for Major Equity Regions
Global equities experienced a broad rally, with all major regions finishing the quarter above levels observed just prior to the UK referendum in late June, when equities sold off sharply following British voters’ surprise decision to leave the EU. EM equities have meaningfully outperformed developed markets as a whole both year-to-date and for the trailing 12 months
YTD Performance for Major Equity Regions
December 31, 2015 – September 30, 2016 • December 31, 2015 = 100
Notes: Data are daily. Performance reflects total returns in local currency. Total returns for developed markets indexes are net of dividend taxes. Total returns for emerging markets indexes are gross of dividend taxes.
Currency Performance
The US dollar weakened against several developed markets currencies and versus an equal-weighted basket of EM currencies for the quarter but appreciated versus the Canadian dollar and the UK pound. The latter was the only major developed markets currency to depreciate against the greenback over the last 12 months
The euro’s performance was mixed for the quarter, with the common currency falling versus the Japanese yen and Australian dollar. The euro strengthened against the US dollar and UK pound over the quarter and for the trailing 12 months
The fallout from the “Brexit” vote continued as the UK pound weakened against every major currency and most EM currencies for the quarter. Pound sterling has now depreciated against every global currency we track for the year-to-date and trailing 12-month periods
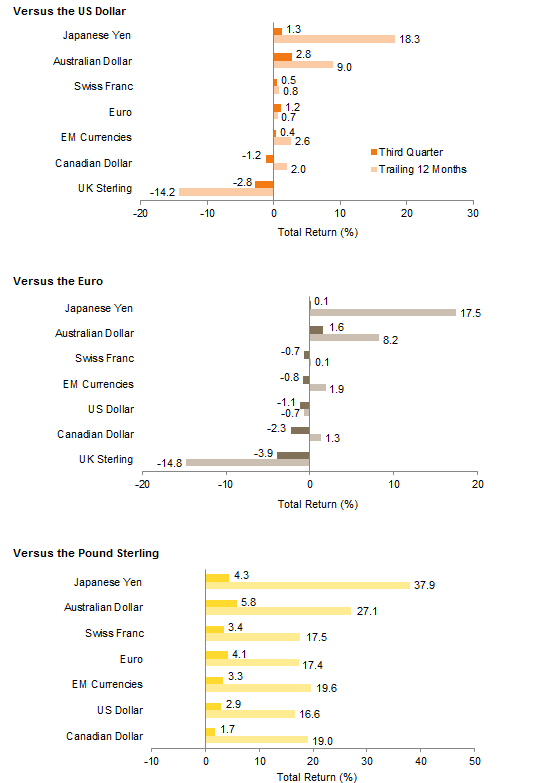
Currency Performance
As of September 30, 2016
Note: EM currencies is a geometric average of 20 currencies.
Index Performance (USD)
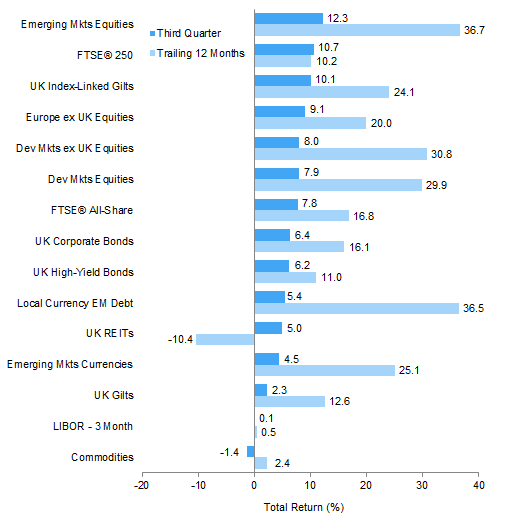
EM equities continued to set the pace for USD investors in third quarter, slightly outperforming US small caps, and are among the top performing asset classes over the trailing 12 months. US high-yield bonds continued to rally and outperformed US large caps, which were also outpaced by developed markets equities. US REITs retreated but remain the top performer over the last year. US Treasuries and US tax-exempt bonds also declined, while US corporate bonds and US TIPS advanced

Index Performance (USD)
As of September 30, 2016

MSCI US Composite Normalized P/E
December 31, 1969 – September 30, 2016

Fixed Income Yields
September 2015 – September 2016
Index Performance (€)
For the quarter, European small caps edged out the strong performance of EM equities in euro terms, and Europe ex UK equities and REITs outperformed developed markets equivalents. Bonds enjoyed more muted gains and were led by euro-denominated high-yield bonds and European corporates, which edged out local currency EM debt and Eurozone government bonds. Commodity futures suffered losses and are the only asset category shown to decline over the past 12 months

Index Performance (€)
As of September 30, 2016

MSCI UK Composite Normalized P/E
December 31, 1969 – September 30, 2016

Fixed Income Yields
September 2015 – September 2016
Index Performance (₤)
EM equities and UK mid caps outperformed other assets for the quarter in pound sterling terms. The UK pound’s further weakness meant that developed markets equities outperformed broad UK equities. UK linkers experienced their best quarter on record and also outperformed domestic equities. UK gilts also gained but meaningfully trailed UK investment-grade and high-yield corporate bonds, which rallied as the BOE announced they will be included in its new round of asset purchases
Index Performance (₤)
As of September 30, 2016

MSCI Europe ex UK Composite Normalized P/E
December 31, 1969 – September 30, 2016

Fixed Income Yields
September 2015 – September 2016
Exhibit Notes
Performance Exhibits
Total returns for MSCI developed markets indexes are net of dividend taxes. Total returns for MSCI emerging markets indexes are gross of dividend taxes.
US dollar index performance chart includes performance for the Bloomberg Barclays Aggregate Bond, Bloomberg Barclays Corporate Investment Grade, Bloomberg Barclays High-Yield Bond, Bloomberg Barclays Municipal Bond, Bloomberg Barclays US TIPS, Bloomberg Barclays US Treasuries, BofA Merrill Lynch 91-Day Treasury Bills, FTSE® NAREIT All Equity REITs, J.P. Morgan ELMI+, J.P. Morgan GBI-EM Global Diversified, MSCI Emerging Markets, MSCI World, Russell 2000®, S&P 500, and S&P GSCI™ indexes.
Euro index performance chart includes performance for the Bloomberg Barclays Euro-Aggregate: Corporate, Bloomberg Barclays Pan-Euro High Yield, Citigroup EMU Govt Bonds, Citigroup Euro Broad Investment-Grade Bonds, EURIBOR 3M, FTSE® EPRA/NAREIT Europe ex UK, J.P. Morgan ELMI+, J.P. Morgan GBI-EM Global Diversified, MSCI Emerging Markets, MSCI Europe, MSCI Europe ex UK, MSCI Europe Small-Cap, MSCI World ex EMU, MSCI World, and S&P GSCI™ indexes.
UK sterling index performance chart includes performance for the Bloomberg Barclays Sterling Aggregate: Corporate Bond, BofA Merrill Lynch Sterling High Yield, FTSE® 250, FTSE® All-Share, FTSE® British Government All Stocks, FTSE® British Government Index-Linked All Stocks, FTSE® EPRA/NAREIT UK RE, J.P. Morgan ELMI+, J.P. Morgan GBI-EM Global Diversified, LIBOR 3M GBP, MSCI Emerging Markets, MSCI Europe ex UK, MSCI World, MSCI World ex UK, and S&P GSCI™ indexes.
Valuation Exhibits
The composite normalized P/E ratio is calculated by dividing the inflation-adjusted index price by the simple average of three normalized earnings metrics: ten-year average real earnings (i.e., Shiller earnings), trend-line earnings, and return on equity–adjusted earnings. We have removed the bubble years 1998–2000 from our mean and standard deviation calculations. All data are monthly.
Fixed Income Yields
US fixed income yields reflect Bloomberg Barclays Municipal Bond Index, Bloomberg Barclays US Corporate High-Yield Bond Index, Bloomberg Barclays US Corporate Investment-Grade Bond Index, and the ten-year Treasury.
European fixed income yields reflect the BofA Merrill Lynch Euro Corporate AA Bond Index, BofA Merrill Lynch Euro Corporate Bond Index, Barclays Pan-European Aggregate High Yield Bond Index, Bloomberg Twenty-Year European Government Bond Index (nominal), ten-year German bund, 20-year European Inflation Swaps (inflation expectations), and the real yield calculated as the difference between the inflation expectation and nominal yield.
UK sterling fixed income yields reflect the BofA Merrill Lynch Sterling Corporate AA Bond Index, BofA Merrill Lynch Sterling Corporate Bond Index, UK ten-year gilts, and Bank of England 20-year nominal, real, and zero coupon (inflation expectations) yields.