Market volatility notably increased in the third quarter, largely driven by investors’ growing concerns over China’s slowing economy and the negative implications for global growth, inflation, and asset prices. The US Federal Reserve’s decision to continue holding rates at the zero bound, citing China-related developments, further contributed to the market’s uncertainty. Since late May, global equity markets have been in the midst of a full-fledged correction, which to date has been the worst period for equities since 2011. Fears over the impact of China’s slowdown on global trade caused commodities, natural resources equities, and emerging markets stocks to experience the largest declines of the quarter. Energy master limited partnerships (MLPs) suffered their worst losses on record, punished by markets drawing a perhaps misplaced connection between lower oil prices and distribution cuts. In contrast, investment-grade bonds generated gains despite historically low yields and outperformed equities by a wide margin.
This quarter’s market performance was reminiscent of summer 2011, the last major global equity correction, which was similarly triggered by macroeconomic developments. Both then and now market fears regarding a political or policymaking “accident” drove investors to cut risk exposures. However, while some similarities are apparent on the surface, the specific circumstances have been reversed. In 2011 the peripheral Eurozone debt crisis was the leading threat to the global economy, with the market’s retrenchment exacerbated by the US debt ceiling standoff and a sovereign ratings downgrade amid a still-fragile domestic economic recovery. Asset prices in China and other major emerging markets suffered in sympathy, but the economic outlook and company fundamentals for those countries appeared much stronger at the time. In the end, European policymakers adopted new measures to successfully contain (or at least defer) their crisis, while American politicians struck a budget compromise at the eleventh hour, allowing both regions’ economic recoveries to continue.
Now economic and political challenges in China and other major emerging markets like Brazil are presenting the greatest risks to the global growth outlook. By comparison, the US economy appears relatively healthy and continues to strengthen, although momentum has waned of late. Similarly, developments in Europe have been largely positive with a “Greek tragedy” once again deferred at the start of the summer and recent evidence that the European Central Bank’s (ECB) quantitative easing program is beginning to bear fruit. Despite progress in developed markets like the United States and Europe, the potential for global economic growth to reaccelerate remains tenuous due to developments in China and the cascading effects on commodity exporters and its other trading partners. The growing importance of Chinese policymaking was revealed by the market’s volatile reaction to the mini-devaluation of the yuan in August, which spurred concerns about a greater-than-admitted economic slowdown when coming on the back of weaker data and an equity market sell-off. Global policy coordination would certainly help dampen the impact of China’s economic transition, though the fact that this devaluation clearly anticipated a rate hike by the Fed (which then did not occur) suggests this is currently lacking. With the risks of global currency wars reigniting, the Fed’s decision to delay could be interpreted as a move in the right direction.
US equities (-6.4%) outperformed their international equivalents as second quarter results were slightly better than feared, and recent share repurchase and dividend activity suggested that cash allocation policies will continue to support stock market performance, at least in the near term. Large caps outperformed small caps, with large-cap growth stocks proving the most resilient in the recent down market, perhaps a signal of quality returning to favor. From a sector standpoint, the utilities sector outperformed and was the lone positive performer on the quarter, while energy and materials stocks suffered large losses. Health care stocks also underperformed amid rising political scrutiny of pharmaceutical pricing practices. Comparing year-to-date sector performance with the latest earnings and revenue growth expectations, it’s clear that fundamentals are at least partly driving return dispersion among sectors. Except financials, the sectors that have outperformed this year are those where growth expectations for both earnings and revenues have remained positive. The top performing sectors (consumer discretionary, consumer staples, and health care) also happen to be the most tied to the domestic economy. At the same time, these sectors are generally where valuations are most stretched today.
UK equities (-6.6%) outperformed developed markets equivalents despite double-digit losses in the energy and materials sectors, with metals and mining names suffering in particular as evidenced by the market’s reaction to Glencore’s recent asset write-offs and rights offering. Europe ex UK (-7.2%) and EMU (-8.6%) equities underperformed their UK and US counterparts in the quarter but continue to outperform their regional peers on a trailing one-year basis. The consumer discretionary sector was among the worst performers, along with energy and materials, as revelations regarding Volkswagen AG’s emissions ratings scandal drove sharp losses among shares of the European automakers. Japanese equities (-13.7%) significantly underperformed developed markets peers in the quarter and gave back all of their prior year-to-date gains. Overall sentiment regarding Japan has soured due to concerns about export competitiveness following China’s mini-devaluation and amid disappointing domestic growth and inflation data that are calling into question the efficacy of the Abe government’s policy reforms.
Emerging markets equities (-12.0%) gave back all of their prior calendar year gains and more by quarter end, while international investors saw even larger losses on unhedged exposures as emerging markets currencies remained under pressure. The third quarter sell-off was in part driven by the stock market correction in China (-22.7% offshore and -28.8% onshore); markets with strong trade ties to China also suffered. Meanwhile, unfolding crises in other emerging markets like Brazil are at risk of being overlooked amid the focus on China. Brazil’s recent sovereign debt downgrade and currency collapse exemplify the challenges faced by many emerging economies. Entrenched political interests have prevented policymakers from smoothly facilitating their adjustment to lower commodity prices and declining foreign investor interest in the emerging markets carry trade. South Africa and Turkey offer similar examples. In contrast, China arguably possesses greater policy room and political will to pursue reforms than some of the so called “Fragile Five” countries as evidenced by the recent government stimulus measures to boost auto and housing demand.
Global investment-grade bonds (2.0%) generated gains in the third quarter as renewed deflation concerns and more dovish central banks encouraged investors back into fixed income assets. UK gilts (3.1%) outperformed EMU government bonds (2.5%) and US Treasuries (1.8%) as sovereign yield curves flattened, with long rates falling in particular. US high-yield credits (-4.9%) were roiled by further energy sector distress and investor outflows, while spreads were more firm for US investment-grade corporates (0.8%). Waning investor interest in new corporate credit issuance suggests spreads could remain under pressure and calls into question the sustainability of recent corporate cash allocation policies. US tax-exempt bonds (1.7%) were more resilient as investors have seemed to shrug off the challenging fiscal outlook for several major municipalities.
The US dollar (0.9% based on the US dollar index) was largely unchanged versus other major currencies as growing uncertainty regarding US monetary policy has led the greenback’s multi-year appreciation to stall. The pause may prove temporary, however, as several Fed policymakers including Janet Yellen recently reiterated their intention to raise rates by year-end, and with rising speculation that the ECB and Bank of Japan could soon embark on further quantitative easing. The third quarter brought further currency weakness for emerging markets as well as developed markets commodity producers as those economies continue their adjustment in response to the slowing of the China-led global commodity cycle.
Inflation-sensitive and real assets suffered across the board during the third quarter. Commodities (-14.5% for the Bloomberg Commodity Index and -19.3% for the energy-heavy S&P GSCI™) entered a new bear market in May, with crude prices in late August testing their prior cycle lows as supply continues unabated in part due to falling cost structures. Industrial metals prices fell amid waning Chinese demand, while precious metals did not quite offer a safe haven with gold (-4.7%) also down. Natural resources equities (-18.4%) fell in lock step with commodity spot prices as further negative financial results continue to call into question the ability of commodity company balance sheets to withstand what may be a prolonged downturn. MLPs (-22.1%) fell even further amid rising concerns over future distribution cuts and appear to have entered oversold territory, with yields rising to above 8% on an index basis. US Treasury Inflation-Protected Securities (-1.1%) experienced more muted losses in response to falling inflation expectations. Meanwhile, US REITs (1.0%) benefitted from falling sovereign bond yields and still positive domestic economic data.
The FOMC once again held the bank’s policy rate at the zero-bound, and the latest “dot plot” suggests an even more gradual tightening process than previously forecast as the committee downgraded its domestic growth and inflation projections, while in turn lowering its estimate of sustainable long-run unemployment
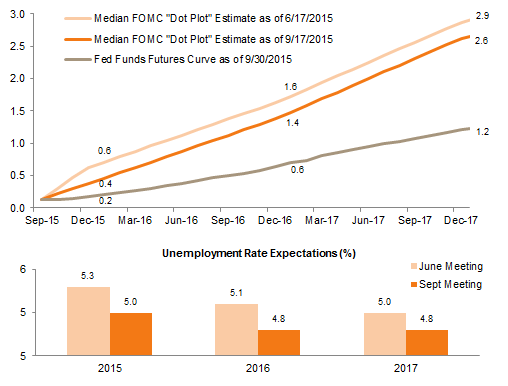
Fed Funds and Unemployment Projections
Percent (%)
Sources: Bloomberg L.P. and Federal Reserve.
In the United States, bonds outperformed equities on a trailing 12-month basis for the first time since early 2012 as investors eschewed risk assets in favor of investment-grade fixed income
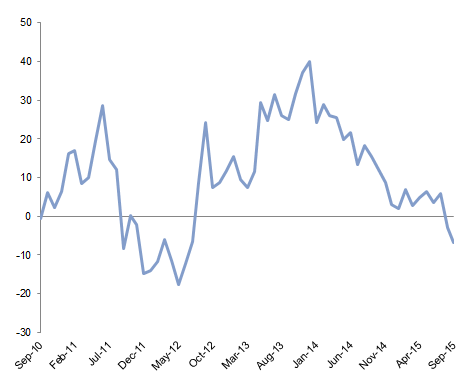
S&P 500 vs US Treasuries Rolling 12-Month Relative Performance
September 30, 2010 – September 30, 2015 • Percent (%)
Sources: Standard & Poor’s and Thomson Reuters Datastream.
Growth in the dollar value of share buybacks for US large-cap companies has stalled, but cash dividends increased further in second quarter even as free cash flow declines (falling profit margins are overwhelming capital expenditure cuts)
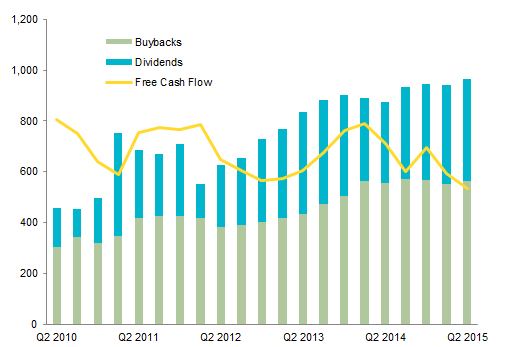
S&P 500 Rolling Four-Quarter Share Buybacks, Cash Dividends, and Free Cash Flow
Second Quarter 2010 – Second Quarter 2015 • US Dollar (billions)
Sources: FactSet Research Systems and Standard & Poor’s.
Notes: Data are as of June 30, 2015. Free cash flows are net of dividends.
US domestic-facing sectors are proving more resilient in their ability to maintain positive earnings and revenue growth, with relative sector fundamentals at least partly driving YTD outperformance
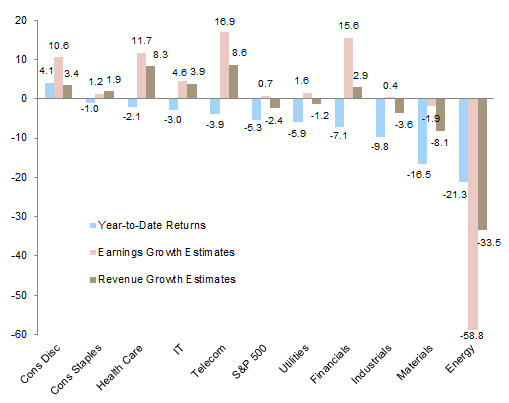
S&P 500 Sector YTD Returns vs CY 2015 Growth Estimates
As of September 30, 2015
US investment-grade bonds and REITs outperformed domestic equities and other risk assets over both the recent quarter and the trailing 12 months, perhaps demonstrating that investors have begun favoring income over growth in the recent environment. US$ strength has contributed to emerging markets and commodity weakness and has driven the further underperformance of these asset classes
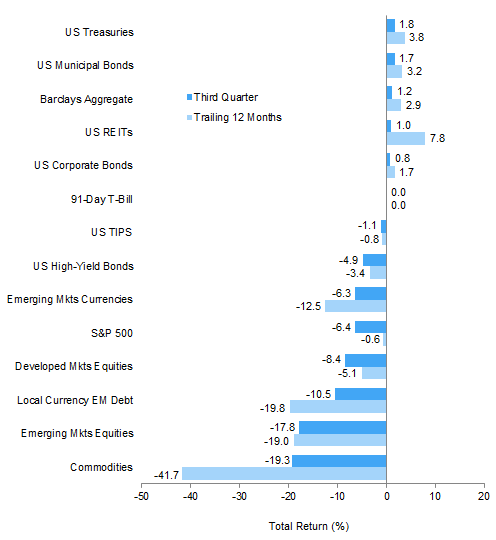
Index Performance (US$)
As of September 30, 2015
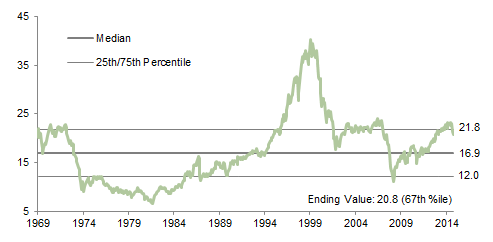
MSCI US Composite Normalized P/E
December 31, 1969 – September 30, 2015
Sources: Barclays, BofA Merill Lynch, FTSE International Limited, J.P. Morgan Securities, Inc., MSCI Inc., National Association of Real Estate Investment Trusts, Standard & Poor’s, and Thomson Reuters Datastream. MSCI data provided “as is” without any express or implied warranties.
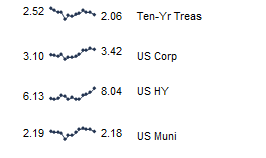
Fixed Income Yields
September 2014 – September 2015
Europe ex UK REITs led the outperformance of yield-oriented assets in the quarter as rising equity market volatility led some investors to cut exposures to riskier assets. Despite the recent market correction, developed markets equities have still generated positive returns for euro-based investors over the trailing 12 months, due to a combination of improving fundamentals for local equities and currency appreciation benefits of foreign equity exposures
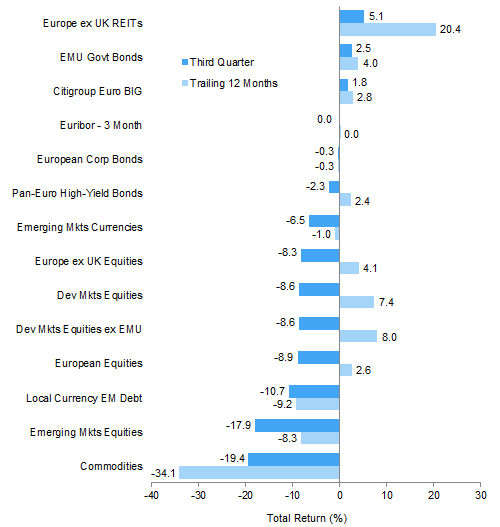
Index Performance (€)
As of September 30, 2015
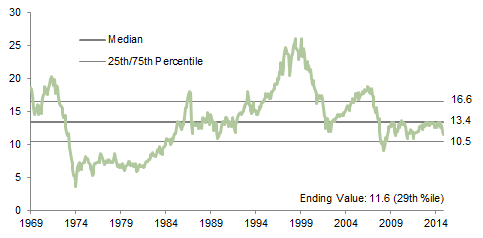
MSCI Europe ex UK Composite Normalized P/E
December 31, 1969 – September 30, 2015
Sources: Barclays, Bloomberg L.P., BofA Merill Lynch, Citigroup Global Markets, EPRA, FTSE International Limited, MSCI Inc., J.P. Morgan Securities, Inc., National Association of Real Estate Investment Trusts, Standard & Poor’s, and Thomson Reuters Datastream. MSCI data provided “as is” without any express or implied warranties.
Fixed Income Yields
September 2014 – September 2015
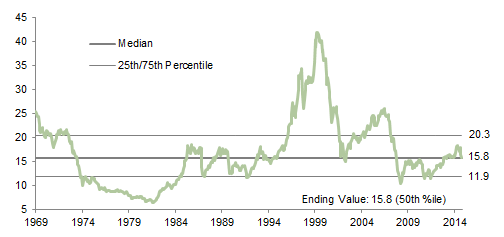
The preference for relatively safer yield plays extended to the UK where domestic REITs and UK gilts and linkers outperformed for both the quarter and the trailing 12 months. UK investment-grade and high-yield corporate bonds were virtually flat, while equities, commodities, and foreign currencies were almost universally in the red. UK equities underperformed developed markets peers on both a quarter and a trailing 12-month basis in pound sterling terms
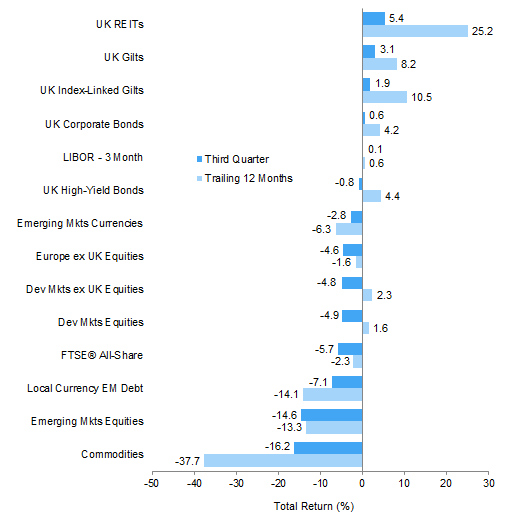
Index Performance (₤)
As of September 30, 2015
MSCI UK Composite Normalized P/E
December 31, 1969 – September 30, 2015
Sources: Bank of England, Barclays, BofA Merrill Lynch, EPRA, FTSE International Limited, J.P. Morgan Securities, Inc., MSCI Inc., National Association of Real Estate Investment Trusts, Standard & Poor’s, and Thomson Reuters Datastream. MSCI data provided “as is” without any express or implied warranties.
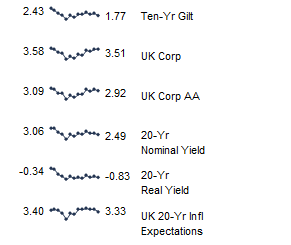
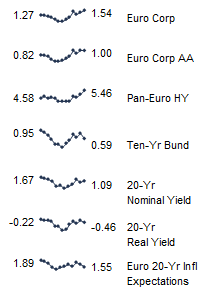
Fixed Income Yields
September 2014 – September 2015
The dollar weakened against the yen and was flat against the euro in third quarter, while resuming its appreciation against emerging markets and developed commodity producer currencies. The dollar strengthened versus the Swiss franc and pound sterling over both the quarter and the trailing 12 months. The ECB’s QE policy has successfully weakened the euro against the pound, Swiss franc, US dollar, and yen on a trailing 12-month basis. Emerging markets and commodity currencies have depreciated versus the euro over the same time period, particularly in the third quarter. The pound weakened versus the yen, dollar, and euro in third quarter, while remaining relatively flat versus the Swiss franc. Over the trailing 12 months, the pound depreciated versus the dollar and franc but showed relative strength against other currencies
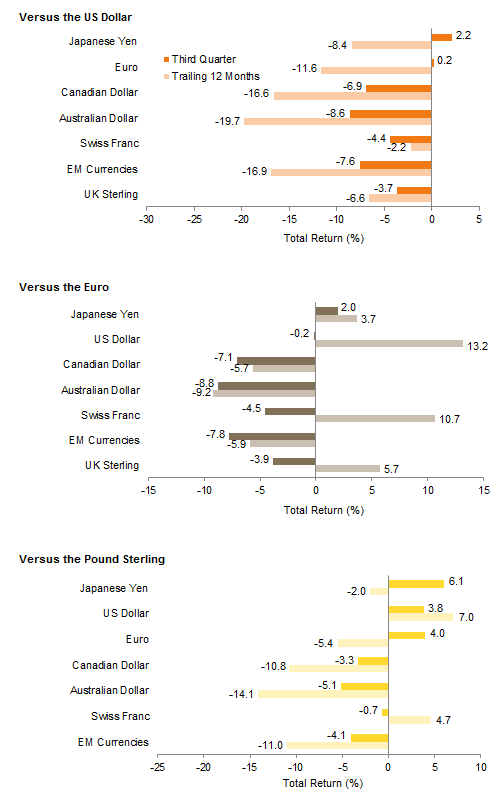
Currency Performance
As of September 30, 2015
Sources: MSCI Inc. and Thomson Reuters Datastream. MSCI data provided “as is” without any express or
implied warranties.
Note: EM currencies is an equal-weighted basket of 20 currencies.
Exhibit Notes
Performance Exhibits
Total returns for MSCI developed markets indexes are net of dividend taxes. Total returns for MSCI emerging markets indexes are gross of dividend taxes.
US dollar index performance chart includes performance for the Barclays Aggregate Bond, Barclays Corporate Investment Grade, Barclays High Yield Bond, Barclays Municipal Bond, Barclays US TIPS, Barclays US Treasuries, BofA Merrill Lynch 91-Day Treasury Bills, FTSE® NAREIT All Equity REITs, J.P. Morgan ELMI+, J.P. Morgan GBI-EM Global Diversified, MSCI Emerging Markets, MSCI World, S&P 500, and S&P GSCI™ indexes.
Euro index performance chart includes performance for the Barclays Euro-Aggregate: Corporate, Barclays Pan-Euro High Yield, Citigroup EMU Govt Bonds, EURIBOR 3M, FTSE® EPRA/NAREIT Europe ex UK RE, J.P. Morgan ELMI+, J.P. Morgan GBI-EM Global Diversified, MSCI Emerging Markets, MSCI Europe, MSCI Europe ex UK, MSCI World, MSCI World ex EMU, and S&P GSCI™ indexes.
UK sterling index performance chart includes performance for the Barclays Sterling Aggregate: Corporate Bond, BofA Merrill Lynch Sterling High Yield, FTSE® All-Share, FTSE® British Government All Stocks, FTSE® British Government Index-Linked All Stocks, FTSE® EPRA/NAREIT UK RE, J.P. Morgan ELMI+, J.P. Morgan GBI-EM Global Diversified, LIBOR 3M GBP, MSCI Emerging Markets, MSCI Europe ex UK, MSCI World, MSCI World ex UK, and S&P GSCI™ indexes.
Valuation Exhibits
The composite normalized P/E ratio is calculated by dividing the inflation-adjusted index price by the simple average of three normalized earnings metrics: ten-year average real earnings (i.e., Shiller earnings), trend-line earnings, and return on equity–adjusted earnings. We have removed the bubble years 1998–2000 from our mean and standard deviation calculations. All data are monthly.
Fixed Income Yields
US fixed income yields reflect Barclays Municipal Bond Index, Barclays US Corporate High Yield Bond Index, Barclays US Corporate Investment-Grade Bond Index, and the ten-year Treasury.
European fixed income yields reflect the BofA Merrill Lynch Euro Corporate AA Bond Index, BofA Merrill Lynch Euro Corporate Bond Index, Barclays Pan-European Aggregate High Yield Bond Index, Bloomberg Twenty-Year European Government Bond Index (nominal), ten-year German bund, 20-year European Inflation Swaps (inflation expectations), and the real yield calculated as the difference between the inflation expectation and nominal yield.
UK sterling fixed income yields reflect the BofA Merrill Lynch Sterling Corporate AA Bond Index, BofA Merrill Lynch Sterling Corporate Bond Index, UK ten-year gilts, and Bank of England 20-year nominal, real, and zero coupon (inflation expectations) yields.