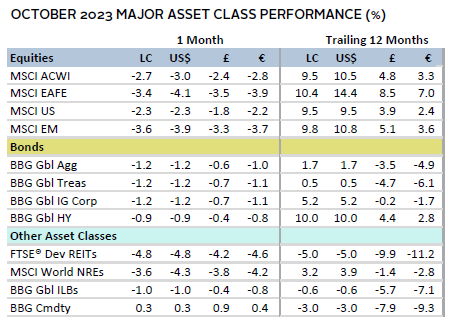
Risk assets broadly declined in October. Within global equities, only utilities gained, while the cyclical sectors, consumer discretionary and industrials, declined the most. Developed markets (DM) stocks outperformed emerging markets (EM) equivalents, while growth bested value, and large caps topped small-cap peers. Fixed income securities sold off as bond yields continued to climb; investment-grade bonds lagged high-yield corporates. Real assets mostly declined, except for commodities futures, which were buoyed by precious metals. The US dollar and euro mostly gained, and UK sterling was mixed.
Sources: Bloomberg Index Services Limited, Bloomberg L.P., EPRA, FTSE International Limited, MSCI Inc., National Association of Real Estate Investment Trusts, and Thomson Reuters Datastream. MSCI data provided “as is” without any express or implied warranties.
Note: Local currency returns for the Bloomberg fixed income indexes, the Bloomberg Commodity Index, and the FTSE® Developed REITs are in USD terms.
The Macro Picture
Geopolitical concerns heightened in October with the start of the Middle East conflict as people focused on the tragic loss of life. However, after the initial sell-off in equities and surge in oil prices, the markets returned to pre-conflict levels.
Investors primarily focused on the likelihood that central bank policies will adhere to a higher for longer interest rate scenario this month. As a result, bond yields continued their upward trajectory. Longer- dated government bonds rose at a faster pace than shorter-dated peers, particularly in the United States, where real ten-year Treasury yields reached their highest level since before the Global Financial Crisis. Robust economic data and unexpectedly strong corporate earnings drove investors to assume that the Federal Reserve would keep policy rates high to fight inflation, pushing markets down. The Bank of Japan (BOJ)—the only central bank to not raise benchmark policy rates yet this cycle—softened its yield curve control (YCC) policy shortly before month end. This led ten-year Japanese government bond (JGB) yields to rise to their highest levels in more than a decade. Following month end, investors are expecting monetary policy updates from the Bank of England (BOE) and the Fed.
Europe and China reported relatively muted economic data, weighing on sentiment across ex US global equities. The European Central Bank (ECB) held its benchmark deposit rate steady at its October meeting, pausing its tightening cycle amid weakening economic output data. In China, a record decline in foreign direct investment partially due to turmoil in the real estate sector weighed on equities, as did rising geopolitical tension with the United States.
Equities
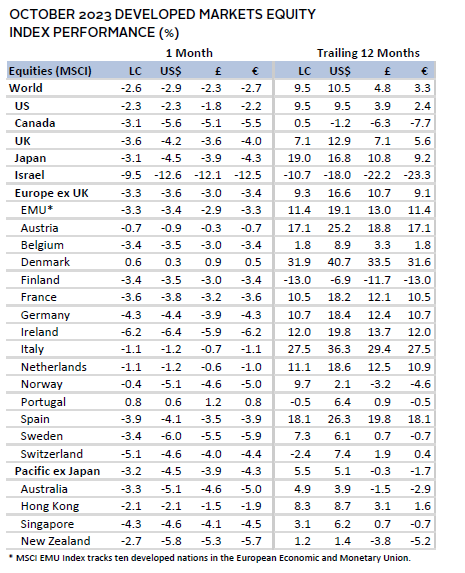
US equities declined but topped DM ex US peers in October. Large caps outperformed small caps, while growth topped value for the seventh month this year. Among sectors, cyclical energy and consumer discretionary declined the most, while utilities was the only sector to advance. US equities have outpaced DM ex US in 2023 but that outperformance has been narrowly concentrated. The “Magnificent Seven” stocks (Apple, Amazon, Microsoft, Meta [Facebook], Alphabet [Google], Nvidia, and Tesla) account for just more than a quarter of the MSCI US Index by weight, and yet, have contributed a whopping 97% of the index’s year-to-date (YTD) return. Excluding these stocks, the market return would shrink from 10.5% to 0.3%. Q3 earnings growth has been robust, with about 60% of the S&P 500 having reported thus far. The blended year-over-year (YOY) growth rate of 3.0% is well above the 0.3% decline expected by analysts in September. That number improves to 8.7% when the energy sector is excluded. Additionally, 80% of the reported S&P 500 companies delivered positive earnings per share surprises—above the long-term average.
The US economy grew well above expectations in the third quarter at 4.9% quarter-over-quarter (QOQ) annualized. Strong consumer spending drove growth, contributing more than half of the economic expansion. A variety of other economic data on the labor market, economic output, home purchases, consumer confidence, and retail sales outpaced expectations, reinforcing the economy’s resilience. However, news of slightly higher-than-expected inflation data weighed on sentiment, as it implied that the Fed is more likely to keep rates elevated.
European equities trailed broader DM shares in October. Europe ex UK stocks outperformed UK counterparts and continue to lead YTD.
The ECB maintained its benchmark deposit rate at 4.00% in October. This decision came amid swiftly declining, but still high, inflation data, and a weakening economic backdrop. ECB President Christine Lagarde shared that the central bank would not rule out future rate hikes, stating it was “totally premature” to consider potential cuts. The ECB noted it would keep rates sufficiently restrictive for as long as needed to lower inflation to its 2% target. Headline CPI declined to 2.9% YOY—its lowest rate in more than two years—driven by lower energy and food prices, while core inflation ticked down to 4.2%. Meanwhile, GDP unexpectedly fell in Q3 and PMI measures of economic output became more contractionary this month. Additionally, consumer confidence and business sentiment remained negative, and retail sales disappointed. These data points bolstered analyst expectations that the ECB is nearing the end of the hiking cycle.
In the United Kingdom, while trailing three-month GDP accelerated modestly, other data indicate that the economy is struggling. PMI measures of economic output remained contractionary, construction growth decelerated, and multiple measures of sentiment worsened. Further, manufacturing production, industrial output, and retail sales all declined for multiple consecutive months. With this backdrop, markets scaled back expectations for a rate hike at the BOE’s Monetary Policy Committee meeting in early November to just a 6% likelihood.
Japanese equities lagged broader DM stocks in October but maintained their top spot among DM peers YTD. In US dollar terms, however, Japan lagged the broader index YTD as the yen continued to weaken, reaching a 33-year low vis-à-vis the US dollar. This downward pressure, along with above-target inflation and the widening gap between JGB and US Treasury yields pressured the BOJ to soften its stance on keeping monetary policy ultra-loose. At the BOJ’s meeting this month, it left its benchmark short-term target rate at -0.1% but tweaked its YCC policy. Instead of employing a strict cap of 1% on ten-year JGBs, it will use a reference rate, thereby adding flexibility and removing its daily commitment to purchase unlimited bonds to preserve the cap. However, market analysts felt these measures would not meaningfully prevent further weakening of the yen. Notably, the BOJ also increased its core inflation expectation for FY2024 from 1.9% to 2.8%.
Pacific ex Japan equities lagged the broader DM index. Singapore declined the most, weighed down by its roughly 80% weight to three underperforming sectors—financials, industrials, and real estate. However, Australia and New Zealand declined the most in US dollar terms. The Reserve Bank of Australia (RBA) held its benchmark cash rate at 4.10% for a fourth consecutive meeting but warned it would consider rate hikes if inflation did not return to its 2% to 3% target range soon. Later in the month, Australian Q3 data showed inflation accelerated faster than anticipated, sparking concerns that the RBA would begin tightening again in November. The Reserve Bank of New Zealand announced it would keep its official cash rate steady at 5.50%, as expected. Accompanying statements, however, were less hawkish, weakening the New Zealand dollar.
Sources: MSCI Inc. and Thomson Reuters Datastream. MSCI data provided “as is” without any express or implied warranties.
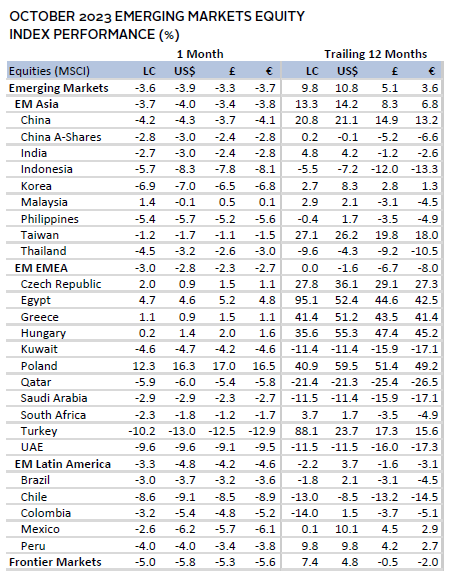
Emerging markets equities lagged DM peers in October. All regions declined, with Europe, the Middle East & Africa and Latin America topping the broader index, and Asia trailing. The four major EM Asia countries by weight—China, India, Korea, and Taiwan—contributed roughly 75% of the broad EM index’s decline.
China detracted the most, as the country dealt with a slew of economic and geopolitical headwinds. China’s largest private real estate developer Country Garden missed a payment on US dollar bonds, and offshore investors submitted a petition in Hong Kong to have embattled developed Evergrande wound down. This led to the real estate sector declining nearly 10%. Consumer spending softened and factory output unexpectedly contracted, raising concerns over the economic health of the heart of China’s economy. Meanwhile, the United States implemented new restrictions on technology transfer, prohibiting the shipment of some advanced microprocessors to China. As a result, China’s CSI 300 Index fell to its lowest level since before the pandemic. To combat this, Chinese officials proposed various stimulus programs, ranging from easing restrictions on local government borrowing to supporting and stabilizing equities.
Korea was the second largest contributor to EM weakness amid contracting manufacturing, falling consumer sentiment, and declining retail sales. The country also reported a steep miss on export growth, partly due to ongoing weakness in Chinese demand.
Sources: MSCI Inc. and Thomson Reuters Datastream. MSCI data provided “as is” without any express or implied warranties.
Fixed Income
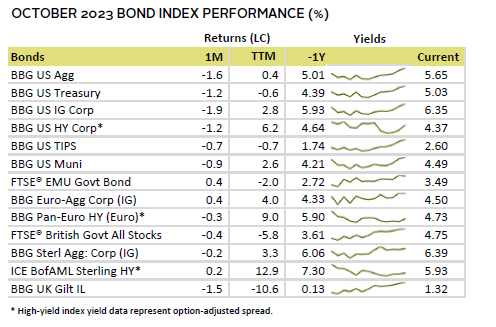
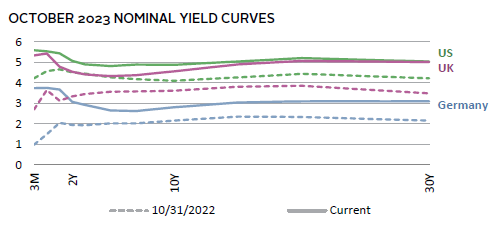
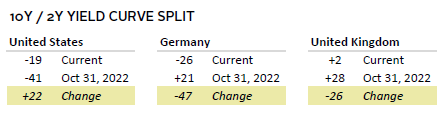
US fixed income assets declined in October as yields continued to back up. The ten-year yield rose 29 basis points (bps) to 4.88%, reaching a new post-2007 high and briefly surpassing 5% in intraday trading for the first time this cycle. The rise continued to be driven mostly by increasing real yields, rather than inflation expectations, as the ten-year US TIPS yield increasing 22 bps to 2.46%. Higher yields were driven by strong hiring data, disappointing Treasury auctions, and growing acceptance that the Fed will keep interest rates higher for longer. Yields on shorter-dated Treasuries were relatively flat as investors priced in nearly 100% odds that the Fed will not raise its benchmark policy rate at its meeting on November 1. This dynamic led the ten-year/two-year yield curve spread to narrow to -19 bps—the closest it’s been to un-inverting in more than a year.
UK gilts declined as the ten-year nominal gilt yield increased 17 bps to 4.56%. Linkers lagged nominal gilts amid rising real yields. UK high-yield corporates bested investment-grade equivalents and were the only major UK fixed income asset class to advance. German ten-year bund yields fell 3 bps to 2.81%. Yields on maturities less than one year and greater than ten years rose. European high-yield corporate bonds declined, and spreads expanded to their widest levels since 2020 as investors increasingly fear the slowing economy and higher rates could trigger more defaults.
Sources: Bank of England, Bloomberg Index Services Limited, Federal Reserve, FTSE Fixed Income LLC, FTSE International Limited, Intercontinental Exchange, Inc., and Thomson Reuters Datastream.
Real Assets
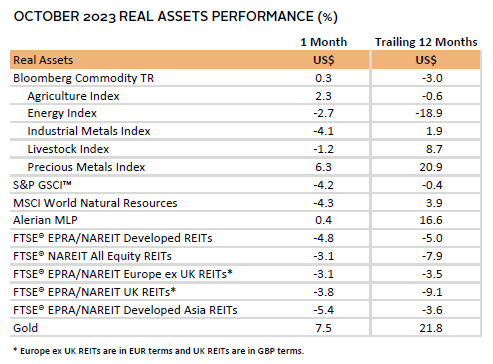
Commodity futures were mixed in October as the Bloomberg Commodity Total Return Index mildly advanced, boosted by precious metals, and the S&P GSCI declined due to its overweight to energy, which declined this month.
Oil prices ($87.41 for Brent and $81.02 for WTI) dropped significantly in October as investors’ anxiety that peak demand may be in the rearview mirror outweighed OPEC+’s announcement that it would maintain its output cuts. Prices rose briefly at the beginning of the Middle East conflict but ended the month near where they were just prior to the start of the conflict as investors increasingly believed there would be no material impact to oil supply.
Global natural resources equities declined as the major corporates in the index disappointed on earnings. Blended earnings for the S&P 500 energy sector sit at -38% YOY, by far the lowest among all sectors.
REITs continued their downward trajectory as global bond yields continued to rise. All property sectors fell save for data centers. Of note, some office vacancies in major metropolitan areas—such as New York, London, and San Francisco—reached highs not seen in at least two decades.
Gold prices advanced to $1,995.90 as geopolitical worries outweighed a stronger US dollar and surging real yields.
Sources: Alerian, Bloomberg L.P., EPRA, FTSE International Limited, Intercontinental Exchange, Inc., MSCI Inc., National Association of Real Estate Investment Trusts, Standard & Poor’s, and Thomson Reuters Datastream. MSCI data provided “as is” without any express or implied warranties.
Note: Gold performance based on spot price return.
USD-Based Investors
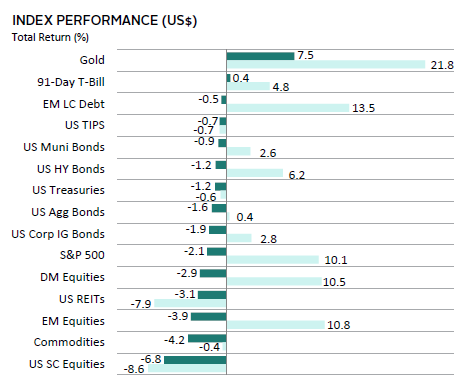
Most asset classes declined in October as geopolitical concerns heightened, bond yields continued their upward trajectory, and investors grappled with higher for longer interest rates. The exceptions were gold, which advanced as a safe haven despite a stronger US dollar and surging real yields, and cash, which eked out a gain. Within equities, US held up better than DM ex US peers, while broad DM bested EM. Dragged down by falling energy prices, US small caps and commodities declined the most. Gold, EM local currency debt, and global equities gained the most over the last year.
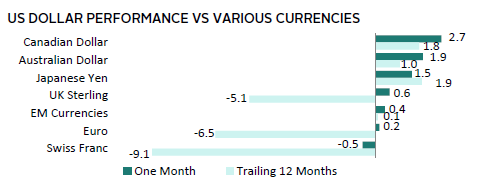
The US dollar broadly advanced, strengthening the most against the commodity-linked Canadian and Australian dollars, and Japanese yen, which has experienced tremendous weakening due to interest rate differentials. The greenback weakened only vis-à-vis the safe-haven Swiss franc. Over the last 12 months, the US dollar is weaker versus the Swiss franc, euro, and UK sterling, and gained the most vis-à-vis the Canadian and Australian dollars and Japanese yen.
With about 60% of the S&P 500 companies having reported thus far, the Q3 blended YOY growth rate of 3.0% is well above the 0.3% decline expected by analysts in September. That number improves to 8.7% when the energy sector is excluded. The US economy grew well above expectations in Q3 at 4.9% QOQ annualized. Strong consumer spending drove growth, contributing more than half of the economic expansion. A variety of other economic data on the labor market, economic output, home purchases, consumer confidence, and retail sales outpaced expectations, reinforcing the economy’s resilience. However, news of slightly higher-than-expected inflation data weighed on sentiment, as it implied that the Fed is more likely to keep rates elevated.
Sources: Bloomberg Index Services Limited, FTSE International Limited, Frank Russell Company, Intercontinental Exchange, Inc., J.P. Morgan Securities, Inc., MSCI Inc., National Association of Real Estate Investment Trusts, Standard & Poor’s, and Thomson Reuters Datastream. MSCI data provided “as is” without any express or implied warranties.
EUR-Based Investors
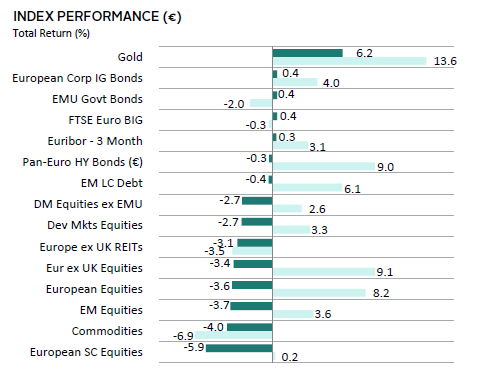
Risk assets mostly declined in October as geopolitical concerns heightened, bond yields continued their upward trajectory, and slowing growth weighed on sentiment. Gold, which advanced as a safe haven despite a stronger US dollar and surging real yields, was the exception. Safer fixed income asset classes eked out gains, while pan-European high-yield corporate bonds and EM local currency debt declined. Within equities, DM ex EMU held up better than European peers, and broad DM bested EM. European small caps and commodities, which were dragged down by falling energy prices, declined the most. Gold, high-yield corporates, and global equities gained the most over the last 12 months.
The euro mostly advanced, strengthening the most against the commodity-linked Canadian and Australian dollars, and Japanese yen, which has experienced tremendous weakening due to interest rate differentials. The common currency weakened only vis-à-vis the safe havens Swiss franc and US dollar. Over the last 12 months, the euro is weaker versus only the Swiss franc and gained the most vis-à-vis Japanese yen and the Canadian and Australian dollars.
The ECB maintained its benchmark deposit rate at 4.0% in October. This decision came amid swiftly declining, but still high, inflation data, and a weakening economic backdrop. ECB President Lagarde shared that the central bank would not rule out future rate hikes, stating it was “totally premature” to consider potential cuts. Headline CPI declined to 2.9% YOY—its lowest rate in more than two years—driven by lower energy and food prices, while core inflation ticked down to 4.2%. Meanwhile, GDP unexpectedly fell in Q3 and PMI measures of economic output became more contractionary. Additionally, consumer confidence and business sentiment remained negative, and retail sales disappointed.

Sources: Bloomberg Index Services Limited, EPRA, European Banking Federation, FTSE Fixed Income LLC, FTSE International Limited, Intercontinental Exchange, Inc., J.P. Morgan Securities, Inc., MSCI Inc., National Association of Real Estate Investment Trusts, Standard & Poor’s, and Thomson Reuters Datastream. MSCI data provided “as is” without any express or implied warranties.
GBP-Based Investors
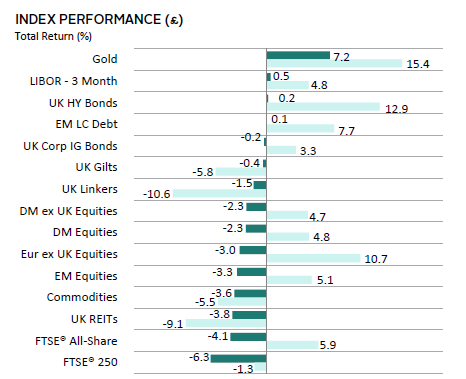
Risk assets mostly declined in October as geopolitical concerns heightened, bond yields continued their upward trajectory, and still-high inflation weighed on sentiment. Gold, which advanced as a safe haven despite a stronger US dollar and surging real yields, was the exception. Cash, UK high-yield bonds, and EM local currency debt eked out gains. Within equities, DM ex UK held up better than UK peers, and broad DM bested EM. UK stocks declined the most. UK REITs, pressured by rising interest rates, and commodities, dragged down by falling energy prices, also underperformed. Gold, Europe ex UK equities, and riskier debt gained the most over the last 12 months.
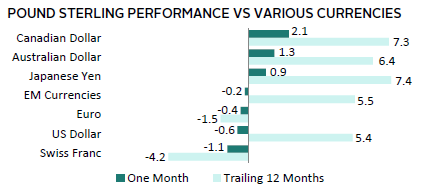
The UK sterling was mixed in October, gaining the most against the commodity-linked Canadian and Australian dollars, and Japanese yen, which has experienced tremendous weakening due to interest rate differentials. Sterling weakened the most vis-à-vis the safe havens Swiss franc and US dollar, and the euro. Over the last 12 months, UK sterling is mostly stronger, gaining the most vis-à-vis Japanese yen and the Canadian and Australian dollars, and declining only versus the Swiss franc and euro.
While trailing three-month GDP accelerated modestly, other data indicate that the economy is struggling. PMI measures of economic output remained contractionary, construction growth decelerated, and multiple measures of sentiment worsened. Further, manufacturing production, industrial output, and retail sales all declined for multiple consecutive months. With this backdrop, markets scaled back expectations for a rate hike at the BOE’s Monetary Policy Committee meeting in early November to just a 6% likelihood.
Sources: Bloomberg Index Services Limited, EPRA, FTSE International Limited, Intercontinental Exchange, Inc., J.P. Morgan Securities, Inc., MSCI Inc., National Association of Real Estate Investment Trusts, Standard & Poor’s, and Thomson Reuters Datastream. MSCI data provided “as is” without any express or implied warranties.
Performance Exhibits
All data are total returns unless otherwise noted. Total return data for all MSCI indexes are net of dividend taxes.
USD-Based Investors index performance chart includes performance for the Bloomberg US Aggregate Bond, Bloomberg US Corporate Investment Grade, Bloomberg US High Yield Bond, Bloomberg Municipal Bond, Bloomberg US TIPS, Bloomberg US Treasuries, ICE BofAML 91-Day Treasury Bills, FTSE® NAREIT All Equity REITs, J.P. Morgan GBI-EM Global Diversified, LBMA Gold Price, MSCI Emerging Markets, MSCI World, Russell 2000®, S&P 500, and S&P GSCI™ indexes.
EUR-Based Investors index performance chart includes performance for the Bloomberg Euro-Aggregate: Corporate, Bloomberg Pan-Euro High Yield (Euro), EURIBOR 3M, FTSE EMU Govt Bonds, FTSE Euro Broad Investment-Grade Bonds, FTSE® EPRA/NAREIT Europe ex UK RE, J.P. Morgan GBI-EM Global Diversified, LBMA Gold Price AM, MSCI Emerging Markets, MSCI Europe, MSCI Europe ex UK, MSCI Europe Small-Cap, MSCI World ex EMU, MSCI World, and S&P GSCI™ indexes.
GBP-Based Investors index performance chart includes performance for the Bloomberg Sterling Aggregate: Corporate Bond, Bloomberg Sterling Index-Linked Gilts, ICE BofAML Sterling High Yield, FTSE® 250, FTSE® All-Share, FTSE® British Government All Stocks, FTSE® EPRA/NAREIT UK RE, J.P. Morgan GBI-EM Global Diversified, LBMA Gold Price AM, LIBOR 3M GBP, MSCI Emerging Markets, MSCI Europe ex UK, MSCI World, MSCI World ex UK, and S&P GSCI™ indexes.
EM currencies is an equal-weighted basket of 20 emerging markets currencies.
Fixed Income Performance Table
Performance data for US TIPS reflect the Bloomberg US TIPS Index, with yields represented by the Bloomberg Global Inflation Linked Bond Index: US.