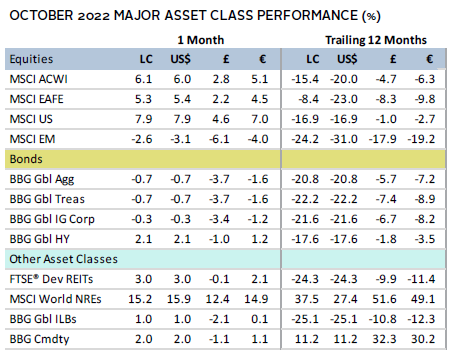
Risk assets rallied in October. Global equities recovered some of their steep third quarter losses, as developed markets topped emerging counterparts. The latter was dragged down by steep declines for Chinese shares following the Party Congress. Value topped growth for a third straight month, while small caps outgained large caps. Investment-grade bonds declined as US Treasury yields continued climbing and tightening credit spreads boosted high-yield corporates. Real assets were mostly higher last month, underscored by rising oil prices and surging profits for natural resources equities. The US dollar weakened for the first time in five months, whereas the euro and UK sterling appreciated.
Sources: Bloomberg Index Services Limited, Bloomberg L.P., EPRA, FTSE International Limited, MSCI Inc., National Association of Real Estate Investment Trusts, and Thomson Reuters Datastream. MSCI data provided “as is” without any express or implied warranties.
Note: Local currency returns for the Bloomberg fixed income indexes, the Bloomberg Commodity Index, and the FTSE® Developed REITs are in USD terms.
The Macro Picture
Nascent signs that central banks could begin slowing their torrid pace of rate hikes by year end helped markets rebound during the month. Still, there have been few clear catalysts for the relief rally. Earnings growth underperformed relative to earlier estimates, buoyed primarily by the high-flying energy sector. Economic data continues to weaken, and geopolitical developments led to a major sell-off in Chinese equities.
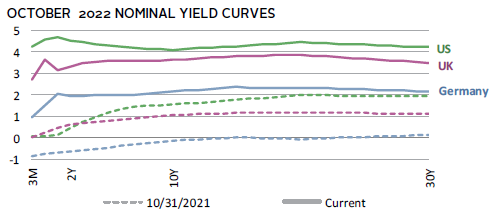
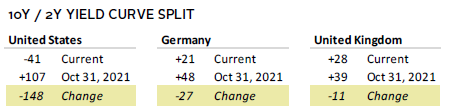
Softening economic data has fueled speculation that central banks could soon shift policy. Indeed, preliminary purchasing managers’ index (PMI) data suggested that economic activity in October contracted across much of the world, and both the International Monetary Fund and World Trade Organization revealed sobering growth expectations for 2023. The yield curve sent another worrying signal, as the three-month/ten-year US Treasury yield spread—the Federal Reserve’s preferred measure—inverted for the first time this cycle. Inversion between those tenors has been a consistent recession indicator over the past 50+ years and has historically coincided with the end of the Fed’s rate-hiking cycle. There is a growing consensus that more economic ramifications of this year’s policy tightening could be seen next year.
Chinese equities plunged in October, particularly offshore-listed shares. Xi Jinping secured an unprecedented third term as president and stacked his leadership ranks with loyalists, sparking investor fears that China will proceed with economically disruptive policies, such as the continuation of a zero-COVID policy. In addition, the United States unveiled measures that limit the ability of semiconductor companies to do business with China, which are among the strongest regulations against China to date.
Equities
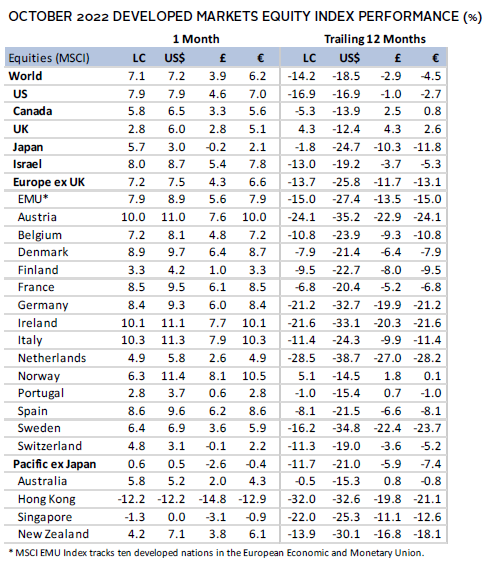
US equities rallied in October, overcoming mixed earnings results and continued upward pressure on bond yields. US stocks outperformed developed ex US peers for just the third time this year. Share prices rebounded after hitting new lows earlier in the month but remained roughly 20% off peak levels by month end. All 11 S&P 500 Index sectors gained, led by the cyclical and value-oriented energy, industrials, and financials sectors. Sectors more inversely related to interest rates—real estate, consumer discretionary, and communication services—gained the least. Value bested growth, extending year-to-date outperformance to more than 20 percentage points (ppts). Small caps topped large caps for the fifth time in the past six months.
Earnings results and economic data softened in October. S&P 500 earnings per share (EPS) are now expected to grow just 2% year-over-year (YoY) in third quarter, down from forecasts one month ago. Although US GDP expanded at a better-than-expected 2.6% annualized rate in third quarter (following two consecutive quarters of contraction), the pace of consumer spending and broader domestic demand slowed. In addition, PMI data underwhelmed expectations in October and indicated that economic activity contracted. These data raised expectations the Fed could slow its pace of rate hikes in the coming months. However, the US economy added more jobs than expected in September, and the unemployment rate fell to a 50+-year low at 3.5%. Core inflation data, which strips out volatile food and energy prices, accelerated to a new 40-year high at 6.6% YoY. The Fed is expected to lift rates by 75 basis points (bps) in early November, but market pricing regarding its forward rate path softened over the second half of the month.
European equities advanced and outperformed developed ex US shares. Europe ex UK topped UK counterparts for just the second time this year, with the latter outperforming by more than 17 ppts year-to-date.
Eurozone economic momentum weakened but falling natural gas prices provided some relief. Gas prices have declined more than 60% since peaking in August, as warm weather and storage space filled to near capacity have curbed demand. Still, prices remain well above levels seen prior to Russia’s invasion of Ukraine. Euro area GDP expanded 0.2% quarter-over-quarter (QoQ) in third quarter, slowing from nearly 1% growth in the second quarter. PMI measures slid further into contractionary territory in October, and various sentiment indicators continued deteriorating. Despite waning economic momentum, high inflation has forced the European Central Bank (ECB) to continue its hawkish shift. Indeed, inflation accelerated to a new record of 10.7% YoY in September and the ECB lifted policy rates by another 75 bps, bringing the benchmark deposit rate to 1.5%.
UK Prime Minister Liz Truss resigned after just 45 days in office, mired by her government’s widely unpopular tax cut and spending plans. The new government under Rishi Sunak has reversed course, announcing plans to raise taxes and rein in spending, which have calmed turmoil in the gilt markets. UK GDP contracted month-over-month in August, retail sales fell more than expected in September, and PMI activity measures fell deeper into contractionary territory in October. Although economic activity has slowed, the Bank of England (BOE) is expected to lift rates by 75 bps in November. This would mark its largest rate hike in more than 30 years.
Japanese equities gained on the month and topped broader developed ex US shares. Japanese stocks have held up well this year in local currency terms, but yen weakness translated to underperformance in major currency terms. Last month, the yen depreciated to 32-year lows versus the US dollar, and the government spent a record $43 billion during the month to support the currency’s value. In the meantime, the Bank of Japan (BOJ) made no changes to its accommodative monetary stance. Japanese Prime Minister Fumio Kishida unveiled a supplementary budget totaling $200 billion to stimulate growth and ease rising price pressures. Input prices have continued climbing, while consumer prices have risen to 3% YoY, above the BOJ’s target and the highest rate in more than eight years.
Pacific ex Japan equities were relatively flat in October, returning the least among major developed countries and regions. Hong Kong shares dragged down the broader index, buffeted by selling related to weakening activity and policy developments in China. Australia and New Zealand stocks performed more in line with broader developed ex US shares. The Reserve Bank of Australia hiked rates by a lower-than-expected 25 bps, taking the cash rate to 2.60%, opting for a slower pace of rate hikes as it assesses how monetary policy is feeding through to the economy. The Reserve Bank of New Zealand, on the other hand, raised the cash rate by 50 bps to 3.50%, and noted that rate setters had considered an even larger increase. Annual inflation in both countries is running near 30-year highs.
Sources: MSCI Inc. and Thomson Reuters Datastream. MSCI data provided “as is” without any express or implied warranties.
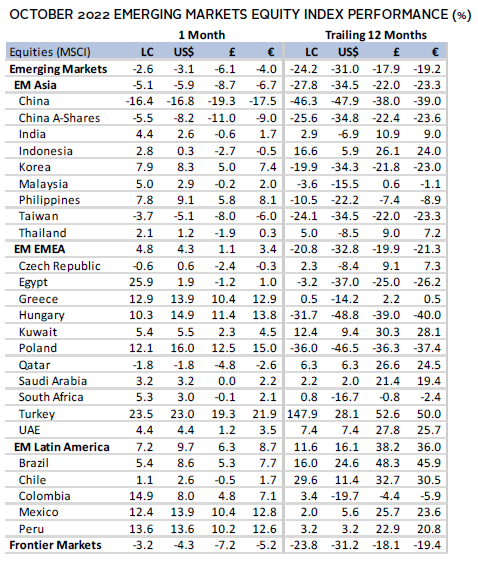
Emerging markets equities declined in October, with losses driven almost entirely by China. Excluding China, emerging markets (EM) shares advanced about 4%. In both cases, however, EM still trailed their developed peers on the month. China has had a similar impact this year, with the broader EM index holding up significantly better when China is excluded. Unsurprisingly, emerging Asia lagged among major regions in October, whereas Latin America and emerging Europe, the Middle East & Africa gained. Among major EM countries, China and Taiwan trailed, while Korea, Brazil, South Africa, India, and Saudi Arabia all advanced. Brazilian equities were a top performer among major EM countries as Luiz Inácio Lula da Silva was elected president in a second-round run-off vote, narrowly upending incumbent Jair Bolsonaro.
Chinese stocks declined the most since 2011 on the month, resulting in the largest trailing three-month drawdown since the Global Financial Crisis. Domestically oriented A-shares held up better, suggesting the selling was driven largely by foreign investors. Chinese GDP expanded 3.9% YoY in third quarter according to official sources, ahead of expectations and accelerating from growth of just 0.4% YoY in second quarter. Other data were less sanguine, however, as official PMI measures for October came in below expectations and pointed to contracting economic activity. In addition, retail sales and export growth slowed, while the unemployment rate increased. COVID-19 cases surged late in the month and containment measures were tightened across several major cities, underscoring the potential for further economic malaise if the zero-COVID policy persists.
Sources: MSCI Inc. and Thomson Reuters Datastream. MSCI data provided “as is” without any express or implied warranties.
Fixed Income
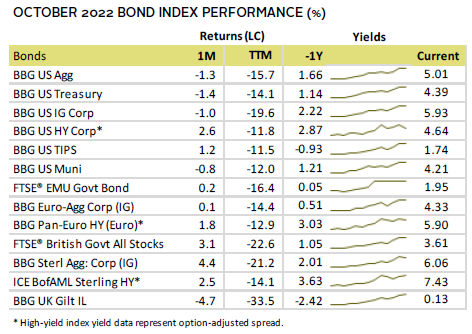
US fixed income markets were mixed in October as Treasury yields continued their upward climb. Investment-grade corporates and Treasuries declined, whereas high-yield corporates advanced. Credit spreads tightened by nearly 90 bps, reflective of the month’s risk-on mood. Five- and ten-year Treasury yields rose 21 bps and 27 bps to 4.27% and 4.10%, respectively, with yield levels across the curve closing above 4% and hitting their highest levels this cycle. The short end of the yield curve saw the largest upward moves, with three-month yields rising nearly 90 bps to 4.22%. US TIPS advanced as ten-year real yields fell 10 bps to 1.58%. The prevailing moves in nominal and inflation linked bonds meant that breakeven inflation expectations rose almost 40 bps, the largest increase since 2009.
Sterling- and euro-denominated bonds generally rose on the month. UK bonds gained the most as political and fiscal risks abated after Liz Truss’s resignation and the new government’s reversal of tax cut and spending plans. UK linkers were a notable exception, falling almost 5% as real yields continued climbing. Five- and ten-year gilt yields declined 75 bps and 49 bps to 3.57% and 3.62%, respectively. Ten-year German bund yields rose just 5 bps to 2.16%, as euro-denominated high-yield corporates topped investment-grade peers.
Real Assets
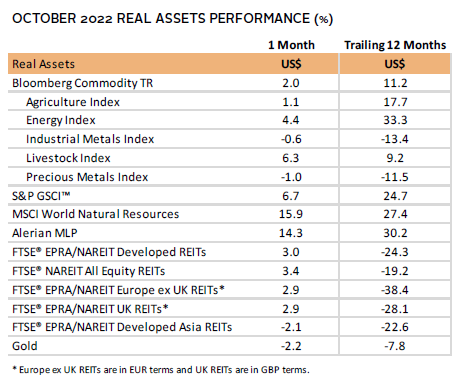
Commodities advanced, rebounding somewhat from weak performance in third quarter. Livestock, energy, and agriculture gained, whereas industrial and precious metals fell. Signs of economic weakness out of China weighed on metals prices, while agriculture prices rose after Russia suspended a deal to allow safe passage of Ukrainian exports.
Oil prices ($94.83 for Brent and $86.53 for WTI) rose nearly 10%, notching their first monthly gain since May. Prices remained roughly 30% below 2022 highs. Early in the month, OPEC+ announced plans to cut oil production by two million barrels per day. The weakening US dollar also contributed to the upward move in prices. At the same time, US petroleum exports hit a record high during the month, and signs emerged that the drawdown of the US strategic petroleum reserve may be nearing an end.
Global natural resources equities and energy MLPs were among the top-performing assets in October, bolstered by robust earnings growth and record profits across the industry.
Global REITs rallied following a sharp drawdown in third quarter, despite ongoing pressures on the sector. US REITs outperformed, Europe ex UK and UK REITs were in line with developed peers, whereas Asia REITs declined.
Gold prices ($1,638.03/troy ounce) fell for a seventh consecutive month and are now back to their lowest levels since early 2020. Gold continued falling despite US dollar weakness and economic uncertainty as higher interest rates have increased the opportunity cost of holding the yellow metal.
Sources: Alerian, Bloomberg L.P., EPRA, FTSE International Limited, Intercontinental Exchange, Inc., MSCI Inc., National Association of Real Estate Investment Trusts, Standard & Poor’s, and Thomson Reuters Datastream. MSCI data provided “as is” without any express or implied warranties.
Note: Gold performance based on spot price return.
USD-Based Investors
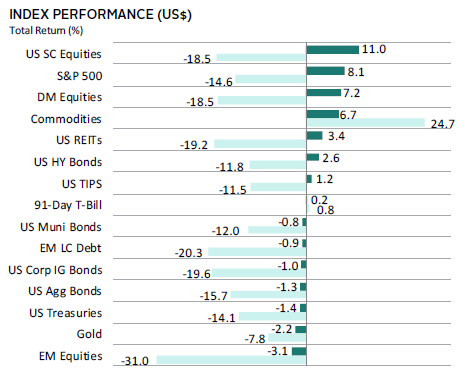
Risk assets rallied in October. While there were few clear catalysts for the risk-on mood, nascent signs that central banks could begin slowing their torrid pace of rate hikes by year end supported markets during the month. US stocks outperformed all asset classes, with small caps leading the way. In contrast, EM equities declined the most, buffeted by a steep decline for Chinese shares. EM stocks have also lagged over the past year. Investment-grade bonds declined as inflation remained elevated and yields rose to new cycle highs, whereas high-yield corporates and TIPS rose. Real assets were mixed; gold lagged, while commodities and REITs were among the top performers.
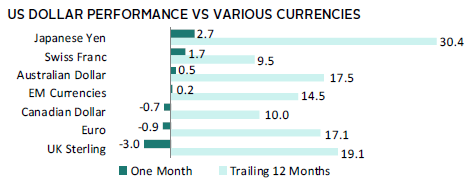
The US dollar was mixed but declined in aggregate for the first time since May. The greenback weakened vis-à-vis the UK sterling, euro, and Canadian dollar, but appreciated the most versus the safe-havens Japanese yen and Swiss franc. The dollar’s value gained broadly over the past year, strengthening the most versus the Japanese yen, UK sterling, and Australian dollar.
S&P 500 EPS are now expected to grow just 2% YoY in third quarter, down from forecasts one month ago. US GDP expanded at a better-than-expected 2.6% annualized pace in third quarter, but the rate of consumer spending and broader domestic demand growth slowed. PMI data underwhelmed expectations in October and indicated that economic activity contracted. The US economy added more jobs than expected in September, and the unemployment rate fell to a 50+-year low of 3.5%. Core inflation data accelerated to a new 40-year high at 6.6% YoY. Against this backdrop, the Fed is expected to lift rates by 75 bps in early November, but market pricing for the forward rate path softened over the second half of the month.
Sources: Bloomberg Index Services Limited, FTSE International Limited, Frank Russell Company, Intercontinental Exchange, Inc., J.P. Morgan Securities, Inc., MSCI Inc., National Association of Real Estate Investment Trusts, Standard & Poor’s, and Thomson Reuters Datastream. MSCI data provided “as is” without any express or implied warranties.
EUR-Based Investors
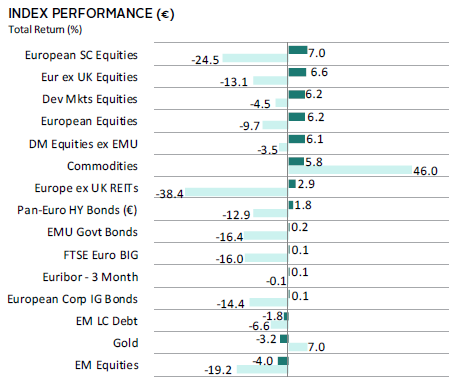
Risk assets rallied in October. European equities gained the most, with small caps leading the way. In contrast, EM equities declined the most, buffeted by a steep decline for Chinese shares. EM stocks are also among the laggards over the past year. Investment-grade bonds were flat as yields held steady on the month, with high-yield corporates outperforming. Real assets were mixed; gold lagged, while commodities and REITs moderately advanced.
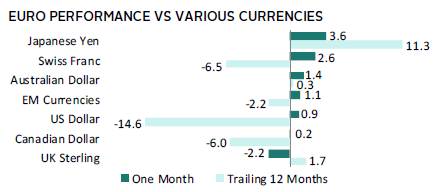
The euro generally gained in value last month, appreciating the most versus the Japanese yen, Swiss franc, and Australian dollar. The common currency weakened vis-à-vis only UK sterling. The euro was more mixed over the past year, falling the most versus the US dollar and Swiss franc, but gaining relative to the broadly weaker Japanese yen and UK sterling.
Eurozone economic momentum weakened but falling natural gas prices provided some relief. Gas prices have declined more than 60% since peaking in August as warm weather and storage space near capacity have curbed demand. Euro area GDP expanded 0.2% QoQ in third quarter, slowing from nearly 1% growth in the second quarter. PMI measures slid further into contractionary territory in October, and various sentiment indicators continued deteriorating. Inflation accelerated to a new record of 10.7% YoY in September and the ECB lifted policy rates by another 75 bps, bringing the benchmark deposit rate to 1.50%.
Sources: Bloomberg Index Services Limited, EPRA, European Banking Federation, FTSE Fixed Income LLC, FTSE International Limited, Intercontinental Exchange, Inc., J.P. Morgan Securities, Inc., MSCI Inc., National Association of Real Estate Investment Trusts, Standard & Poor’s, and Thomson Reuters Datastream. MSCI data provided “as is” without any express or implied warranties.
GBP-Based Investors
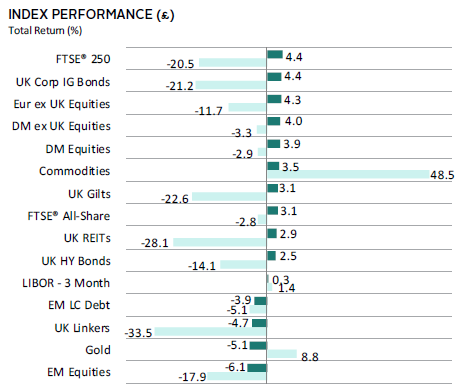
Risk assets rallied in October. Domestically oriented UK mid caps gained the most, outperforming global counterparts, whereas the broader market lagged developed peers. EM equities declined the most, buffeted by a steep decline for Chinese shares. Investment-grade corporate bonds and gilts advanced as yields fell on a sharp reversal of the government’s tax cut and spending plans. Real assets were mixed; gold lagged, while commodities and REITs gained.
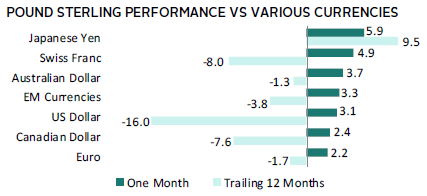
UK sterling appreciated broadly in October as fiscal and political risks abated, gaining the most versus the Japanese yen, Swiss franc, and Australian dollar. Still, the pound was mostly weaker over the past year, delivering outsized declines vis-à-vis the US dollar, Swiss franc, and Canadian dollar. Sterling gained versus only the broadly weaker Japanese yen over the past 12 months.
UK Prime Minister Liz Truss resigned after just 45 days, mired by her government’s widely unpopular tax cut and spending plans. The new government under Rishi Sunak has reversed course, announcing plans to raise taxes and rein in spending, which has calmed turmoil in the gilt markets. UK GDP contracted month-on-month in August, retail sales fell more than expected in September, and PMI activity measures fell deeper into contractionary territory in October. Although economic activity has slowed, the BOE is expected to lift rates by 75 bps in November. This would mark its largest rate hike in more than 30 years.
Sources: Bloomberg Index Services Limited, EPRA, FTSE International Limited, Intercontinental Exchange, Inc., J.P. Morgan Securities, Inc., MSCI Inc., National Association of Real Estate Investment Trusts, Standard & Poor’s, and Thomson Reuters Datastream. MSCI data provided “as is” without any express or implied warranties.
Performance Exhibits
All data are total returns unless otherwise noted. Total return data for all MSCI indexes are net of dividend taxes.
USD-Based Investors index performance chart includes performance for the Bloomberg US Aggregate Bond, Bloomberg US Corporate Investment Grade, Bloomberg US High Yield Bond, Bloomberg Municipal Bond, Bloomberg US TIPS, Bloomberg US Treasuries, ICE BofAML 91-Day Treasury Bills, FTSE® NAREIT All Equity REITs, J.P. Morgan GBI-EM Global Diversified, LBMA Gold Price, MSCI Emerging Markets, MSCI World, Russell 2000®, S&P 500, and S&P GSCI™ indexes.
EUR-Based Investors index performance chart includes performance for the Bloomberg Euro-Aggregate: Corporate, Bloomberg Pan-Euro High Yield (Euro), EURIBOR 3M, FTSE EMU Govt Bonds, FTSE Euro Broad Investment-Grade Bonds, FTSE® EPRA/NAREIT Europe ex UK RE, J.P. Morgan GBI-EM Global Diversified, LBMA Gold Price AM, MSCI Emerging Markets, MSCI Europe, MSCI Europe ex UK, MSCI Europe Small-Cap, MSCI World ex EMU, MSCI World, and S&P GSCI™ indexes.
GBP-Based Investors index performance chart includes performance for the Bloomberg Sterling Aggregate: Corporate Bond, Bloomberg Sterling Index-Linked Gilts, ICE BofAML Sterling High Yield, FTSE® 250, FTSE® All-Share, FTSE® British Government All Stocks, FTSE® EPRA/NAREIT UK RE, J.P. Morgan GBI-EM Global Diversified, LBMA Gold Price AM, LIBOR 3M GBP, MSCI Emerging Markets, MSCI Europe ex UK, MSCI World, MSCI World ex UK, and S&P GSCI™ indexes.
EM currencies is an equal-weighted basket of 20 emerging markets currencies.
Fixed Income Performance Table
Performance data for US TIPS reflect the Bloomberg US TIPS Index, with yields represented by the Bloomberg Global Inflation Linked Bond Index: US.