Global equities delivered their highest monthly gains this year in October, driven by US equities. Developed markets bested emerging counterparts, widening trailing 12-month outperformance to multi-year highs. Growth topped value and large caps outperformed small caps, resuming recent trends that had paused last month. Fixed income assets generally declined as bond markets priced in earlier-than-expected central bank rate hikes and inflation expectations rose. Inflation-sensitive and real assets categories continued climbing amid raw material shortages and global energy price hikes. Among currencies, the US dollar and euro generally depreciated, whereas UK sterling mostly advanced.
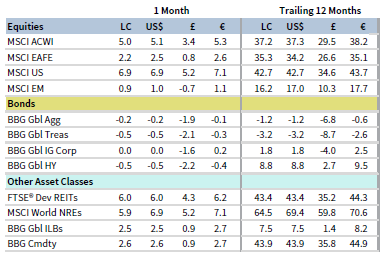
OCTOBER 2021 MAJOR ASSET CLASS PERFORMANCE (%)
Sources: Bloomberg Index Services Limited, Bloomberg L.P., EPRA, FTSE International Limited, MSCI Inc., National Association of Real Estate Investment Trusts, and Thomson Reuters Datastream. MSCI data provided “as is” without any express or implied warranties.
Note: Local currency returns for the Bloomberg fixed income indexes, the Bloomberg Commodity Index, and the FTSE® Developed REITs are in USD terms.
The Macro Picture
Capital markets performance in October reflected a decidedly risk-on environment. Better-than-expected calendar third quarter earnings results helped propel global equity indexes to new all-time highs. In addition, service sector activity accelerated, thanks in part to easing COVID-19 restrictions in certain geographies, lifting overall business activity indicators. The US averted a debt default crisis after the passage of a short-term measure to raise the nation’s borrowing limit, but another political standoff is likely in December when the stopgap measure expires.
Global inflationary pressures keep building, driven by supply-demand imbalances and surging commodity prices. Supply bottlenecks have constrained manufacturing output and pushed up input costs at some of the fastest rates on record, but strong demand continues to drive robust new order growth. China’s deepening energy crisis has dampened manufacturing output and threatens to exacerbate supply chain issues across the world.
These dynamics have led bond markets to price in higher inflation expectations, and developed markets central banks have started responding. The Bank of Canada abruptly ended its pandemic-era bond-buying program and brought forward its rate hiking timeline. The Reserve Bank of Australia (RBA) did not defend a key bond yield target in October and ended its yield curve control program just after month-end. Markets are expecting more central banks to tighten policy in the coming months, which has contributed to recent yield curve flattening. Still, global central bankers face a challenging environment of surging inflation and slowing economic growth. As some policymakers have noted, monetary policy adjustments cannot directly solve supply-side shocks.
Equities
US equities excelled, gaining the most since last November and outperforming their developed ex US and emerging markets peers. US shares closed the month at all-time highs. All 11 S&P 500 Index sectors advanced, led by consumer discretionary, energy, and information technology, while communication services, consumer staples, and utilities gained the least. Growth stocks bested value counterparts and large caps topped small caps, though small caps maintained their lead over the trailing 12-month period. S&P 500 earnings per share expanded 37% year-over-year in third quarter, based on a blend of the latest estimates and actual results from more than half of the index. Analysts expected EPS growth of 27% year-over-year at the start of reporting season.
US economic growth in third quarter slowed and missed expectations, with the first preliminary read indicating US GDP expanded at a 2.0% annualized rate. But other economic data released in October were more constructive. Consumer spending and retail sales exceeded expectations, consumer confidence rose for the first time in four months, and wage growth accelerated in third quarter. The US economy added far fewer jobs than anticipated in September, due in large part to a decline in public sector employment. However, the report included large upward revisions to prior months, and weekly initial unemployment claims fell during the month to pandemic-era lows. Preliminary PMI reports suggested activity in the services sector expanded at an accelerating pace. Manufacturing activity softened, highlighted by an unexpected decline in industrial production. Headline consumer and producer price inflation remained elevated, while the Fed’s September meeting minutes indicated asset purchase tapering could begin as soon as November.
European equities advanced but trailed the broader developed markets index due to US equity strength. European shares managed to outperform developed ex US equivalents. Europe ex UK markets outperformed UK peers for the fifth time in the past six months, but have underperformed year-to-date in major currency terms on UK sterling appreciation.
European companies grew EPS 44% year-over-year in third quarter, based on results from nearly half of the Stoxx 600 Index expected to report. Results have largely exceeded analyst expectations, but a bulk of the earnings growth is being derived from the energy sector. Ex-energy, EPS growth drops to 24%. Third quarter Eurozone GDP also beat forecasts, growing 2.2% quarter-over-quarter based on preliminary estimates. However, conditions looked less favorable at the start of fourth quarter. Eurozone activity across manufacturing and services slowed to multi-month lows in October. Industrial output fell back below pre-pandemic levels in August, with semiconductor shortages limiting automobile output. Germany has been particularly at risk from supply bottlenecks, raw material shortages, and rising input prices, with German economic sentiment falling for a fifth straight month in October.
Bank of England officials stepped up their hawkish rhetoric during the month, priming markets for earlier-than-expected rate hikes. Markets have responded, pricing in at least 15 basis points (bps) of tightening by year-end versus earlier positioning for the first rate lift sometime in 2022. Preliminary October PMI figures showed an acceleration in economic activity across both manufacturing and services, despite cost pressures reaching record high levels.
Japanese equities declined for the month and underperformed all major developed markets countries and regions. Shares have also trailed year-to-date, besting only Pacific ex Japan. Activity in Japan’s services sector expanded for the first time in 21 months in October, according to preliminary PMI readings. Manufacturing activity remains buoyed by a renewed rise in new orders, despite supply constraints and rising input prices. September’s industrial production declined more than expected, whereas export growth topped consensus estimates. Newly minted Prime Minister Fumio Kishida’s party maintained its majority in late October’s election. Kishida has signaled plans to break with the “Abenomics” economics policy regime that has been in place for nearly a decade, instead focusing on policies to raise income levels broadly and spur consumption.
Pacific ex Japan equities gained but trailed broader developed counterparts. Pacific ex Japan stocks now lag by 11 and 15 percentage points (ppts) year-to-date and over the trailing 12 months, respectively. Singapore and Hong Kong outperformed, whereas New Zealand and Australia declined. The RBA’s preferred inflation gauge accelerated 2.1% year-over-year in third quarter, the highest rate in six years. With inflation back within the RBA’s 2%–3% target range, the RBA allowed short-term yields to jump 8x above their 0.1% target level. Australian business activity expanded for the first time in four months in October, driven by a sharp rebound in services, according to preliminary PMI figures. The Reserve Bank of New Zealand (RBNZ) raised its policy cash rate for the first time in seven years by 0.25%, a move widely expected by markets. The RBNZ expects to tighten policy further at future meetings.
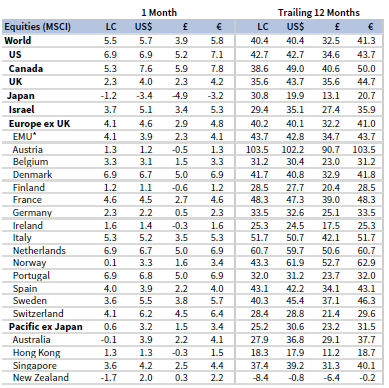
OCTOBER 2021 DEVELOPED MARKETS EQUITY INDEX PERFORMANCE (%)
Sources: MSCI Inc. and Thomson Reuters Datastream. MSCI data provided “as is” without any express or implied warranties.
Emerging markets equities advanced but lagged their developed markets peers for the seventh time this year. Emerging shares now trail developed counterparts by 24 ppts over the past 12 months, their widest trailing 12-month underperformance margin in nearly eight years. Emerging Europe, the Middle East & Africa outperformed, emerging Asia edged the broader index, and Latin America declined. China was the lone outperformer among major emerging countries, while South Africa matched the broader index. Taiwan and India underperformed, posting relatively flat returns, and Brazil and Korea declined.
Latin America trailed the broader emerging index for a third consecutive month in October; during this period Brazil has declined more than 15%. Brazil’s central bank raised rates by 150 bps in October to 7.75%, which was the largest rate hike in almost 20 years. This brings year-to-date rate increases to 575 bps as policymakers attempt to rein in inflation. Markets also appear to be concerned regarding Brazil’s fiscal sustainability as government spending this year is expected to exceed constitutionally allowed limits, which has contributed to Brazilian real depreciation. Markets fear additional spending pressure may be on the horizon as the unpopular President Jair Bolsonaro seeks to improve his position heading into next year’s presidential election.
China’s GDP growth slowed to 4.9% year-over-year in third quarter, just missing consensus expectations. Chinese housing prices declined for the first time in six years in September, sales volumes declined nearly 20%, and at least four real estate developers missed payments on debt during the month. Chinese equities outperformed the broader index as authorities indicated they expect to achieve significant progress with the ongoing regulatory crackdown on large tech companies by year end.
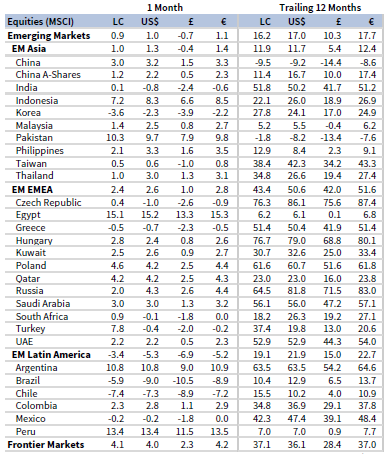
OCTOBER 2021 EMERGING MARKETS EQUITY INDEX PERFORMANCE (%)
Sources: MSCI Inc. and Thomson Reuters Datastream. MSCI data provided “as is” without any express or implied warranties.
Fixed Income
US fixed income performance was relatively flat as breakeven inflation rates rose to multi-year highs and the yield curve flattened. US investment-grade corporate bonds gained and bested Treasuries, while high-yield corporates lagged. Five- and ten-year Treasury yields rose 20 bps and 3 bps to 1.18% and 1.55%, respectively. The ten-year/two-year Treasury yield spread declined 17 bps. However, curve flattening was even more apparent compared to longer-dated maturities as the 30-year Treasury yield declined 15 bps to 1.93%. US TIPS outperformed other US fixed income peers, sending ten-year breakeven inflation up 14 bps to 2.51% by month-end. That said, ten-year inflation expectations climbed as high as 2.69% intra-month, their highest level since 2006.
UK gilts bested their investment-grade and high-yield corporate counterparts, while inflation-linked gilts delivered top performance among sterling-denominated bonds. UK inflation expectations also climbed, briefly reaching nearly 4.5% according to ten-year inflation swaps. Five-year gilt yields rose 17 bps to 0.79%, while ten-year yields remained unchanged at 1.04%. Reflecting the BOE’s tightening stance, two-year yields rose 32 bps, whereas yields on ten-year+ maturity bonds declined. Euro-denominated bonds declined as German ten-year bund yields rose 5 bps to -0.15%, touching their highest level since mid-2019.

OCTOBER 2021 BOND INDEX PERFORMANCE (%)

OCTOBER 2021 NOMINAL YIELD CURVES

10Y/2Y YIELD CURVE SPLIT
Sources: Bank of England, Bloomberg Index Services Limited, BofA Merrill Lynch, Federal Reserve, FTSE Fixed Income LLC, FTSE International Limited, Intercontinental Exchange, Inc., and Thomson Reuters Datastream.
Real Assets
Commodity futures advanced for the tenth time in the past 12 months, driven by gains across most sub-sectors. Industrial metals led performance in October as aluminum prices hit their highest point since 2008, due in part to the energy-intensive production process and raw materials shortages amid China’s ongoing power crisis.
Oil prices ($84.38 for Brent and $83.57 for WTI) continued their year-to-date upward climb, with the global and US benchmarks gaining more than 60% and 70%, respectively, over that time. Oil prices eclipsed $85/barrel in October for the first time in several years. As the global energy crunch roils markets, OPEC+ opted to not increase the pace of its gradual, 400,000 barrel/day per month production hikes, keeping a lid on available supply. Meanwhile, the International Energy Agency noted that natural gas shortages in Europe and Asia could be deepening already sizable crude oil supply deficits.
Global natural resources equities and energy MLPs delivered among the top real asset returns, boosted by rising energy prices and strong earnings results. They remain among the top performers over the past 12 months.
Global developed REITs also advanced, led by US REITs. Europe ex UK REITs, UK REITs, and developed Asia REITs also gained but lagged the broader index.
Gold prices ($1,776.81/troy ounce) lagged all major real assets categories despite falling real yields and surging inflation expectations. The yellow metal remains a laggard over the past year as gold funds have seen ongoing outflows.
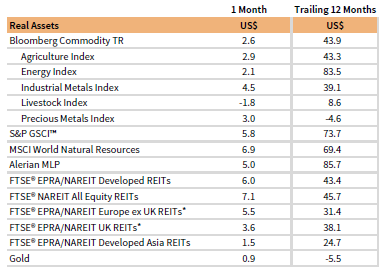
OCTOBER 2021 REAL ASSETS PERFORMANCE (%)
Sources: Alerian, Bloomberg L.P., EPRA, FTSE International Limited, Intercontinental Exchange, Inc., MSCI Inc., National Association of Real Estate Investment Trusts, Standard & Poor’s, and Thomson Reuters Datastream. MSCI data provided “as is” without any express or implied warranties.
Note: Gold performance based on spot price return.
USD-Based Investors
Equities and inflation-sensitive assets outperformed fixed income in October as early earnings results exceeded expectations and rates markets priced in higher inflation expectations. US large caps topped all major equity categories, whereas emerging markets equities lagged. Commodities’ gains continued, with their outsized trailing 12-month return encapsulating the ongoing supply chain disruptions and materials shortages amid robust demand. Fixed income assets, save for investment-grade corporate bonds, declined as Treasury yields generally increased and signs emerged that the coming central bank tightening cycle could commence sooner than expected.
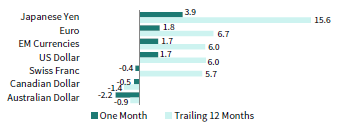
The US dollar mostly depreciated, falling the most versus the commodity-linked Australian and Canadian dollars, which also saw rising yields and tightening monetary policy prospects during the month. The dollar gained against the Japanese yen and euro. Trends in the greenback’s performance were largely similar over the trailing 12-month period.
S&P 500 earnings per share expanded 37% year-over-year in third quarter, based on a blend of the latest estimates and actual results from more than half of the index. Analysts expected EPS growth of 27% year-over-year at the start of reporting season. Consumer spending and retail sales exceeded expectations, consumer confidence rose for the first time in four months, and wage growth accelerated in third quarter. Preliminary PMI reports suggested that services sector activity growth expanded, but manufacturing activity softened, highlighted by an unexpected industrial production decline. Headline consumer price inflation remained above 5% year-over-year, while producer price inflation accelerated to 8.6%.

INDEX PERFORMANCE (US$)
US DOLLAR PERFORMANCE VS VARIOUS CURRENCIES
Sources: Bloomberg Index Services Limited, FTSE International Limited, Frank Russell Company, Intercontinental Exchange, Inc., J.P. Morgan Securities, Inc., MSCI Inc., National Association of Real Estate Investment Trusts, Standard & Poor’s, and Thomson Reuters Datastream. MSCI data provided “as is” without any express or implied warranties.
EUR-Based Investors
Equities and real assets outperformed fixed income in October as early earnings results exceeded expectations and rates markets priced in higher inflation expectations. Developed markets equities outgained emerging peers, which lagged the most among equity categories for the month and over the past year. European shares trailed the broader developed index largely due to strong US returns, while European large caps outgained small caps.
Commodities’ gains continued, with their outsized trailing 12-month return encapsulating the ongoing supply chain disruptions and materials shortages amid robust demand. Fixed income assets declined as government bond yields generally increased, the yield curve flattened, and markets anticipated that the coming central bank tightening cycle could commence sooner than the ECB currently projects.
The euro generally weakened in October, depreciating the most vis-à-vis the commodity-linked Australian and Canadian dollars, which also saw rising yields and tightening monetary policy prospects during the month. Trends in the common currency’s performance were largely similar over the trailing 12-month period.
European companies grew EPS 44% year-over-year in third quarter, but a bulk of the earnings growth is being derived from the energy sector. Ex-energy, EPS growth drops to 24%. Eurozone GDP also beat forecasts, growing 2.2% quarter-over-quarter based on preliminary estimates. However, Eurozone activity across manufacturing and services slowed to multi-month lows in October, according to preliminary PMI readings. Industrial output fell back below pre-pandemic levels in August, with semiconductor shortages limiting automobile output. German economic sentiment fell for a fifth straight month in October.

INDEX PERFORMANCE (€)

EURO PERFORMANCE VS VARIOUS CURRENCIES
Sources: Bloomberg Index Services Limited, EPRA, European Banking Federation, FTSE Fixed Income LLC, FTSE International Limited, Intercontinental Exchange, Inc., J.P. Morgan Securities, Inc., MSCI Inc., National Association of Real Estate Investment Trusts, Standard & Poor’s, and Thomson Reuters Datastream. MSCI data provided “as is” without any express or implied warranties.
GBP-Based Investors
Non-UK developed equities and inflation-sensitive assets gained the most in October as early earnings results exceeded expectations and rates markets priced in higher inflation expectations. UK shares lagged their developed counterparts, due in part to strong US performance, while UK mid-caps trailed the broader market. Emerging markets gained the least among equities for the month and over the past year.
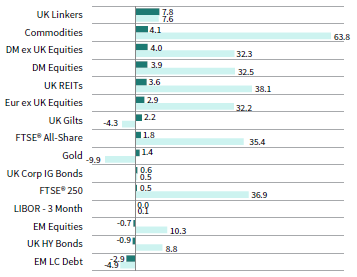
Commodities’ gains continued, with their outsized trailing 12-month return encapsulating the ongoing supply chain disruptions and materials shortages amid robust demand. Sterling-denominated fixed income assets generally gained despite surging inflation expectations and a growing consensus that the Bank of England will tighten policy sooner than originally anticipated. UK high-yield corporate bonds declined but gained the most among fixed income assets over the past year.
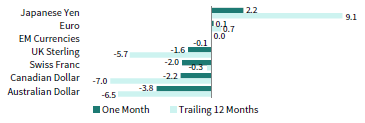
UK sterling mostly appreciated in October, gaining the most versus the Japanese yen and euro, and declining the most versus the commodity-linked Australian and Canadian dollars. The latter two also saw rising yields and tightening monetary policy prospects during the month. Trends in sterling’s performance were largely similar over the past year.
Bank of England officials stepped up their hawkish rhetoric during the month, priming markets for earlier-than-expected rate hikes. Rates markets have responded, pricing in at least 15 basis points (bps) of tightening by year-end versus earlier positioning for the first rate lift sometime in 2022. Preliminary October PMI figures showed an acceleration in economic activity across both manufacturing and services, despite cost pressures reaching record high levels.
INDEX PERFORMANCE (£)
POUND STERLING PERFORMANCE VS VARIOUS CURRENCIES
Sources: Bloomberg Index Services Limited, EPRA, FTSE International Limited, Intercontinental Exchange, Inc., ICE Benchmark Administration Ltd., J.P. Morgan Securities, Inc., MSCI Inc., National Association of Real Estate Investment Trusts, Standard & Poor’s, and Thomson Reuters Datastream. MSCI data provided “as is” without any express or implied warranties.
Performance Exhibits
All data are total returns unless otherwise noted. Total return data for all MSCI indexes are net of dividend taxes.
USD-Based Investors index performance chart includes performance for the Bloomberg US Aggregate Bond, Bloomberg US Corporate Investment Grade, Bloomberg US High Yield Bond, Bloomberg Municipal Bond, Bloomberg US TIPS, Bloomberg US Treasuries, ICE BofAML 91-Day Treasury Bills, FTSE® NAREIT All Equity REITs, J.P. Morgan GBI-EM Global Diversified, LBMA Gold Price, MSCI Emerging Markets, MSCI World, Russell 2000®, S&P 500, and S&P GSCI™ indexes.
EUR-Based Investors index performance chart includes performance for the Bloomberg Euro-Aggregate: Corporate, Bloomberg Pan-Euro High Yield (Euro), EURIBOR 3M, FTSE EMU Govt Bonds, FTSE Euro Broad Investment-Grade Bonds, FTSE® EPRA/NAREIT Europe ex UK RE, J.P. Morgan GBI-EM Global Diversified, LBMA Gold Price AM, MSCI Emerging Markets, MSCI Europe, MSCI Europe ex UK, MSCI Europe Small-Cap, MSCI World ex EMU, MSCI World, and S&P GSCI™ indexes.
GBP-Based Investors index performance chart includes performance for the Bloomberg Sterling Aggregate: Corporate Bond, Bloomberg Sterling Index-Linked Gilts, ICE BofAML Sterling High Yield, FTSE® 250, FTSE® All-Share, FTSE® British Government All Stocks, FTSE® EPRA/NAREIT UK RE, J.P. Morgan GBI-EM Global Diversified, LBMA Gold Price AM, LIBOR 3M GBP, MSCI Emerging Markets, MSCI Europe ex UK, MSCI World, MSCI World ex UK, and S&P GSCI™ indexes.
EM currencies is an equal-weighted basket of 20 emerging markets currencies.
Fixed Income Performance Table
Performance data for US TIPS reflect the Bloomberg US TIPS Index, with yields represented by the Bloomberg Global Inflation Linked Bond Index: US.