Risk assets generally sold off in October, but investors found little respite in traditional safe-haven assets. US Treasuries and gold turned lower amid a backdrop of ultralow yields and elevated prices. Global equities fell in aggregate, dragged lower by developed stocks while emerging markets gained. Growth and value stocks fell by similar magnitudes, while small caps topped large caps. Bond performance was muted for the month, with high-yield and investment-grade corporates outpacing sovereign bonds in most regions. Real assets generally underperformed, as oil prices, REITs, natural resource equities, and gold all stumbled. The US dollar and UK sterling were mixed, while the euro generally depreciated.
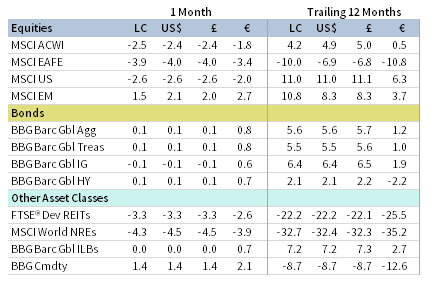
OCTOBER 2020 MAJOR ASSET CLASS PERFORMANCE (%)
Sources: Bloomberg Index Services Limited, Bloomberg L.P., FTSE International Limited, MSCI Inc., and Thomson Reuters Datastream. MSCI data provided “as is” without any express or implied warranties.
Note: Local currency returns for the Bloomberg Barclays indexes, the Bloomberg Commodity Index, and the FTSE® Developed REITs are in USD terms.
The Macro Picture
Equity market volatility spiked in October as the COVID-19 resurgence and reinstatement of virus containment measures clouded the economic outlook. Global daily infection rates reached new records as case numbers surged in Europe and the United States. In response to the rising number of new infections, multiple European countries announced nationwide restrictions on certain business activities. The reintroduction of lockdowns threatens to hamper recent economic improvement, which has been stronger than expected across regions. In third quarter, US and Eurozone GDP grew at a record pace, but globally GDP remains below pre-COVID levels.
Relative equity market performance largely reflected trends in COVID-19 cases. European and US equities declined, but emerging Asia stocks strongly outperformed with the virus largely contained across the region. Emerging Asia equities have outperformed broader global stocks by 5 percentage points (ppts) year-to-date, driven by Chinese equity outperformance. Third quarter’s earnings season has progressed better than expected across regions, but profits are still registering sharp year-over-year declines in developed markets.
US Congress failed to pass additional fiscal stimulus prior to the election break, further weighing on sentiment. Equity markets have been highly sensitive to the negotiations in the past several months. However, both sides remain deadlocked on partisan sticking points such as state and local funding and unemployment insurance. The November 3 general election now takes center stage, and investors will anxiously await the result and its implications for future fiscal relief packages along with longer-term policies.
Equities
US equities declined for the second consecutive month, but outperformed developed ex US peers, extending year-to-date outperformance to nearly 17 ppts. US stocks ended the month with their worst weekly decline since March, approaching correction territory from early September highs, as daily new COVID-19 infections neared 100,000 and the upcoming election loomed. Nine of 11 S&P 500 Index sectors declined for the month, dragged lower by information technology, energy, and health care, whereas utilities and communication services gained. Growth stocks trailed value counterparts for the second consecutive month but have outperformed by 42 ppts over the past year, while small caps bested large caps. The US earnings season is progressing better than expected with companies beating analyst estimates at some of the highest rates on record. Overall EPS are expected to decline nearly 10% year-over-year, a marked improvement from the 21% decline expected at the end of third quarter.
Backward-looking economic data released in October were mixed. US third quarter GDP expanded a record 33.1% annualized, recovering sharply from second quarter’s record contraction. Still, the US economy was down nearly 3% on a year-over-year basis and remains 3.5% smaller than it was at 2019 year-end. The labor market recovery decelerated, with the United States adding fewer jobs than expected in September—the first monthly reading with fewer than one million net additions since the rebound began in May. The United States has now added back roughly half of the 22 million jobs lost, and the unemployment rate is down to 7.9% from a peak of 14.7%. Consumer spending indicators exceeded expectations, while preliminary manufacturing and services activity surveys implied further expansion despite a decline in official industrial production figures.
European equities declined the most among major developed markets regions as COVID-19 cases spiked and officials announced nationwide lockdown measures across the region. UK shares edged Europe ex UK counterparts, but remain a significant laggard year-to-date. European equities now trail developed ex Europe by nearly 18 ppts year-to-date. The Eurozone’s third quarter economic recovery exceeded expectations with record GDP growth of 12.7% quarter-over-quarter; however, as in the United States, GDP remains below pre-pandemic levels. European third quarter corporate earnings season has also progressed better than earlier expectations, but EPS declined 17% year-over-year based on results from nearly half of companies expected to report. These better-than-expected data did little to assuage equity markets. More troubling economic signals emerged: Eurozone CPI fell into deflation for the third consecutive month in October, the labor market recovery ended with jobless numbers increasing by 75,000, and preliminary business activity indicators missed expectations, falling into contractionary territory.
Brexit negotiations ramped up with the year-end transition deadline fast approaching. Trade talks had stalled in mid-October, leading Prime Minister Boris Johnson to warn that the country should prepare for a no-deal Brexit outcome. However, talks resumed by month-end and now enter an intensified final phase. Key outstanding issues included fishing waters access and fair competition rules for businesses. The ongoing uncertainty has dented UK equity valuations. Our normalized metric ended the month at the 11th percentile on an absolute basis and at the lowest relative valuation to broader developed markets since 1979.
Japanese equities declined but outperformed broad developed markets for the third consecutive month, as the world’s third-largest economy has relatively limited COVID-19 infections in comparison to the United States and Europe. Still, the Bank of Japan lowered its current fiscal year growth forecast, citing a sluggish recovery stemming from consumer and business caution. Economic data released in October showed retail sales underwhelming expectations, consumer spending declining on a year-over-year basis, and business activity indicators remaining in contractionary territory. While still early in reporting season, Japanese corporate EPS are expected to post year-over-year declines for the eighth consecutive quarter.
Emerging markets equities advanced in October and outperformed developed markets peers, widening year-to-date outperformance to more than 6 ppts. Heavily weighted emerging Asia outperformed for the month, while emerging Europe, the Middle East & Africa (EMEA) and Latin America declined. The emerging index’s year-to-date gain has been entirely driven by emerging Asian stocks. China and India outperformed among major emerging countries in October, while Korea, South Africa, Brazil, and Taiwan all lagged. China has trounced all major developed and emerging markets year-to-date, returning more than 20% in local currency terms.
Relative COVID-19 trends may help explain divergent year-to-date regional performance as Asian countries (excluding India) have been successful in keeping a virus resurgence at bay. Additionally, Asian companies are outperforming on a fundamental basis. Thus far, reported third quarter year-over-year EPS for Asia ex Japan companies are growing at a double-digit clip, in contrast to steep declines in the developed universe. For the full year, analysts currently expect marginal EPS growth for the emerging Asia index universe versus declines of nearly 30% and more than 50% for EMEA and Latin America, respectively. The Chinese economic recovery continued in third quarter with GDP expanding 4.9% year-over-year, though the result underwhelmed expectations and Chinese GDP remains 3.6% below 2019 year-end levels. Other economic data also pointed to a continuation of the recovery. Business activity indicators across both manufacturing and services reached multi-year highs, implying a strongly expansionary environment. The Chinese unemployment rate fell, while industrial output and retail sales expanded and exceeded expectations.
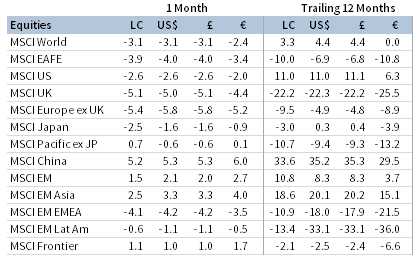
OCTOBER 2020 EQUITY INDEX PERFORMANCE (%)
Sources: MSCI Inc. and Thomson Reuters Datastream. MSCI data provided “as is” without any express or implied warranties.
Fixed Income
US Treasuries and investment-grade corporate bonds declined, while high-yield counterparts gained despite heightened equity volatility. Corporate credit spreads fell to their lowest levels since February. The Treasury yield curve steepened to its widest ten-year/two-year yield spread (74 basis points) since February 2018, as longer-maturity yields rose and shorter-dated notes remained well-anchored. Five- and ten-year Treasury yields climbed 10 and 19 bps to 0.38% and 0.88%, respectively. US TIPS declined but edged nominal Treasuries, pushing real yields and breakeven inflation higher. Tax-exempt municipal bonds were also down and bested taxable Treasuries.
Relative performance among sterling-denominated bonds mirrored their US dollar counterparts, whereas euro-denominated bonds reflected greater risk aversion. Five- and ten-year Gilt yields both gained 4 bps to -0.02% and 0.30%, respectively. UK linkers topped other sterling-denominated investment grade bond categories and real yields moved lower. Ten-year German bund yields fell 10 basis points to -0.62%, as European sovereigns outperformed investment-grade and high-yield corporates. The European Union debuted its first-ever common-debt security in October, selling €17 billion worth of mutualized bonds to finance the COVID-19 relief effort. The sale was met with strong demand and priced at a yield of -0.26%, well above those on offer from benchmark German bunds.
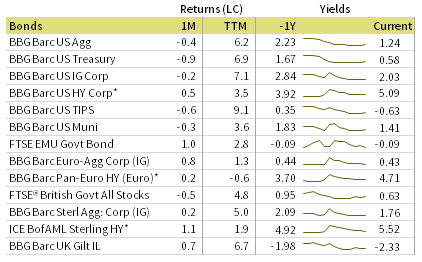
OCTOBER 2020 BOND INDEX PERFORMANCE (%)

OCTOBER 2020 NOMINAL YIELD CURVES
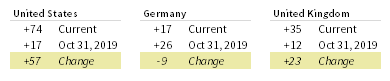
10Y/2Y YIELD CURVE SPLIT
* High-yield index yield data represent option-adjusted spread.
Sources: Bank of England, Bloomberg Index Services Limited, BofA Merrill Lynch, Federal Reserve, FTSE Fixed Income LLC, FTSE International Limited, Intercontinental Exchange, Inc., and Thomson Reuters Datastream.
Real Assets
Commodity futures were mixed, as falling oil prices weighed on the energy-heavy S&P GSCI Index and gains in agriculture and industrial metals buoyed the Bloomberg Commodity Total Return Index. Copper prices, widely viewed as a barometer of global economic health, rose to their highest level since June 2018 on strong Chinese demand.
Oil prices ($37.46 for Brent and $35.79 for WTI) declined as renewed COVID-19 lockdown measures threaten to stifle demand. On the supply side, OPEC production increased for the fourth consecutive month in October. Libyan output has surged to near 1 million barrels per day resulting from a truce in the nation’s civil war, which included the lifting of an oil export blockade.
Global natural resources equities (NREs) declined along with oil prices, whereas MLPs gained despite a 9% sell-off in the final week of the month when top-weighted Energy Transfer LP announced it would cut its distribution in half. NREs are on pace for their worst calendar year return since 2008.
Global developed REITs broadly declined. Europe ex UK REITs, Asia REITs, and US REITs all underperformed, while declines for UK REITs were less severe.
Gold ($1,880.77 per troy ounce) declined for the third consecutive month as real yields and the US dollar climbed. Prices ended the month more than 8% below their early-August peak, but have advanced roughly 24% in 2020. The World Gold Council reported that in third quarter, global central banks became net sellers of the yellow metal for the first time in ten years.
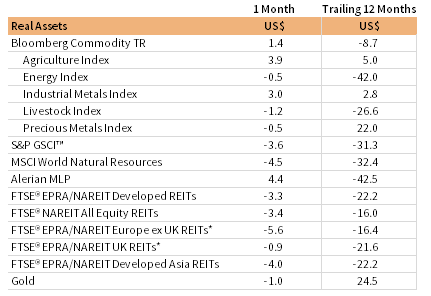
OCTOBER 2020 REAL ASSETS PERFORMANCE (%)
* Europe ex UK REITs are in EUR terms and UK REITs in GBP terms.
Sources: Alerian, Bloomberg L.P., EPRA, FTSE International Limited, Intercontinental Exchange, Inc., MSCI Inc., National Association of Real Estate Investment Trusts, Standard & Poor’s, and Thomson Reuters Datastream. MSCI data provided “as is” without any express or implied warranties.
Notes: Total return data for all MSCI indexes are net of dividend taxes. Gold performance based on spot price return.
USD-Based Investors
Most asset classes fell in October, with real assets and developed markets equities posting the sharpest declines. Emerging markets equities and US small caps topped developed and large-cap counterparts, respectively, while US shares continued outperforming developed ex US equivalents. Commodities declined the most, driven by an oil market sell-off.
Safe havens gold and US Treasuries declined, offering little respite amid near record high prices and ultralow yields. Within fixed income, high-yield and investment-grade corporate bonds outperformed Treasuries, while tax-exempt municipal bonds and TIPS also outperformed their sovereign counterparts.
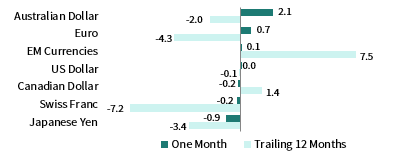
US dollar performance was mixed. The greenback appreciated the most versus the Australian dollar and euro, but declined the most against the safe-haven Japanese yen and Swiss franc. The US dollar mostly declined over the past year, falling the most versus the Swiss franc and euro, but gaining significantly versus an equal-weighted basket of emerging markets currencies.
US stocks ended the month with their worst weekly decline since March, approaching correction territory from early September highs as COVID-19 cases surged and US Congress failed to pass further fiscal stimulus. The November 3 general election now takes center stage, and investors will anxiously await the result and its implications for future fiscal relief packages and longer-term policies. The US earnings season is progressing better than expected, but overall EPS are expected to decline nearly 10%. US third quarter GDP expanded a record 33.1% annualized but GDP was down nearly 3% on a year-over-year basis, with economic output 3.5% below 2019 year-end levels.
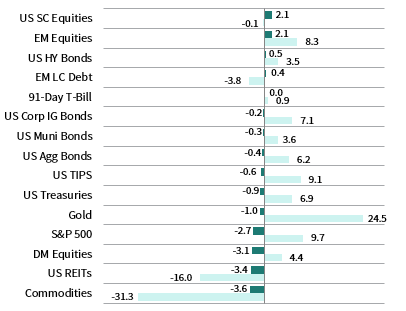
INDEX PERFORMANCE (US$)

US DOLLAR PERFORMANCE VS VARIOUS CURRENCIES
Sources: Bloomberg Index Services Limited, FTSE International Limited, Frank Russell Company, Intercontinental Exchange, Inc., J.P. Morgan Securities, Inc., MSCI Inc., National Association of Real Estate Investment Trusts, Standard & Poor’s, and Thomson Reuters Datastream. MSCI data provided “as is” without any express or implied warranties.
EUR-Based Investors
Real assets and developed markets equities declined the most in October. European stocks underperformed broader developed equivalents, while European small caps topped large caps. Emerging markets equities were the only main equity category to advance. Safe-haven gold declined despite equity market turbulence.
EMU government bonds advanced, outperforming investment-grade and high-yield corporate counterparts. The EU debuted its first-ever common-debt security in October, selling €17 billion worth of mutualized bonds to finance the COVID-19 relief effort.
The euro generally depreciated, falling the most vis-à-vis the Japanese yen but gaining against the Australian dollar. The euro has mostly appreciated over the past year, gaining the most against an equal-weighted basket of emerging markets currencies and declining versus only the Swiss franc.
European equities declined the most among major developed markets regions as COVID-19 cases spiked and officials announced nationwide lockdown measures across the region. The Eurozone’s third quarter economic recovery exceeded expectations with record GDP growth of 12.7% quarter-over-quarter; however, as in the United States, GDP remains below pre-pandemic levels. More troubling economic signals emerged as Eurozone CPI indicated the third consecutive month of deflation in October, the labor market recovery ended with jobless numbers increasing by 75,000, and preliminary business activity indicators missed expectations and fell into contractionary territory.
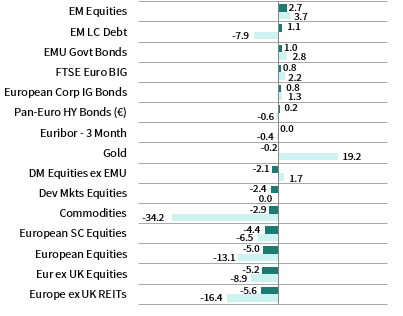
INDEX PERFORMANCE (€)

EURO PERFROMANCE VS VARIOUS CURRENCIES
Sources: Bloomberg Index Services Limited, EPRA, European Banking Federation, FTSE Fixed Income LLC, FTSE International Limited, ICE Benchmark Administration Ltd., J.P. Morgan Securities, Inc., MSCI Inc., National Association of Real Estate Investment Trusts, Standard & Poor’s, and Thomson Reuters Datastream.
GBP-Based Investors
Real assets and developed markets equities declined the most in October. UK stocks bested Europe ex UK peers, while both segments trailed the broader developed index. UK mid caps topped broader UK shares. Emerging markets gained and were the top-performing major equity segment.
Gold and UK Gilts both declined, offering little respite to investors amid near record high prices and ultralow yields. UK high-yield and investment-grade corporate bonds gained, while UK linkers also outperformed nominal Gilts.
UK sterling was mixed, appreciating versus the Australian dollar and euro, and declining the most vis-à-vis safe havens like the Japanese yen and Swiss franc. UK sterling mostly weakened over the past year, but gained in value against emerging markets currencies and the Canadian dollar.
Brexit negotiations ramped up with the year-end transition deadline fast approaching. Trade talks had stalled in mid-October, leading Prime Minister Boris Johnson to warn that the country should prepare for a no-deal Brexit outcome. However, talks resumed by month-end and now enter an intensified final phase. The ongoing uncertainty has dented UK equity valuations. Our normalized metric ended the month at the 11th percentile on an absolute basis and at the lowest relative valuation to broader developed markets since 1979.
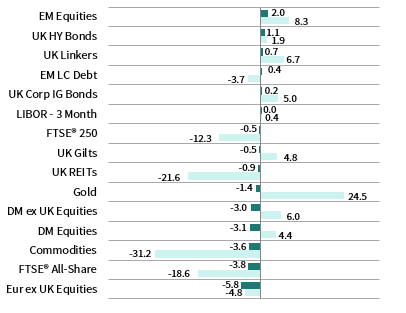
INDEX PERFORMANCE (£)
POUND STERLING PERFORMANCE VS VARIOUS CURRENCIES
Sources: Bloomberg Index Services Limited, EPRA, FTSE International Limited, Intercontinental Exchange, Inc., ICE Benchmark Administration Ltd., J.P. Morgan Securities, Inc., MSCI Inc., National Association of Real Estate Investment Trusts, Standard & Poor’s, and Thomson Reuters Datastream.
Performance Exhibits
All data are total returns unless otherwise noted. Total return data for all MSCI indexes are net of dividend taxes.
USD-Based Investors index performance chart includes performance for the Bloomberg Barclays US Aggregate Bond, Bloomberg Barclays US Corporate Investment Grade, Bloomberg Barclays US High Yield Bond, Bloomberg Barclays Municipal Bond, Bloomberg Barclays US TIPS, Bloomberg Barclays US Treasuries, ICE BofAML 91-Day Treasury Bills, FTSE® NAREIT All Equity REITs, J.P. Morgan GBI-EM Global Diversified, LBMA Gold Price, MSCI Emerging Markets, MSCI World, Russell 2000®, S&P 500, and S&P GSCI™ indexes.
EUR-Based Investors index performance chart includes performance for the Bloomberg Barclays Euro-Aggregate: Corporate, Bloomberg Barclays Pan-Euro High Yield (Euro), EURIBOR 3M, FTSE EMU Govt Bonds, FTSE Euro Broad Investment-Grade Bonds, FTSE® EPRA/NAREIT Europe ex UK RE, J.P. Morgan GBI-EM Global Diversified, LBMA Gold Price AM, MSCI Emerging Markets, MSCI Europe, MSCI Europe ex UK, MSCI Europe Small-Cap, MSCI World ex EMU, MSCI World, and S&P GSCI™ indexes.
GBP-Based Investors index performance chart includes performance for the Bloomberg Barclays Sterling Aggregate: Corporate Bond, Bloomberg Barclays Sterling Index-Linked Gilts, ICE BofAML Sterling High Yield, FTSE® 250, FTSE® All-Share, FTSE® British Government All Stocks, FTSE® EPRA/NAREIT UK RE, J.P. Morgan GBI-EM Global Diversified, LBMA Gold Price AM, LIBOR 3M GBP, MSCI Emerging Markets, MSCI Europe ex UK, MSCI World, MSCI World ex UK, and S&P GSCI™ indexes.
EM currencies is an equal-weighted basket of 20 emerging markets currencies.
Fixed Income Performance Table
Performance data for US TIPS reflect the Bloomberg Barclays US TIPS Index, with yields represented by the Bloomberg Barclays Global Inflation Linked Bond Index: US.