Most risk assets advanced in October as trade tensions cooled, monetary policy eased, and better-than-feared corporate earnings results propelled markets higher. Emerging markets stocks outperformed developed markets counterparts in major currency terms for just the second month this year. Growth outperformed value, bouncing back after value surged in September, and small caps outgained large caps. Investment-grade and high-yield corporate bonds outpaced sovereigns as yield curves generally steepened and credit spreads tightened. Most real assets gained, save for natural resources equities as earnings declined sharply. Among currencies, UK sterling and the euro strengthened on Brexit progress, while the US dollar broadly weakened.
Global geopolitical tensions appeared to ease and corporate earnings reports for third quarter 2019 largely exceeded significantly reduced expectations, calming fears of a more significant corporate downturn. Additionally, the Federal Reserve cut policy rates by 25 basis points (bps), as expected, for the third consecutive time this year. Fed Chairman Jerome Powell noted that current monetary policy was “likely to remain appropriate,” assuming incoming data remains broadly consistent with the Fed’s favorable economic outlook, effectively pausing the mid-cycle adjustment. On the trade front, the United States and China indicated progress toward a “phase one” trade deal. The Trump administration called off a planned October 15 tariff increase on $250 billion of Chinese goods as US trade officials aimed to secure an increase in China’s purchases of American agricultural products, while the two sides also negotiated issues such as intellectual property theft and currency manipulation. Despite the signs of progress towards a partial trade agreement, both countries remain at odds over deeper structure reforms. Odds of a hard Brexit abated in the United Kingdom, and sterling surged as Boris Johnson secured a revised withdrawal agreement with the EU; Parliament supported the deal in principle, but rejected the government’s speedy implementation plan. The EU later granted the United Kingdom a Brexit deadline “flextension” until January 31, 2020, and Parliament agreed to hold an early general election in mid-December, putting the Brexit issue back in the hands of voters. Despite supportive geopolitical developments, global manufacturing, trade, and business investment remain weak, with signs that weakness may be spreading to the services sector, particularly in Europe. The International Monetary Fund reduced its 2019 global economic growth outlook by 0.2 percentage points to 3.0%, which would be the lowest growth rate since 2009. Projections for 2020 indicate a modest growth rebound, predicated on recoveries for certain strained emerging markets, while major economies such as the United States and China are expected to continue slowing.
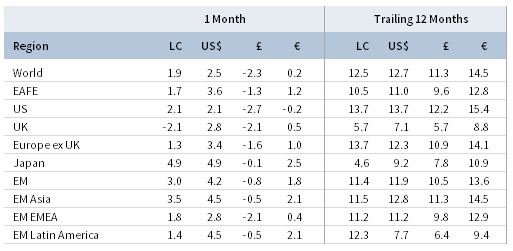
TOTAL RETURN FOR MSCI INDEXES (%)
US equities (2.2% for the S&P 500 Index) climbed to new record highs in October, but underperformed broader developed markets in major currency terms for just the second month in 2019. US stocks gained 23.2% year-to-date, and 14.3% over the past year. Six of 11 S&P 500 sectors advanced, led by healthcare, information technology, and communication services, whereas energy and utilities declined the most. Growth stocks outperformed value equivalents for the ninth time in the last 12 months, while small caps bested their large-cap brethren for the second consecutive month. Third quarter earnings growth reports thus far have largely exceeded depressed expectations. Quarterly earnings are expected to decline 2.7% year-over-year, based on reports from more than two-thirds of S&P 500 constituents, which compares favorably to earlier expectations of 4.1% decline as of third quarter. Analysts now expect full year 2019 earnings growth of just 1.3%, more than 10 percentage points lower than estimates at the beginning of the year, as profit margins are expected to contract for the third consecutive quarter. The US economy expanded at a 1.9% annualized rate in third quarter, more than anticipated and in line with the Fed’s long-run growth expectation. Consumer spending continued to drive the US economic expansion, whereas business investment declined for the second straight quarter amid the uncertain trade environment. Strong jobs numbers assuaged downturn fears stemming from weak manufacturing survey data. The unemployment rate dipped to a 50-year low at 3.5% and average weekly hours—a popular leading economic indicator—were unchanged.
European equities (3.2% in USD, 0.9% in EUR, -1.7% in GBP) outperformed broader developed stocks in major currency terms for the second consecutive month, but still lagged developed markets on a year-to-date and 12-month basis. Europe ex UK outperformed UK equivalents as sterling appreciation weighed on UK-listed shares, which declined in local currency terms. Trade-exposed Germany was the top-performing large Europe ex UK market, boosted by cooling trade tensions. Third quarter European earnings contracted year-over-year based on results from roughly half of companies expected to report. Eurozone economic growth in third quarter exceeded expectations, expanding 0.2% quarter-over-quarter. Despite the modest growth, the Eurozone economy continues to feel the effects of global trade tensions. A widely followed economic sentiment indicator fell to the lowest levels in nearly five years, while year-over-year inflation broadly trended downward. Germany, the largest country in the Eurozone, is expected to enter a technical recession in third quarter with two straight quarterly growth contractions. German manufacturing indicators remained in contractionary territory, while services indicators slowed more than expected, resulting in an economy-wide activity decline for the second month in a row. In the United Kingdom, output expanded in the three months through August and the economy is now expected to avoid a recession in third quarter, as retail sales grew more than 3% year-over-year. However, UK data indicated falling activity across manufacturing, services, and construction.
Japanese equities (4.9% in USD, 2.5% in EUR, -0.1% in GBP) outperformed broader developed stocks, but still trail year-to-date and over the trailing 12 months. Early earnings reports indicated that EPS growth turned positive in calendar third quarter after three straight quarters of EPS declines. The export-heavy Japanese equity market rallied in October on global trade tension relief. Notably, the United States and Japan signed a limited trade deal that cuts tariffs on US agricultural products and Japanese industrial products, while also reducing the probability of increased auto tariffs proposed by the United States. Despite growing trade optimism, other Japanese economic data were more mixed. Retail sales surged the most since 2014 as Japanese consumers sought to secure big ticket items ahead of an increase in the national sales tax to 10% from 8% that went into effect on October 1. Unemployment in Japan remained near multi-decade lows, as government officials indicated the labor market is close to full employment. However, manufacturing activity remained in contractionary territory for the sixth straight month, while exports fell for the tenth straight month, and already-low inflation cooled. The Bank of Japan held interest rates steady, but signaled a willingness to cut rates further in the future; Prime Minister Shinzo Abe pledged to support the economy via fiscal measures.
Emerging markets equities (4.2% in USD, 1.8% in EUR, -0.8% in GBP) outperformed developed equivalents in major currency terms for the first time since January, supported by a weakening US dollar. While emerging markets trail significantly year-to-date, underperformance over the trailing 12 months narrowed to about one percentage point in major and local currency terms. Among regions in major currency terms, heavily weighted emerging Asia and Latin America outperformed, whereas emerging Europe, the Middle East & Africa underperformed broader emerging stocks. Latin America trailed other regions in local currency terms, but relative Brazilian real strength boosted currency-translated returns. All major emerging markets countries advanced, led by Taiwan, India, and China. China’s year-over-year GDP growth slowed more than expected in third quarter, as the effects of the ongoing trade war continue to weigh on the domestic economy. India’s central bank cut its benchmark policy rate for the fifth time in as many meetings, following September’s corporate tax cuts, in an effort to support the slowing economy. Russia, the seventh-largest emerging markets component, was the top-performing market in October and over the past year. Frontier markets equities (0.8% in USD, -1.5% in EUR, -4.0% in GBP) underperformed developed and emerging counterparts.
Real assets generally advanced in October, save for losses in global natural resources equities. Commodity futures (2.0% for the Bloomberg Commodity TR Index and 1.2% for the energy-heavy S&P GSCI™ Index) gained across all sub-indexes, led by precious and industrial metals. Oil prices ($60.23 for Brent and $54.18 for WTI) were relatively flat; the International Energy Agency cut its oil demand outlook for 2019 and 2020 based on economic growth concerns, and robust US production kept a lid on prices. Global natural resources equities (-0.6% for the MSCI World Natural Resources Index in USD terms) and energy MLPs (-6.2%) declined, as energy firms reported steep drops in third quarter earnings. Global developed REITs (2.5% in USD terms) advanced across the board despite stretched valuations and generally higher government bond yields during the month; UK REITs (5.0%) and Asia REITs (2.9% in USD terms) gained the most, followed by Europe ex UK REITs (1.5%) and US REITs (1.1%). Gold prices (2.5%) climbed to $1,510.23/troy ounce as economic uncertainties persisted and the US dollar broadly declined.
Fixed income performance varied by region, but corporate bonds generally outperformed sovereign counterparts. US corporate investment-grade (0.6%) and high-yield (0.3%) bonds outperformed nominal Treasuries (0.1%) as the US yield curve steepened. Five-year Treasury yields fell 4 bps to 1.51%, whereas ten-year yields climbed 1 bp to 1.69%. Short-term Treasury yields declined as the Fed cut rates, began expanding its balance sheet, and increased liquidity to stabilize conditions in the short-term lending market. The 10-year/3-month yield spread reverted to positive territory for the first time since late July. However, a reversion to a positive slope doesn’t necessarily imply that a recession will be avoided; the slope of the yield curve moved from negative to positive territory ahead of or during each the past seven US economic downturns. UK gilts (-1.8%) declined, underperforming UK high-yield (0.7%) and investment-grade corporate bonds (-0.2%). Five- and ten-year Gilt yields rose 15 and 14 bps to 0.40% and 0.60%, respectively. UK linkers (-5.3%) declined as inflation remained at its lowest rate since late 2016. EMU government bonds (-1.1%) also declined as German ten-year bund yields rose to -0.40%. US TIPS (0.3%) and tax-exempt municipal bonds (0.2%) outgained nominal US Treasuries.
The euro and UK sterling generally appreciated last month, whereas the US dollar broadly weakened. The greenback declined the most vis-à-vis UK sterling, the euro, and the Australian dollar, but was relatively flat versus the Japanese yen. Over the past year, the US dollar depreciated versus the Japanese yen, Swiss franc, UK sterling, and our basket of emerging markets currencies, but gained versus the Australian dollar and euro. The euro advanced against all currencies we track, save for UK sterling, gaining the most against the Japanese yen, US dollar, and Canadian dollar. The euro is mostly weaker over the past year, gaining relative to only the Australian dollar. UK sterling broadly advanced in October as the probability of a hard Brexit outcome faded. Sterling gained the most against the Japanese yen, US dollar, and Canadian dollar, and has strengthened over the past year against all but the safe-haven Japanese yen and Swiss franc.
Currency Performance as of October 31, 2019
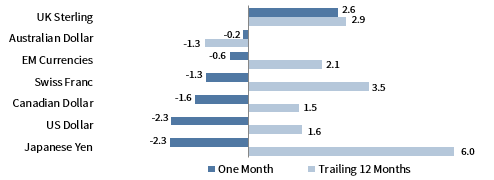
The US dollar fell against most currencies we track, depreciating the most vis-à-vis UK sterling and the euro as hard-Brexit risk diminished, and the Fed cut rates. The greenback weakened the most versus the Japanese yen, Swiss franc, and UK sterling over the past year, but gained against the euro and Australian dollar.
VERSUS THE US DOLLAR
Total Return (%)
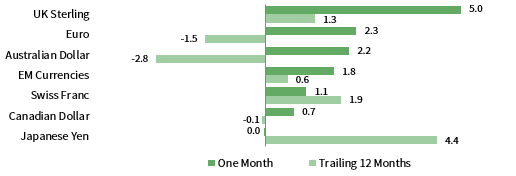
The euro generally appreciated, gaining the most versus the Japanese yen, US dollar, and Canadian dollar. The common currency depreciated against only UK sterling. Euro performance was weak over the past year, gaining in value versus only the Australian dollar.
VERSUS THE EURO
Total Return (%)
UK sterling surged in October as the Brexit deadline was delayed once again and Parliament approved a December general election. UK sterling has also appreciated over the past year, but declined in value relative to safe-haven currencies, the Japanese yen and Swiss franc.

Note: EM currencies is an equal-weighted basket of 20 currencies.
USD Market Performance as of October 31, 2019
Risk-on sentiment permeated markets in October. EM equities outperformed DM equivalents, while US small caps bested large caps. Domestic bond categories trailed equities as IG corporate and HY bonds outgained sovereign counterparts. Yield-sensitive US REITs and gold trounced other assets over the past year.
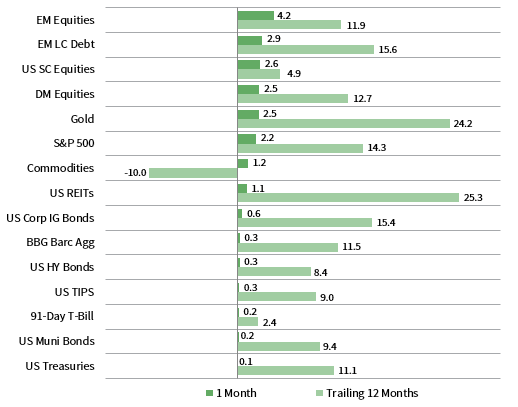
INDEX PERFORMANCE (US$)
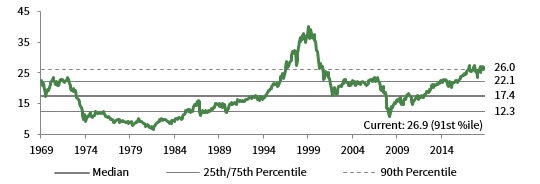
COMPOSITE NORMALIZED P/E: MSCI US
December 31, 1969 – October 31, 2019
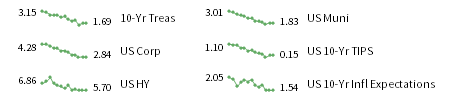
FIXED INCOME YIELDS
October 2018 – October 2019
Euro Market Performance as of October 31, 2019
European small caps and EM equities outperformed large-cap and developed counterparts, respectively. Europe ex UK stocks outgained the broader developed markets index. High-yield bonds delivered the lone gain among domestic bonds as yields rose, outperforming invesment-grade corporate and government bond peers.
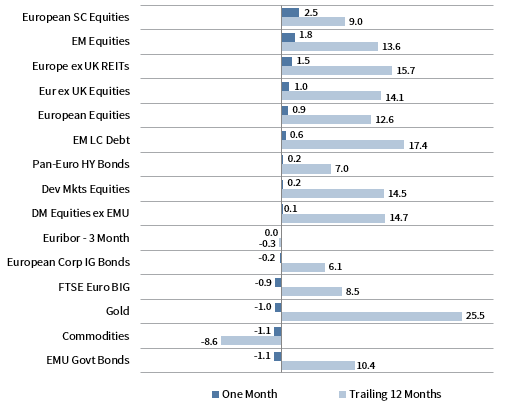
INDEX PERFORMANCE (€)
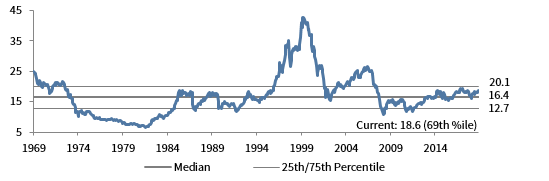
COMPOSITE NORMALIZED P/E: MSCI EUROPE EX UK
December 31, 1969 – October 31, 2019
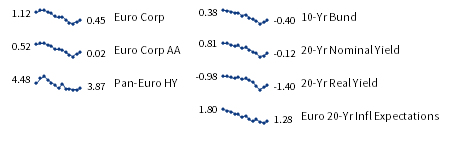
FIXED INCOME YIELDS
October 2018 – October 2019
Sources: Bloomberg Index Services Limited, Bloomberg L.P., EPRA, FTSE International Limited, J.P. Morgan Securities, Inc., MSCI Inc., National Association of Real Estate Investment Trusts, Standard & Poor’s, and Thomson Reuters Datastream. MSCI data provided “as is” without any express or implied warranties
GBP Market Performance as of October 31, 2019
Most UK assets declined as sterling strength dented translated returns. UK equities bested Europe ex UK and DM peers, but declined overall. HY bonds bested IG corporates and UK gilts as UK yields climbed. Real assets diverged: UK REITs handily outperformed, while commodities and gold lagged.
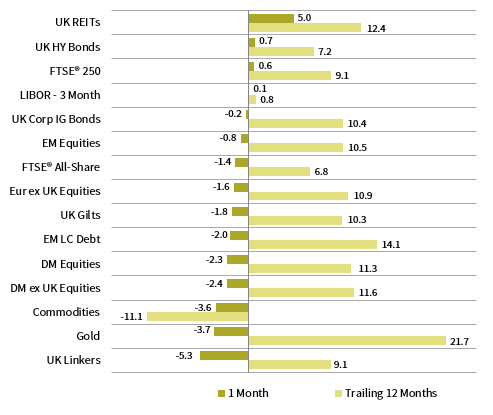
INDEX PERFORMANCE (₤)
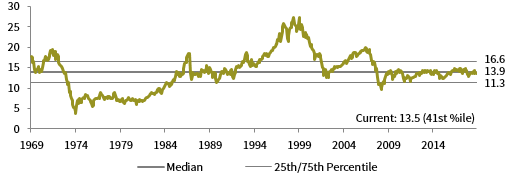
COMPOSITE NORMALIZED P/E: MSCI UK
December 31, 1969 – October 31, 2019
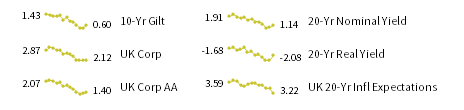
FIXED INCOME YIELDS
October 2018 – October 2019
Sources: Bloomberg Index Services Limited, Bloomberg L.P., EPRA, FTSE International Limited, Intercontinental Exchange, Inc., J.P. Morgan Securities, Inc., MSCI Inc., National Association of Real Estate Investment Trusts, Standard & Poor’s, and Thomson Reuters Datastream. MSCI data provided “as is” without any express or implied warranties.
Exhibit Notes
Performance Exhibits
Total return data for all MSCI indexes are net of dividend taxes.
US dollar index performance chart includes performance for the Bloomberg Barclays Aggregate Bond, Bloomberg Barclays Corporate Investment Grade, Bloomberg Barclays High-Yield Bond, Bloomberg Barclays Municipal Bond, Bloomberg Barclays US TIPS, Bloomberg Barclays US Treasuries, BofA Merrill Lynch 91-Day Treasury Bills, FTSE® NAREIT All Equity REITs, J.P. Morgan ELMI+, J.P. Morgan GBI-EM Global Diversified, MSCI Emerging Markets, MSCI World, Russell 2000®, S&P 500, and S&P GSCI™ indexes.
Euro index performance chart includes performance for the Bloomberg Barclays Euro-Aggregate: Corporate, Bloomberg Barclays Pan-Euro High Yield, Citigroup EMU Govt Bonds, Citigroup Euro Broad Investment-Grade Bonds, Euribor 3-month, FTSE® EPRA/NAREIT Europe ex UK, J.P. Morgan ELMI+, J.P. Morgan GBI-EM Global Diversified, MSCI Emerging Markets, MSCI Europe, MSCI Europe ex UK, MSCI Europe Small-Cap, MSCI World ex EMU, MSCI World, and S&P GSCI™ indexes.
UK sterling index performance chart includes performance for the Bloomberg Barclays Sterling Aggregate: Corporate Bond, BofA Merrill Lynch Sterling High Yield, FTSE® 250, FTSE® All-Share, FTSE® British Government All Stocks, FTSE® British Government Index-Linked All Stocks, FTSE® EPRA/NAREIT UK RE, J.P. Morgan ELMI+, J.P. Morgan GBI-EM Global Diversified, LIBOR 3M GBP, MSCI Emerging Markets, MSCI Europe ex UK, MSCI World, MSCI World ex UK, and S&P GSCI™ indexes.
Valuation Exhibits
The composite normalized P/E ratio is calculated by dividing the inflation-adjusted index price by the simple average of three normalized earnings metrics: ten-year average real earnings (i.e., Shiller earnings), trend-line earnings, and return on equity–adjusted earnings. We have removed the bubble years 1998–2000 from our mean and standard deviation calculations. All data are monthly.
Fixed Income Yields
US fixed income yields reflect Bloomberg Barclays Municipal Bond Index, Bloomberg Barclays US Corporate High Yield Bond Index, Bloomberg Barclays US Corporate Investment-Grade Bond Index, and the ten-year Treasury.
European fixed income yields reflect the BofA Merrill Lynch Euro Corporate AA Bond Index, BofA Merrill Lynch Euro Corporate Bond Index, Bloomberg Barclays Pan-European Aggregate High Yield Bond Index, Bloomberg Twenty-Year European Government Bond Index (nominal), ten-year German bund, 20-year European Inflation Swaps (inflation expectations), and the real yield calculated as the difference between the inflation expectation and nominal yield.
UK sterling fixed income yields reflect the ICE BofAML Sterling Corporate AA Bond Index, ICE BofAML Sterling Corporate Bond Index, UK ten-year gilts, Bank of England 20-year nominal yields, and Bloomberg Generic UK 20-year inflation-linked (real) yields.